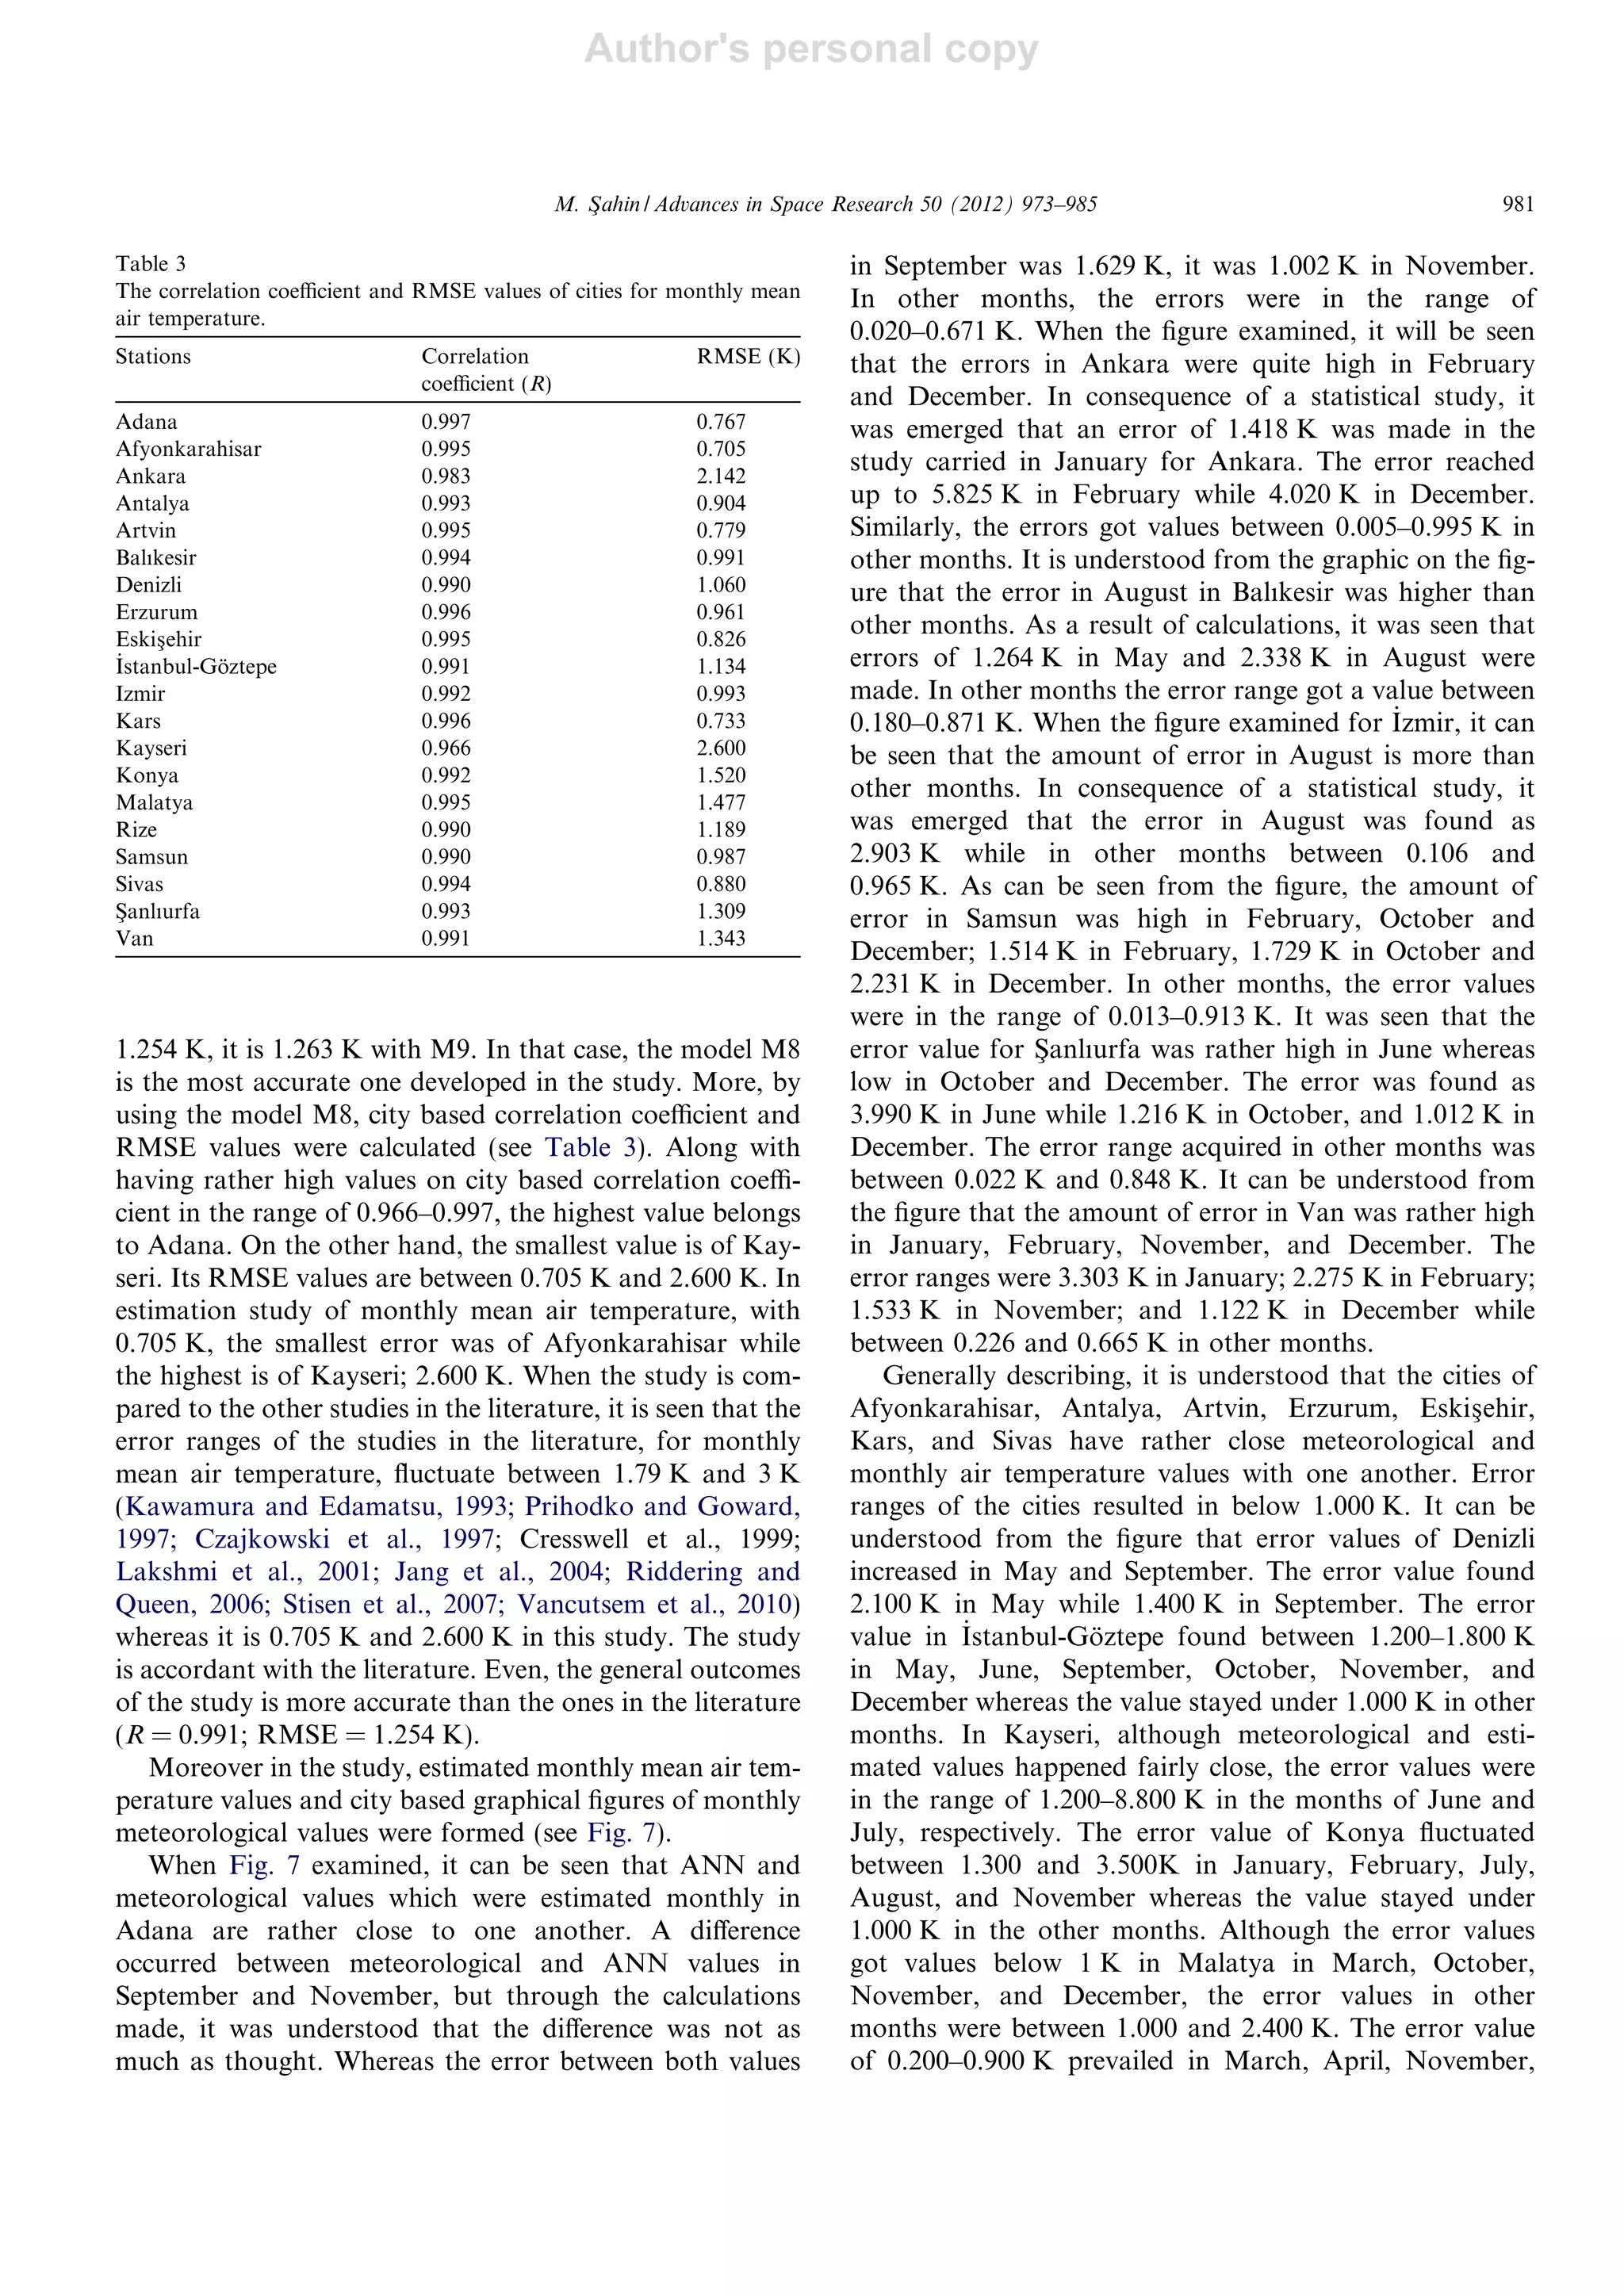
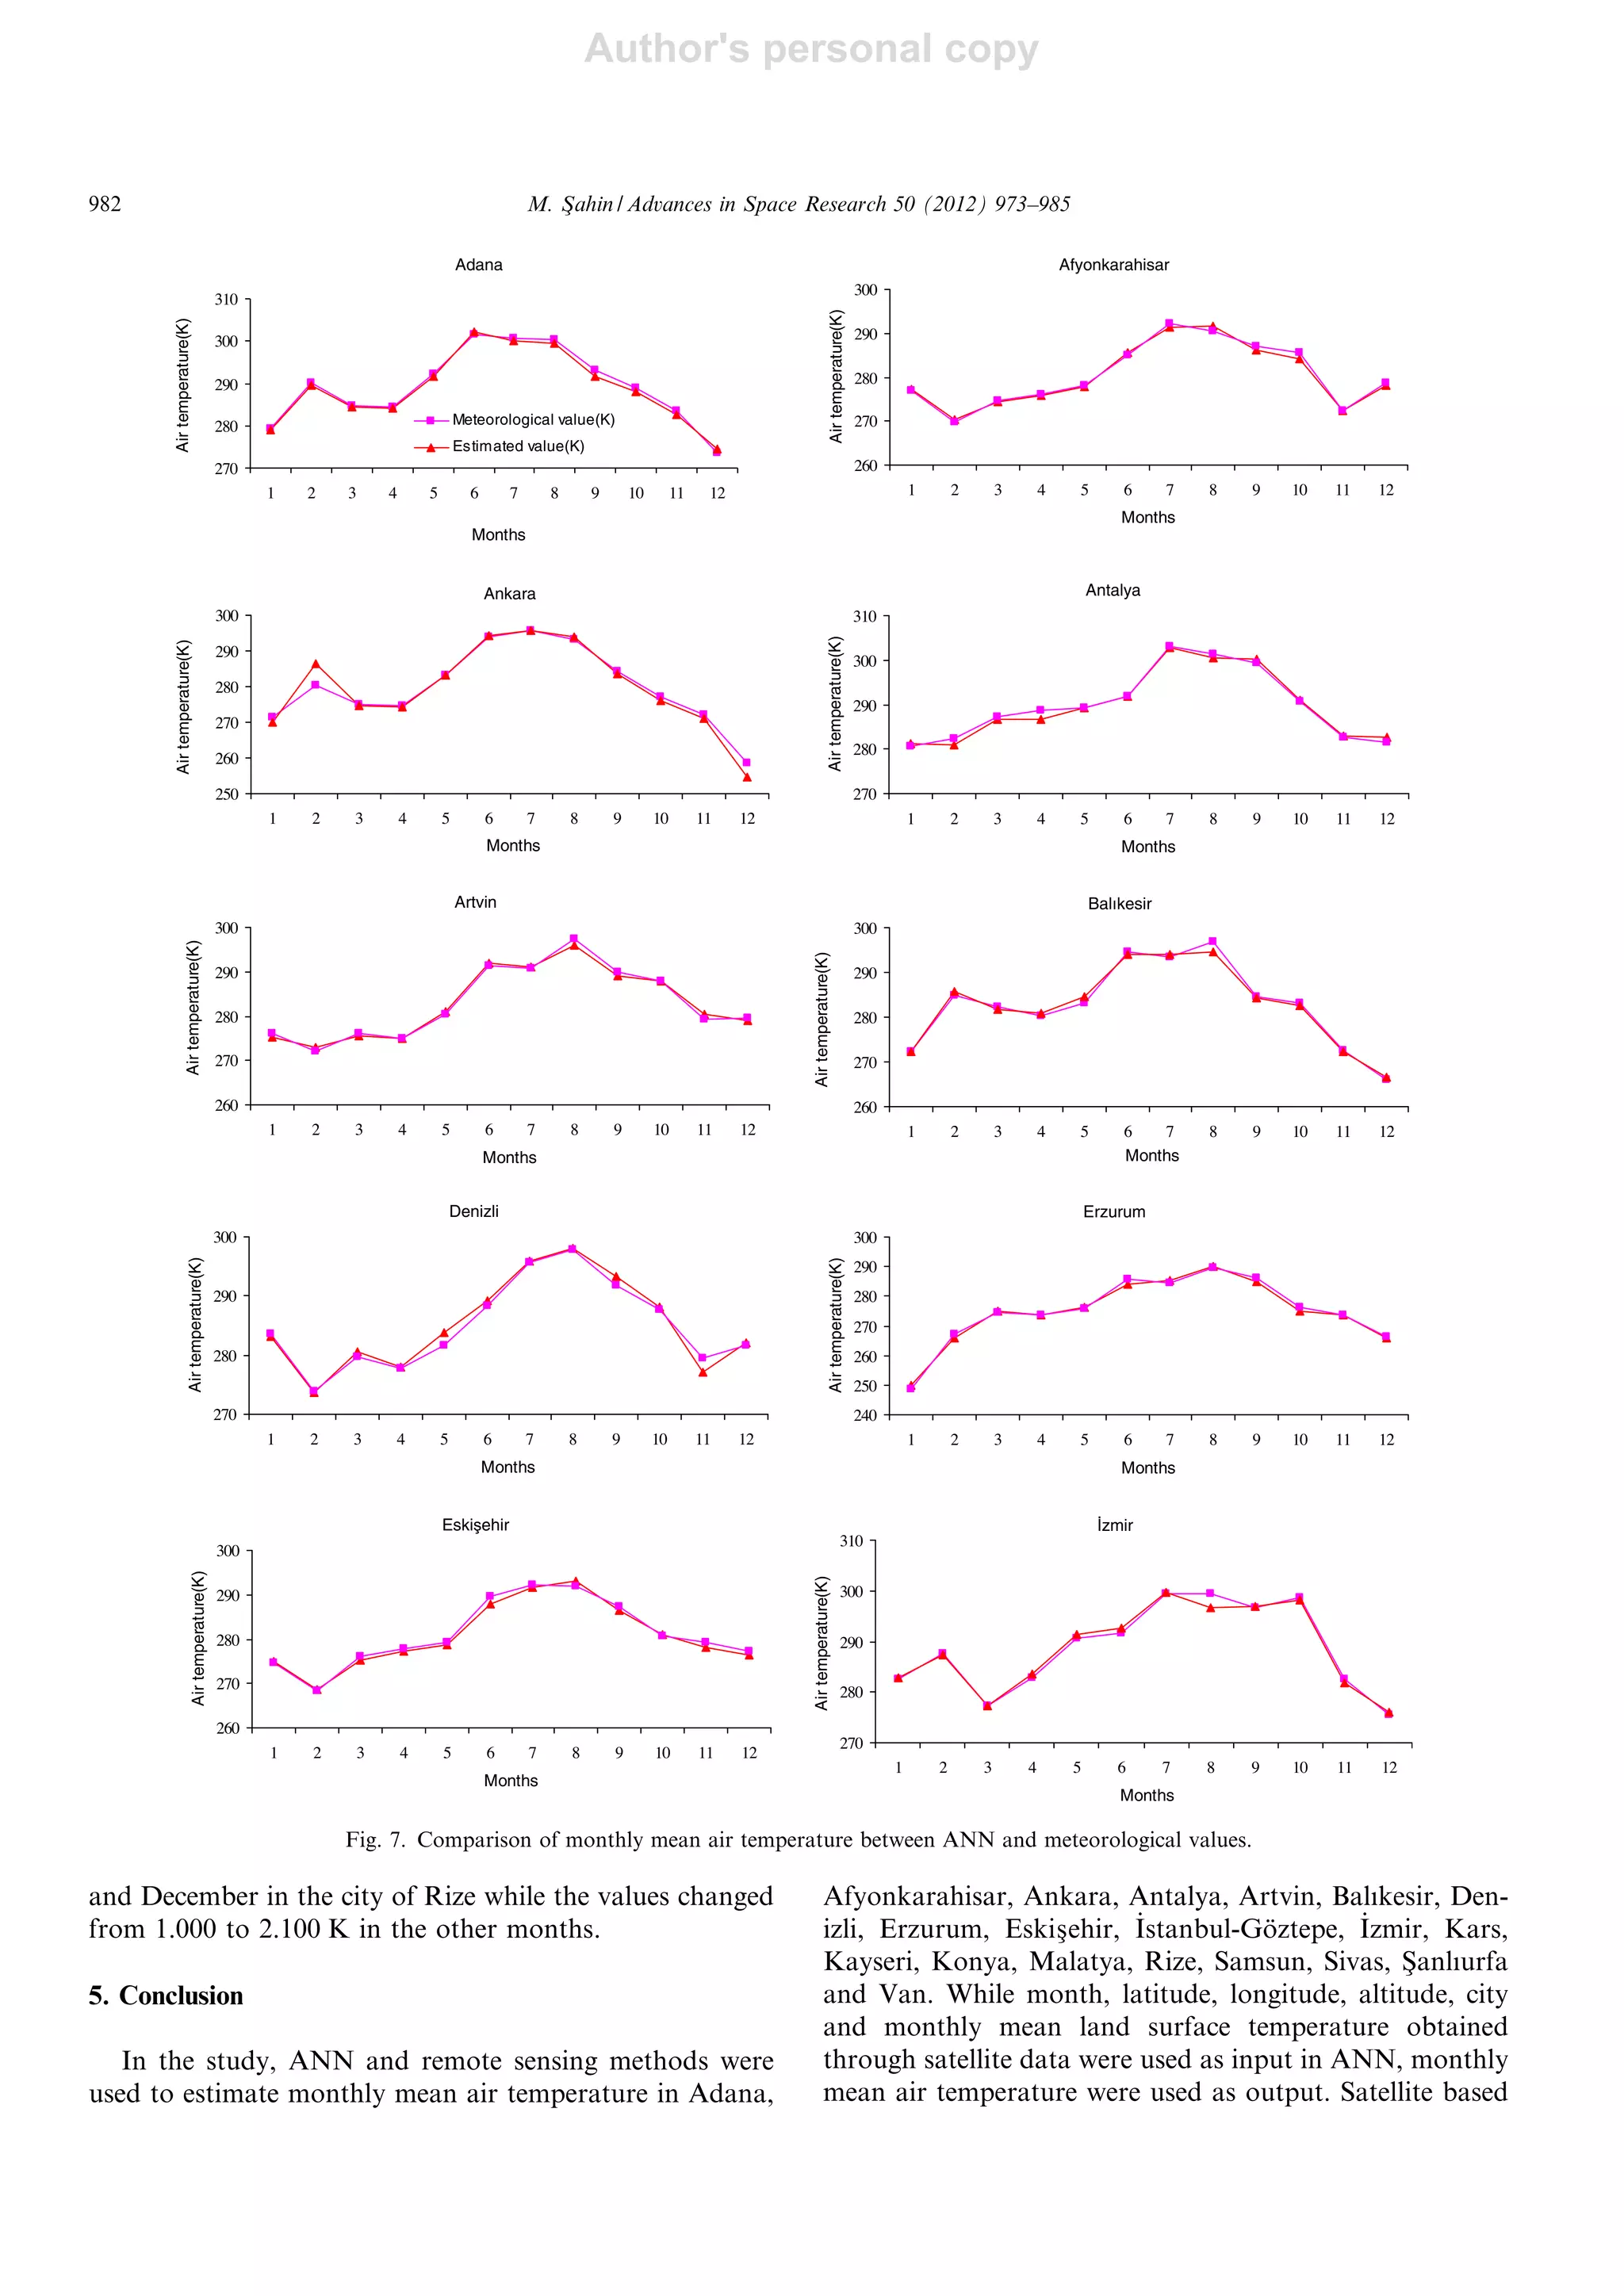
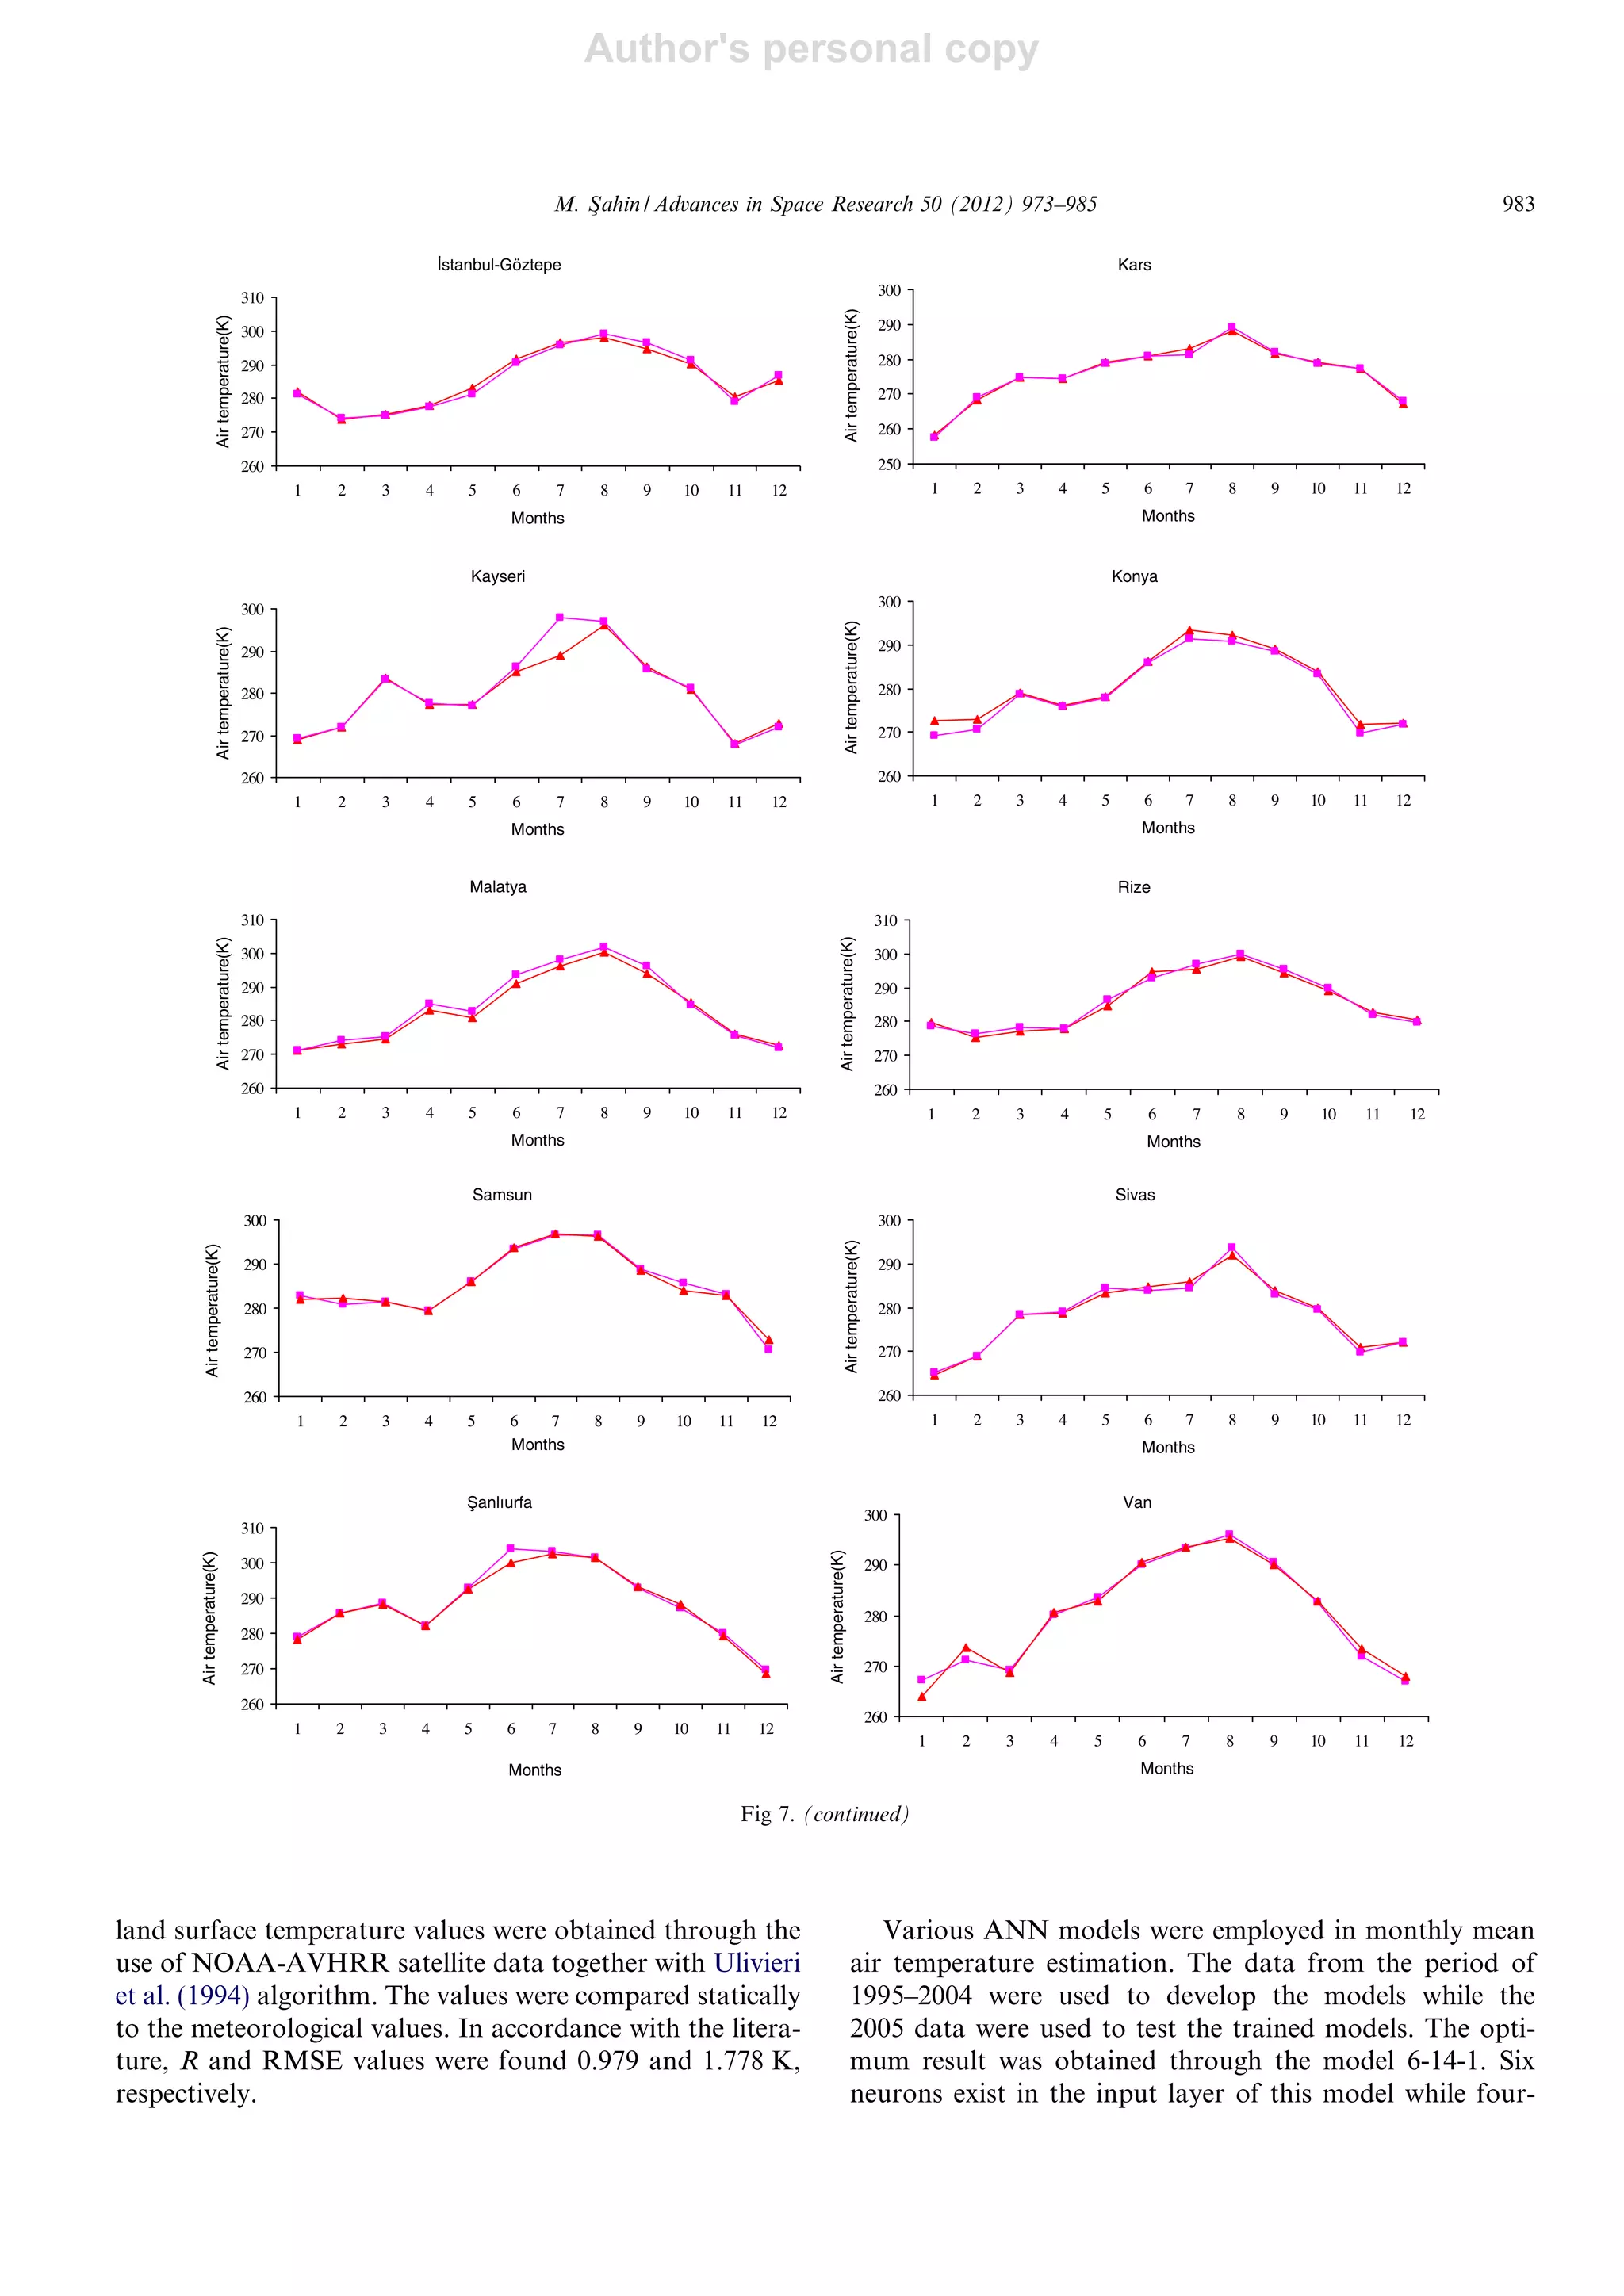
This document summarizes an article that used remote sensing data and an artificial neural network model to estimate monthly average air temperatures in 20 cities in Turkey. The model used land surface temperatures derived from NOAA satellite imagery as inputs along with other data. It achieved a strong linear correlation of 0.991 between estimated and measured air temperatures, with a root mean squared error of 1.254 K. The study demonstrated the ability to accurately estimate air temperatures over a large area using remote sensing and neural network modeling.
Forecasting of air temperature based on remotemehmet şahin
The aim of this research is to forecast air temperature based on remote sensing data. So, land surface
temperature and air temperature values which were measured by Republic of Turkey Ministry of Forestry and
Water Affairs (Turkish State Meteorological Service) during the period 1995–2001 at seven stations (Adana,
Ankara, Balıkesir, Đzmir, Samsun, Sanlıurfa, Van) were compared. The monthly land surface temperature and
air temperature were used to have correlation coefficients over Turkey. An empirical method was obtained from
equation of correlation coefficients. Separately, Price algorithm was used for the estimation of land surface
temperature values to get air temperatures. Then as statistical, air temperature values, belongs to meteorological
data in Turkey (26–45ºE and 36–42ºN) throughout 2002, were evaluated. The research results showed that
accuracy of estimation of the air temperature changes from 2.453ºK to 2.825ºK by root mean square error.
[PowerPoint 2019
Original design and layout may be distorted.]
Contains history of weather prediction from the ancient times and how math is involved. Also includes applications of weather prediction.
EVALUATION OF VERTICAL REFRACTIVITY PROFILE OVER MICROWAVE LINK IN MOWE, NIGERIAjmicro
The radio refractive index structure of the lower section of the atmospheric boundary layer is critical in the
planning and construction of microwave communication connections. This study analyses the refractivity
profile carried out in Mowe (6.8085° N, 3.4367° E) South – Western Nigeria. Ground measurements of air
pressure, temperature, and relative humidity used in this investigation were collected from the rain gauge
of the Tropospheric Observatory Data Acquisition Network (TRODAN). The radio refractivity, associated
refractivity gradient and climatic factor were computed using data from January 2012 to December 2013.
The vertical distributions of radio refractivity were then calculated using these parameters. Seasonal
fluctuations in refractivity are visible over the location, with high values in the wet season and low values
in the dry season. The findings also suggest that propagation circumstances fluctuate in frequency, with
sub-refractive situations being most common between April and September. This is an indication that
microwave link in Mowe will suffer higher signal loss during wet season, while the loss may be mild during
the dry season. The refractivity values in this study are expected to aid in determining the necessary
mitigation to be put in place to reduce loss of signal in Mowe.
Climate data can provide a great deal of information about the atmospheric environment that impacts almost all aspects of human endeavour. This module explains the importance of climate data, its storage, security, applications and other aspects, in a nutshell.
2013 ASPRS Track, Developing an ArcGIS Toolbox for Estimating EvapoTranspirat...GIS in the Rockies
Estimating water used by vegetated areas is very important for water resources management and water rights. Traditionally the amount of water delivered to an area is calculated by installing some measuring device (flumes, weirs, flow meters, etc.). The alternative approach presented here estimates the actual water use in a vegetated areas based on ground surface energy balance concept using the ReSET model (Remote Sensing of ET – ReSET developed by IDS group in Colorado state university) that uses satellite and Arial imagery with visible and thermal bands along with weather data to estimate daily actual crop Evapotranspiration (ET) for vegetated areas. Surface energy balance models have been proven to be a robust approach for estimating vegetation evapotranspiration. One of the main limitations of wider application of these models in water resources and irrigation management is the requirement of extensive back ground in surface energy modeling. This presentation shows the development and the application of an ArcGIS toolbox that runs an automated version of the ReSET model. The tool is compatible with NASA/USGS Landsat Legacy Project. The presented ArcGIS tool automates the model in all stages and requires minimum interference from user. The tool presented accommodates both basic and advanced users. The results using the tool were tested and validated using results from manual ReSET model runs.
Meteorological observations are made for a variety of reasons. They are used for the real-time preparation of weather charts and maps, for weather forecasts and severe weather warnings, for the study of climate, and for local weather-dependent operations. This module highlights all related details.
Weather forecasting is the application of science and technology to predict the state of the atmosphere for a future time and a given location. Now days, forecasting of accurate atmospheric conditions is the major challenge for the meteorologist and poor forecasting has significant impact on our daily lives. This brings the necessity to make research works on forecasting of the weather events with respect to Ethiopia.
Weather forecasting is the prediction of the state of the atmosphere for a given location using the application of science and technology. This includes temperature, rain, cloudiness, wind speed, and humidity. Weather warnings are a special kind of short-range forecast carried out for the protection of human life. This module explains the details of weather forecasting.
Ionospheric Behaviour Analysis over Thailand Using Radio Occultation TechniqueIJERA Editor
With the advent in the development of science and technology in the field of space and atmospheric science in
order to obtain accurate result, hence the use of radio occultation technique in the investigation of the amount of
electron density and Total Electron Content presence in equatorial region particularly over Thailand. In this
research, radio occultation data obtained from UCAR/CDAAC was used to observe daily, monthly, seasonal and
the entire year 2013 Ionospheric TEC and electron density variation due to changes and instability of solar
activities from time to time. It was observed that TEC was high (ionosphere was more disturbed or violent) in
May and spread over a wide range of altitude and summer season has the highest TEC value for the year 2013
which means at this period GNSS measurements was more prone to error. It was noted that ionospheric
variations or fluctuations was maximum between 200km and 450km altitude. The results of the study show that
ionospheric perturbation effects or irregularities depend on season and solar activity.
This deals with the assessment of several parameterizations of longwave radiation. The parametes were calibrated using a calibration tool on Ameriflux data.
PROBESEVEN creates strategic solution for enterprises across continents on IT Consultation, Software Development, Product Delivery and Services. On its rich understanding builds dynamic and user-friendly applications for smarter teams on business progress and success. Explore our tailor-made solutions for accomplished results. Cutting-edge technology experienced with us for reliability, security, flexibility and high availability.Experienced over a decade our team works our different industries. Reach us for solutions to your business of any nature and size.
Geothermal exploration using remote sensing techniquesSepideh Abadpour
On these slides, I have spoken about applications of remote sensing in geothermal exploration. Unfortunately I've done it when I was pursuing my bachelors, so the citations are not correct but it will give you some ideas.
Any feedback is welcome
Weather balloons are high-altitude meteorological balloons particularly used for carrying scientific payloads into the upper atmosphere. These data are obtained by using an instrument called as radiosonde which is attached to the helium filled weather balloon to measure the meteorological data as it ascends up into the atmosphere. For more than 100 years, weather balloons have given valuable information for climate and meteorological research. In this paper, the radiosonde module is designed with negligible risk of failure and cost effectiveness. The instruments to be fixed along with the weather balloon are logging camera, temperature sensor, pressure sensor, humidity sensor, global positioning system (GPS) module and a power source. This module is used to measure and log the basic weather parameters such as pressure, temperature, humidity and this also captures the picture of a particular locality with the help of a microcontroller. This proposed work is useful for observing high altitude weather data which is essential for predicting natural disasters. Further more, it is helpful to analyze the climatological and weather details of a particular region it also plays an important role in estimating agricultural models.
Examination of Total Precipitable Water using MODIS measurements and Comparis...inventionjournals
In this research, precipitable water vapor, as the most effective character in the production of biomass is estimated using remote sensing techniques. Total Precipitable Water (TPW) was estimated using measurements in the Near Infrared bands of the MODIS. To examine the level of confidence in TPW deriving, a simultaneous in situ measurement by Radiosonde and ground-based Global Positioning System (GPS) was carried out. The TPW as results in Radiosonde and GPS was accomplished using the relevant physical equations and base on wet delay troposphere, respectively. Results showed a high correlation among the values of TPW derived from MODIS banding ratio, Radiosonde and GPS data at the Mehrabad station. Also, Using the ratio of the apparent reflectance in the water vapor absorption band to reflectance in non-absorbing band, the atmospheric water vapor transparency was mapped, that the maps showed a high correlation between apparent reflectance and TPW MODIS as their statistical results showed an inverse negative relationship(R²= -0.97).
AERMOD Sensitivity to AERSURFACE Moisture Conditions and Temporal ResolutionBREEZE Software
This study reviews AERMOD-predicted concentrations for several hypothetical sources at
locations throughout the United States. An analysis of the sensitivity of the AERSURFACE.
Similar to Modelling of air temperature using ann and remote sensing (20)
Yapay sinir ağı ve noaaavhrr uydu verilerini kullanarak hava sıcaklığının tah...mehmet şahin
iklim değişikliği, çeşitli ısı ve radyasyon akılarının belirlenmesinde, buhar basınç açığı, su potansiyeli, kentsel arazi kullanımı
ve ısı adası, kısa dalga ve uzun dalga radyasyon, stoma direnci, ekoloji, hidroloji ve atmosfer bilimleri de dahil olmak üzere bir
çok uygulama için kullanılmaktadır. Ayrıca, hava sıcaklığı bilgisi insan sağlığı için gereklidir. Bu kadar önemli olan hava
sıcaklığı, meteorolojik istasyonlarda ölçülmektedir. Fakat istasyon dağılımları yeryüzünde yeterli düzeyde olmadığı gibi yeterli
sayıda istasyon da bulunmamaktadır. Bu nedenle, uydular kullanılmaya başlanmıştır. Literatürde yer yüzey sıcaklığı tahmini
yapmak için oldukça fazla algoritma geliştirilmesine rağmen doğrudan hava sıcaklığını tahmin eden algoritmalar yeterince
geliştirilememiştir. Bu nedenle bu çalışmada yapay sinir ağı kullanılarak hava sıcaklığı tahmini yapılmıştır. Yapay sinir ağda
ay, yükseklik, enlem, boylam, aylık ortalama yer yüzey sıcaklıkları girdi olarak kullanılırken, aylık ortalama hava sıcaklığı çıktı
olarak elde edilmiştir. Girdi parametrelerinden yer yüzey sıcaklığı, NOAA/AVHRR datalarından sağlanmıştır. Ağda öğrenme
algoritmaları olarak; tarinlm, trainscg, trainoss kullanılırken transfer fonksiyonu olarak tansig, logsig ve lineer kullanılmıştır.
Ocak 1995’den Aralık 2005’e kadar olarak zaman aralığı, çalışma periyodu olarak belirlenmiştir. Ağın eğitilmesi için 1995-
2004 yılları arası veriler kullanılırken, test verisi olarak 2005 yılı verileri kullanılmıştır. Tahmin sonuçlarının, gerçek datalarla
istatistiksel olarak değerlendirilmesi yapılmış olup hata değeri oldukça az çıkmıştır. El edilen en iyi modellemede, korelasyon
katsayısı ve kök ortalama kare hatası sırasıyla 0.996 ve 1.253 K olarak hesaplanmıştır.
Siirt ilinin yer yüzey sıcaklığının belirlenmesi için farklı split window alg...mehmet şahin
Land surface temperature is an important parameter to control the energy exchange between earth's surface and atmosphere.
In addition, land surface temperature is used in the development of computer modelling of many environmental quantity as
climate change, numerical weather prediction, global water cycle, drought index, solar radiation and frost. In this study,
visible and near infrared channels (channels 1 and 2) and thermal channels (channels 4 and 5) of NOAA / AVHRR satellite
images were used to obtain land surface temperature data. Price-1984, Becker and Li–1990 and Ulivieri et al.-1994 algorithms
were determined to calculate the land surface temperature. Results of land surface temperature obtained from satellite
algorithms were compared in terms of statistics based on the location of Siirt with the actual land surface temperatures
obtained from General Directorate of Meteorology. According to the results; Root Mean Square Error values of Price-1984,
Becker and Li-1990, and Ulivieri et al.-1994 algorithms were calculated as 3.308K, 2.681K and 2.171K, respectively. In the
same order, the correlation coefficients of algorithms were obtained as 0.972, 0974 and 0984. It has been reached to
conclude that using Ulivieri et al.-1994 algorithm is appropriate to estimate land surface temperature that has been obtained
from Ulivieri et al.-1994 algorithm for getting with the lowest error in satellite-based solar energy calculations.
Estimation of global solar radiation by using machine learning methodsmehmet şahin
In this study, global solar radiation (GSR) was estimated based on 53 locations by using ELM, SVR, KNN, LR and NU-SVR methods. Methods were trained with a two-year data set and accuracy of the mentioned methods was tested with a one-year data set. The data set of each year was consisting of 12 months. Whereas the values of month, altitude, latitude, longitude, vapour pressure deficit and land surface temperature were used as input for developing models, GSR was obtained as output. Values of vapour pressure deficit and land surface temperature were taken from radiometry of NOAA-AVHRR satellite. Estimated solar radiation data were compared with actual data that were obtained from meteorological stations. According to statistical results, most successful method was NU-SVR method. The RMSE and MBE values of NU-SVR method were found to be 1,4972 MJ/m2 and 0,2652 MJ/m2, respectively. R value was 0,9728. Furthermore, worst prediction method was LR. For other methods, RMSE values were changing between 1,7746 MJ/m2 and 2,4546 MJ/m2. It can be seen from the statistical results that ELM, SVR, k-NN and NU-SVR methods can be used for estimation of GSR.
Estimation of wind power density with artificial neural networkmehmet şahin
Industry and technology are rapidly developing with each passing day. They need energy to sustain this evolution. The demand of energy is mainly provided from fossil fuels. Unfortunately, this kind of energy reserves are consumed away day by day. Therefore, there is a need to use alternative energy sources to supply energy needs. Alternative energy sources can be listed as; solar, wind, wave, biomass, geothermal and hydro-electric power. Our country has significant potential for wind energy. Wind power density estimation is required to determine the wind potential. In this study, the wind power density was estimated by using artificial neural network (ANN) method. Forty meteorological stations were used for ANN training, while eighteen meteorological stations were used to test the trained network. Network has trained according to, respectively; trainlm, trainbfg, trainscg, traincgp traincgb, traincgf ve trainoss learning algorithms. The correlation coefficient (R) and Mean bias error (MBE) of the best developed model were calculated as 0,9767 and -0,3124 W/m2 respectively. Root Mean Square Error (RMSE) was calculated as 1,4786 W/m2. In conclusion, the obtained results demonstrate that the developed model can be used to estimate the wind power density.
Calculation of solar radiation by using regression methodsmehmet şahin
Abstract. In this study, solar radiation was estimated at 53 location over Turkey with
varying climatic conditions using the Linear, Ridge, Lasso, Smoother, Partial least, KNN
and Gaussian process regression methods. The data of 2002 and 2003 years were used to
obtain regression coefficients of relevant methods. The coefficients were obtained based on
the input parameters. Input parameters were month, altitude, latitude, longitude and landsurface
temperature (LST).The values for LST were obtained from the data of the National
Oceanic and Atmospheric Administration Advanced Very High Resolution Radiometer
(NOAA-AVHRR) satellite. Solar radiation was calculated using obtained coefficients in
regression methods for 2004 year. The results were compared statistically. The most
successful method was Gaussian process regression method. The most unsuccessful method
was lasso regression method. While means bias error (MBE) value of Gaussian process
regression method was 0,274 MJ/m2, root mean square error (RMSE) value of method was
calculated as 2,260 MJ/m2. The correlation coefficient of related method was calculated as
0,941. Statistical results are consistent with the literature. Used the Gaussian process
regression method is recommended for other studies.
Estimation of solar radiation by different machine learning methodsmehmet şahin
In this study, solar radiation was estimated depend on 34 locations. While doing distribution
of the locations on Turkey, they were taken into consideration to be different climatic
conditions. In the study, meteorological data was used between the years of 2007 and 2015. The
meteorological data which were used, were land surface temperature at 5 cm, air temperature,
sunshine duration and solar radiation. As geographical data, locations of latitude, longitude
and altitude were used. Three different methods were used for estimating the solar radiation.
These are the methods of multilayer perceptron neural network, multiple regression and radial
basis function network. The estimation results obtained from the methods were compared with
the actual values obtained from the meteorological station, statistically. The mean bias error
(MBE), root mean square error (RMSE) and correlation coefficient (R) were used as evaluation
criteria. According to statistical results, multilayer perceptron neural networks has given the
most successful result in the three methods. The MBE, RMSE and R values of method were
calculated as 1.5321 MJ/m2, 2.4295 MJ/m2, and 0.9428, respectively. It is recommended to
researchers to use multilayer perceptron neural networks method for studies in this area.
Determination of wind energy potential of campus area of siirt universitymehmet şahin
In this study, wind energy potential of Siirt
University campus area is statistically examined by using the mean hourly wind speed data between 2014
and 2015 years which are measured by Vantage Pro2 device, located at the roof of the Engineering Faculty building with 6 m altitude. Weibull distribution
function and Rayleigh distribution function are used
as statistical approach to evaluate the wind data. Weibull distribution function is examined by using two different methods that are maximum likelihood estimation and Rayleigh method. The determination
coefficient (R2) and Root Mean Square Error (RMSE) values of these methods are compared. According the error analysis, it is indicated that the Rayleigh method
gives better results. Wind speed and wind power density are calculated in pursuance of Weibull distribution parameters. The results are evaluated as
monthly and annually. Hence, this preliminary study is made to determine the wind energy potential of Siirt University campus area.
Forecasting long term global solar radiation with an ann algorithmmehmet şahin
and energy-efficient buildings, solar concentrators, photovoltaic-systems and a site-selection of sites for future
power plants). To establish long-term sustainability of solar energy, energy practitioners utilize versatile
predictive models of G as an indispensable decision-making tool. Notwithstanding this, sparsity of solar sites,
instrument maintenance, policy and fiscal issues constraint the availability of model input data that must be
used for forecasting the onsite value of G. To surmount these challenge, low-cost, readily-available satellite
products accessible over large spatial domains can provide viable alternatives. In this paper, the preciseness of
artificial neural network (ANN) for predictive modelling of G is evaluated for regional Queensland, which
employed Moderate Resolution Imaging Spectroradiometer (MODIS) land-surface temperature (LST) as an
effective predictor. To couple an ANN model with satellite-derived variable, the LST data over 2012–2014 are
acquired in seven groups, with three sites per group where the data for first two (2012–2013) are utilised for
model development and the third (2014) group for cross-validation. For monthly horizon, the ANN model is
optimized by trialing 55 neuronal architectures, while for seasonal forecasting, nine neuronal architectures are
trailed with time-lagged LST. ANN coupled with zero lagged LST utilised scaled conjugate gradient algorithm,
and while ANN with time-lagged LST utilised Levenberg-Marquardt algorithm. To ascertain conclusive results,
the objective model is evaluated via multiple linear regression (MLR) and autoregressive integrated moving
average (ARIMA) algorithms. Results showed that an ANN model outperformed MLR and ARIMA models
where an analysis yielded 39% of cumulative errors in smallest magnitude bracket, whereas MLR and ARIMA
produced 15% and 25%. Superiority of an ANN model was demonstrated by site-averaged (monthly) relative
error of 5.85% compared with 10.23% (MLR) and 9.60 (ARIMA) with Willmott's Index of 0.954 (ANN), 0.899
(MLR) and 0.848 (ARIMA). This work ascertains that an ANN model coupled with satellite-derived LST data
can be adopted as a qualified stratagem for the proliferation of solar energy applications in locations that have
an appropriate satellite footprint.
Forklift Classes Overview by Intella PartsIntella Parts
Discover the different forklift classes and their specific applications. Learn how to choose the right forklift for your needs to ensure safety, efficiency, and compliance in your operations.
For more technical information, visit our website https://intellaparts.com
Cosmetic shop management system project report.pdfKamal Acharya
Buying new cosmetic products is difficult. It can even be scary for those who have sensitive skin and are prone to skin trouble. The information needed to alleviate this problem is on the back of each product, but it's thought to interpret those ingredient lists unless you have a background in chemistry.
Instead of buying and hoping for the best, we can use data science to help us predict which products may be good fits for us. It includes various function programs to do the above mentioned tasks.
Data file handling has been effectively used in the program.
The automated cosmetic shop management system should deal with the automation of general workflow and administration process of the shop. The main processes of the system focus on customer's request where the system is able to search the most appropriate products and deliver it to the customers. It should help the employees to quickly identify the list of cosmetic product that have reached the minimum quantity and also keep a track of expired date for each cosmetic product. It should help the employees to find the rack number in which the product is placed.It is also Faster and more efficient way.
Automobile Management System Project Report.pdfKamal Acharya
The proposed project is developed to manage the automobile in the automobile dealer company. The main module in this project is login, automobile management, customer management, sales, complaints and reports. The first module is the login. The automobile showroom owner should login to the project for usage. The username and password are verified and if it is correct, next form opens. If the username and password are not correct, it shows the error message.
When a customer search for a automobile, if the automobile is available, they will be taken to a page that shows the details of the automobile including automobile name, automobile ID, quantity, price etc. “Automobile Management System” is useful for maintaining automobiles, customers effectively and hence helps for establishing good relation between customer and automobile organization. It contains various customized modules for effectively maintaining automobiles and stock information accurately and safely.
When the automobile is sold to the customer, stock will be reduced automatically. When a new purchase is made, stock will be increased automatically. While selecting automobiles for sale, the proposed software will automatically check for total number of available stock of that particular item, if the total stock of that particular item is less than 5, software will notify the user to purchase the particular item.
Also when the user tries to sale items which are not in stock, the system will prompt the user that the stock is not enough. Customers of this system can search for a automobile; can purchase a automobile easily by selecting fast. On the other hand the stock of automobiles can be maintained perfectly by the automobile shop manager overcoming the drawbacks of existing system.
Welcome to WIPAC Monthly the magazine brought to you by the LinkedIn Group Water Industry Process Automation & Control.
In this month's edition, along with this month's industry news to celebrate the 13 years since the group was created we have articles including
A case study of the used of Advanced Process Control at the Wastewater Treatment works at Lleida in Spain
A look back on an article on smart wastewater networks in order to see how the industry has measured up in the interim around the adoption of Digital Transformation in the Water Industry.
Event Management System Vb Net Project Report.pdfKamal Acharya
In present era, the scopes of information technology growing with a very fast .We do not see any are untouched from this industry. The scope of information technology has become wider includes: Business and industry. Household Business, Communication, Education, Entertainment, Science, Medicine, Engineering, Distance Learning, Weather Forecasting. Carrier Searching and so on.
My project named “Event Management System” is software that store and maintained all events coordinated in college. It also helpful to print related reports. My project will help to record the events coordinated by faculties with their Name, Event subject, date & details in an efficient & effective ways.
In my system we have to make a system by which a user can record all events coordinated by a particular faculty. In our proposed system some more featured are added which differs it from the existing system such as security.
TECHNICAL TRAINING MANUAL GENERAL FAMILIARIZATION COURSEDuvanRamosGarzon1
AIRCRAFT GENERAL
The Single Aisle is the most advanced family aircraft in service today, with fly-by-wire flight controls.
The A318, A319, A320 and A321 are twin-engine subsonic medium range aircraft.
The family offers a choice of engines
Vaccine management system project report documentation..pdfKamal Acharya
The Division of Vaccine and Immunization is facing increasing difficulty monitoring vaccines and other commodities distribution once they have been distributed from the national stores. With the introduction of new vaccines, more challenges have been anticipated with this additions posing serious threat to the already over strained vaccine supply chain system in Kenya.
Modelling of air temperature using ann and remote sensing
1. This article appeared in a journal published by Elsevier. The attached
copy is furnished to the author for internal non-commercial research
and education use, including for instruction at the authors institution
and sharing with colleagues.
Other uses, including reproduction and distribution, or selling or
licensing copies, or posting to personal, institutional or third party
websites are prohibited.
In most cases authors are permitted to post their version of the
article (e.g. in Word or Tex form) to their personal website or
institutional repository. Authors requiring further information
regarding Elsevier’s archiving and manuscript policies are
encouraged to visit:
http://www.elsevier.com/copyright
2. Author's personal copy
Modelling of air temperature using remote sensing and artificial
neural network in Turkey
Mehmet Sßahin ⇑
Engineering Faculty, Siirt University, 56100, Siirt, Turkey
Received 17 March 2012; received in revised form 14 June 2012; accepted 16 June 2012
Available online 26 June 2012
Abstract
The aim of this research was to forecast monthly mean air temperature based on remote sensing and artificial neural network (ANN)
data by using twenty cities over Turkey. ANN contained an input layer, hidden layer and an output layer. While city, month, altitude,
latitude, longitude, monthly mean land surface temperatures were chosen as inputs, and monthly mean air temperature was chosen as
output for network. Levenberg–Marquardt (LM) learning algorithms and tansig, logsig and linear transfer functions were used in the
network. The data of Turkish State Meteorological Service (TSMS) and Technological Research Council of Turkey–Bilten for the period
from 1995 to 2004 were chosen as training when the data of 2005 year were being used as test. Result of research was evaluated according
to statistical rules. The best linear correlation coefficient (R), and root mean squared error (RMSE) between the estimated and measured
values for monthly mean air temperature with ANN and remote sensing method were found to be 0.991–1.254 K, respectively.
Ó 2012 COSPAR. Published by Elsevier Ltd. All rights reserved.
Keywords: Air temperature; Artificial neural network; NOAA; AVHRR; Remote sensing; Satellite
1. Introduction
Air temperature is a measure of how hot or cold the air
is. It is the most commonly measured by weather parame-
ter. More specifically, air temperature describes the kinetic
energy or energy of motion of the gases that make up air. If
gas molecules move more quickly, air temperature
increases otherwise it decreases. The estimation of air tem-
perature is useful for lots of applications including study of
vector-borne diseases (Thomson et al., 1996; Goetz et al.,
2000), epidemic forecasting (Bian et al., 2006), weather
forecasting, veterinary uses, climate change (Kucharik
et al., 2010; Bocchiola and Diolaiuti, 2010; Kittel et al.,
2011), determination of various heat and radiation fluxes
(Brunsell et al., 2011), vapour pressure deficit, water poten-
tial (Aasamaa and So˜ber, 2011), urban land use and urban
heat island (Cheval et al., 2009), shortwave and longwave
radiation (Stanelle et al., 2010), stomatal resistance (Lee
et al., 2011), ecology (Myint et al., 2010; Smith, 2011; Hed-
ing et al., 2011), hydrology (Jain et al., 2011) and atmo-
spheric sciences. And also knowledge of air temperature
is necessary for the health of human being (Elwood et al.,
1993; Kunst et al., 1993; Ballester et al., 1997; Analitis
et al., 2008; Michelozzi et al., 2009; Almeida et al., 2010)
Generally, air temperature which is very important is the
frequently observed and recorded by weather meteorologi-
cal stations with high accuracy. But density of the station
network is normally not sufficient when air temperature
is employed in regional numerical models for climate or
evapotranspiration. So, a new method is necessary to get
air temperature over the wide fields by using satellites data.
The data of Advanced Very High Resolution Radiometer
(AVHRR), Geostationary Operational Environmental
Satellite (GOES), Meteosat, TIROS Operational Vertical
Sounder (TOVS), LANDSAT/TM and Moderate Resolu-
tion Imaging Spectroradiometer (MODIS) have been used
0273-1177/$36.00 Ó 2012 COSPAR. Published by Elsevier Ltd. All rights reserved.
http://dx.doi.org/10.1016/j.asr.2012.06.021
⇑ Tel.: +90 (484) 223 12 24; fax: +90 (484) 223 66 31.
E-mail addresses: msahin@siirt.edu.tr, sahanmehmet2000@yahoo.
com.
www.elsevier.com/locate/asr
Available online at www.sciencedirect.com
Advances in Space Research 50 (2012) 973–985
3. Author's personal copy
in historical term. The air temperatures have been
estimated from land surface temperatures retrieved from
satellite images with 1 km  1 km or 4 km  4 km resolu-
tion by using thermal infrared radiation emitted from the
surface by researchers. Generally, land surface temperature
has been retrieved from two thermal infrared bands (chan-
nels 4 and 5 of AVHRR of NOAA) located at 11 lm and
12 lm by using split-window equations. The split-window
algorithms are belonged to the difference in the brightness
temperatures of thermal infrared bands. Furthermore, land
surface temperature depends on the magnitude of the dif-
ference between the two grounds emissivity in the bands
(Becker, 1987).
In the literature, Kawamura and Edamatsu (1993) used
AVHRR thermal infrared data and estimated the air-tem-
perature (Ta) with an rms error 2.5–2.8 K. Prihodko and
Goward (1997) explored a methodology for estimating
air temperature directly from remotely sensed observations
using the correlation between a spectral vegetation index
and surface temperature (temperature-vegetation index).
These air temperature estimates were compared with coin-
cident ground-measured air temperatures recorded at stan-
dard meteorological stations. A strong correlation
(R = 0.93) was found between the satellite estimates and
measured air temperatures with a mean error of 2.92 K.
The correlation between surface temperature and spectral
vegetation index has been obtained to estimate air temper-
ature from satellite images that was called the Surface Tem-
perature/Spectral Vegetation Index (TVX) by Czajkowski
et al. (1997), Prihodko and Goward (1997). The TVX con-
cept and the empirical method have provided estimated air
temperatures with an rms error of 3 K (Cresswell et al.,
1999). Lakshmi et al. (2001) evaluated the ability of satel-
lites to map air temperature over the large land surface
areas. Then, they developed an algorithm that derives sur-
face air temperature by using observations from the TOVS
suite of instruments and also from the AVHRR. The result
of their study showed that the average bias over the 3-
months period compared with ground-based observations
was approximately 2 K or less for the three times of day
with TOVS having lower biases than AVHRR. Riddering
and Queen (2006) presented a technique for producing esti-
mates of near surface air temperature in complex terrain
based on composite data from the NOAA-AVHRR.
Results were tested against meteorological data. The corre-
lation coefficient approximately 0.742 and standard errors
of the estimate of 2.73 K were observed in the final model
implementation. Stisen et al.(2007) obtained air tempera-
ture belonging to a model that was including satellite data
with high temporal resolution that were desired for several
modelling applications by exploiting the thermal split-win-
dow channels in combination with the red and near infra-
red channels of the geostationary MSG SEVIRI sensor.
The research results showed that accuracy of estimation
of the air temperature was changing from 2.55 K to
2.99 K by root mean squared error. Vancutsem et al.
(2010) studied to explore the possibility of retrieving
high-resolution near surface air temperature (Ta) data from
the MODIS connected to land surface temperature
(LST) over different ecosystems in Africa. The comparisons
between night MODIS-LST data with minimum Ta
showed that MODIS night-time products have
provided a good estimation of minimum Ta (standard
deviation = 2.4 K).
The other way of estimation air temperature is ANN
which has been used for various purposes in remote sens-
ing. Jang et al. (2004) employed multilayer feed-forward
neural networks to estimate air temperatures in Southern
Quebec (Canada) using AVHRR images. The input vari-
ables for the networks were the five bands of the AVHRR
image, surface altitude, solar zenith angle, and Julian day.
The estimation was carried out using a dataset collected
during the growing season from June to September 2000.
Levenberg–Marquardt back-propagation (LM-BP) was
used to train the networks. The early stopping method
was applied to improve the LM-BP and to generalize the
networks. The network using all five bands, Julian day,
altitude, and solar zenith angle provided the best results,
with 22 nodes in the hidden layer. The difference between
estimated and station air temperatures was obtained within
1.79 K by RMSE.
In this study, ANN was applied to estimate air temper-
atures of Adana, Afyonkarahisar, Ankara, Antalya, Art-
vin, Balıkesir, Denizli, Erzurum, Eskisßehir, _Istanbul-
Go¨ztepe, _Izmir, Kars, Kayseri, Konya, Malatya, Rize,
Samsun, Sivas, Sßanlıurfa and Van cities. For this purpose,
raw data of NOAA-AVHRR were converted into Level 1B
data set by using “Quorum to Level1B” software. Then all
data sets were corrected radiometrically, geometrically and
atmospherically and used these data sets to get brightness
temperatures of band 4 and band 5 of NOAA-AVHRR
images. In continuance, brightness temperatures were
employed to estimate land surface temperature. The city,
month, altitude, latitude, longitude, monthly mean land
surface temperature were chosen as input data while
monthly mean air temperature was chosen as output data
in artificial neural network. The LM learning algorithms
and tansig, logsig and linear transfer functions were used
in the network. Results of the network have indicated that
monthly mean air temperature can be estimated correctly
in Turkey by using ANN which is including meteorological
and satellite data. At the same time, the study showed that
the model M8/6-14-1 which developed over Turkey has
provided more accurate outcomes than other studies in
the literature.
2. Study areas and their characteristics, data sources
In the study, cities of Adana, Afyonkarahisar, Ankara,
Antalya, Artvin, Balıkesir, Denizli, Erzurum, Eskisßehir,
_Istanbul-Go¨ztepe, _Izmir, Kars, Kayseri, Konya, Malatya,
Rize, Samsun, Sivas, Sßanlıurfa and Van were chosen as
study areas (see Fig. 1 and see Table 1). The mentioned cit-
ies have various climatic conditions from one another. The
974 M. Sßahin / Advances in Space Research 50 (2012) 973–985
4. Author's personal copy
climate of Adana, Antalya carries the properties of
Mediterranean climate; too hot and arid in summers while
warm and rainy in winters. The highlands have a mixed
property of Mediterranean climate and continental climate.
Precipitation is generally in the form of rainfall. The 29%
of the city lands is covered with forests. The forests are
on the highlands. The flora is composed of Mediterranean
plants; with scrubs up to 700–800 m altitude on mountain
slopes while with larches and cedars on the uplands.
Ankara, Eskisßehir, Kayseri, Konya, Sivas have terres-
trial climate that is the most pluvial season in spring. The
climate conditions and topographic structure have enabled
the growth of two plant associations around cities; steppe
and forest. The most prevalent plant association in the
regions is steppe. The steppe is common on plateaus and
in valleys where drop little precipitation. There is almost
no tree in that plant association. For the most part, thorny
bushes are seen. In addition, angustifolia, willow, and
populous trees in rows all along the stream are in steppe
climate.
Since Balıkesir and _Istanbul-Go¨ztepe are under the
impact of Marmara, Mediterranean and terrestrial climate,
a plant association at a quarter of the cities is not seen in
other part of the region. The 30% of the surface is sylvan
whereas 32% of the city lands is pasture area, and more,
23% arable lands; 15% olive groves, orchards, and vegeta-
ble gardens.
Mediterranean climate is dominant in Denizli and _Izmir
whereas Afyonkarahisar has terrestrial climate; hot and
arid in summers while rainy and warm in winters. The hot-
test months are July and August while the coldest months
are January and February. There is almost no snowfall.
Nearly 50% of the city land is scrub and sylvan while
33% planted area, and 15% pasture area.
The climate of Artvin, Rize and Samsun has variations
at coastal lines and inlands. Though there is a dominant
Mediterranean climate at coastal lines, due to mountains,
the inlands are under the influence of terrestrial climate.
Although it is not too hot in summers, the rate of humidity
is rather high on account of dam reservoirs as well as sea-
water evaporation. The winter months are slightly cold and
fairly rainy. The precipitation is mostly rainfall at coastal
areas while the inlands experience more snowy days, and
under the effect of continental climate. The land surface
is encased in plains, orchards, gardens, pasture areas and
planted fields. The mountains are brimming with forests.
Terrestrial climate dominates in Malatya and Sßanlıurfa.
Summers are long lasting and hot while winters are very
cold. Temperature difference between night and day is
high. The 60% of the city lands is planted while 38% is pas-
ture area. Field of forest and scrub is rare; 0.6%. The city
lands are in the form of steppe.
Erzurum is one of the highest and coldest cities of Tur-
key. Harsh continental climate rules over the city. The win-
ters are very cold whereas very hot and arid in summers.
Visual appearance of the city is green in springs, white in
winters, yellow (steppe) in falls and summers. The area
with forest and scrub covers 9%. Scotch pine and oak
Fig. 1. Air temperature measuring stations in Turkey.
Table 1
Geographical parameters for the stations.
Stations Latitude (°N) Longitude (°E) Altitude (m)
Adana 37.03 35.21 27
Afyonkarahisar 38.44 30.33 1035
Ankara 39.57 32.53 891
Antalya 36.42 30.44 64
Artvin 41.11 41.49 628
Balıkesir 40.06 27.39 37
Denizli 37.47 29.05 425.29
Erzurum 39.57 41.4 1758.18
Eskisßehir 39.45 30.33 805
_Istanbul-Go¨ztepe 40.58 29.05 32.98
_Izmir 38.23 27.04 28.55
Kars 40.37 43.06 1775
Kayseri 38.43 35.29 1092
Konya 37.52 32.28 1030
Malatya 38.21 38.13 947.87
Rize 41.02 40.30 8
Samsun 41.21 36.15 4
Sivas 39.45 37.01 1285
Sßanlıurfa 37.09 38.47 547.18
Van 38.28 43.21 1670.58
M. Sßahin / Advances in Space Research 50 (2012) 973–985 975
5. Author's personal copy
consist of the area at 1900–2000 m altitude. Pasture area
takes place 68% of the city land while 18% planted area.
Kars and Van are another cities dominating terrestrial
climate. The winters are harsh and long lasting. The Lake
Van provides less harsh winter conditions on very high
zones of Van. The summers are slightly rainy and very
hot. Even if myriad plantation associations are seen around
Van and Kars; plains, the mountains are generally treeless.
The 70% of the city lands is pasture area while 23% is
planted and 2% is covered with forest and scrub (http://
www.cografya.gen.tr/).
As known, air temperature is measured 2 m above from
the ground as World Meteorological Organization has
determined and made it a guideline. In the study; altitude,
latitude, longitude and air temperature data were taken
from TSMS for the period from 1995 to 2005 while satellite
data were obtained from Scientific and Technological
Research Council of Turkey-Bilten, simultaneously.
3. Methodology
3.1. Split-window method
To retrieve LST from the AVHRR top-of-atmosphere
brightness temperature measurements, it was chosen as
split window algorithm. This approach is mainly based
on adjacent thermal channels of satellite and an empirical
inverse model, and it is derived from a first order expansion
of the Taylor series applied to the Planck function. In the
case of the AVHRR sensors, channels 4 and 5 are used.
The algorithm assumes that atmospheric attenuation (due
mostly to atmospheric water vapour) is greater in channel
5 than in channel 4, and the difference in measured radi-
ance between the two channels increases with increasing
water vapour (Pinheiro et al., 2006).
Firstly raw data of NOAA12-14-15/AVHRR which had
no cloud, were translated into Level-1B format by using
Quorum Software and in second step, brightness tempera-
ture of channel-4 and channel-5 (range 10.3–11.3 lm and
range11.5–12.5 lm, respectively) were obtained from
Level-1B data by making use of Envi 4.3 image-processing
programmer. Then, radiometric and geometric calibrations
were applied to the images to correct the deficiencies and
flaws in the imaging sensors of the satellite. The images
were then turned into brightness temperatures which are
necessary for the retrieval of LST from AVHRR data.
In this study, split window LST algorithm developed by
Ulivieri et al. (1994) was used due to its simplicity, robust-
ness and superior performance in independent tests (Becker
and Li, 1995; Vazquez et al., 1997; Yu et al., 2008).
Ulivieri’s algorithm can be written as,
T ¼ T4 þ 1:8ðT 4 À T 5Þ þ 48ð1 À eÞ À 75De ð1Þ
e ¼
e4 þ e5
2
ð2Þ
De ¼ e4 À e5 ð3Þ
where T4 and T5 are the brightness temperatures of
AVHRR channels 4 and 5 respectively, and, Eq. (1) was
developed for cases of column atmospheric water vapour
less than 3.0 g/cm2
, a reasonable condition for much of
the semi-arid portions of continental Africa (Pinheiro
et al. 2006). e and De are mean spectral emission coefficient
and difference of the emission coefficients for channels 4
and 5, respectively.e4 and e5 are the surface emission coef-
ficients which were estimated from atmospherically cor-
rected NDVI (Normalized Difference Vegetation Index),
using the equations given by Valor and Casselles (1995)
for channel 4 and channel 5, respectively .
e4 ¼ 0:9897 þ 0:029 lnðNDVIÞ ð4Þ
e4 À e5 ¼ 0:01019 þ 0:01344 lnðNDVIÞ ð5Þ
where NDVI is a simple graphical indicator that can be
used to analyse remote sensing measurements and assess
whether the target being observed contains live green veg-
etation or not. Live green plants absorb solar radiation
in the photosynthetically active radiation spectral region,
which they use as a source of energy in the process of pho-
tosynthesis. Leaf cells have also evolved to scatter (i.e., re-
flect and transmit) solar radiation in the near-infrared
spectral region (which carries approximately half of the to-
tal incoming solar energy) because the energy level per pho-
ton in that domain (wavelengths longer than about
700 nm) is not sufficient to be useful to synthesize organic
molecules. A strong absorption at these wavelengths would
only result in over-heating the plant and possibly damaging
the tissues. Hence, live green plants appear relatively dark
in the photosynthetically active radiation and relatively
bright in the near-infrared (Gates, 1980). By contrast,
clouds and snow tend to be rather bright in the red (as well
as other visible wavelengths) and quite dark in the near-
infrared. The pigment in plant leaves, chlorophyll, strongly
absorbs visible light (from 0.4 to 0.7 lm) for use in photo-
synthesis. The cell structure of the leaves, on the other
hand, strongly reflects near-infrared light (from 0.7 to
1.1 lm). The more leaves a plant has, the more these wave-
lengths of light are affected. Since early instruments of
earth observation, such as NOAA’s AVHRR, acquired
data in visible and near-infrared, it was natural to exploit
the strong differences in plant reflectance to determine their
spatial distribution in this satellite images. The NDVI is
calculated from these individual measurements as follows:
NDVI ¼
NIR À VIS
NIR þ VIS
ð6Þ
where VIS and NIR stand for the spectral reflectance mea-
surements acquired in the visible (red) and near-infrared re-
gions, respectively (Goward et al., 1991; Santos and Negri,
1997).
3.2. Artificial neural network
ANN is a branch of artificial intelligence which was
developed in 1950s in order to imitate the biological
976 M. Sßahin / Advances in Space Research 50 (2012) 973–985
6. Author's personal copy
structure of the human brain (Viotti et al., 2002). The
ANN models work like a black box without requiring the
detailed information of a system. Instead of requiring this
information, they learn the relation between the input
parameters and the controlled and uncontrolled variables
by studying the previously recorded data like non-linear
regression. One more advantage of using ANN is the capa-
bility of managing large and complex systems with a vast
number of interrelated parameters. On the other hand they
don’t take into account the excess data which is very
important (Kalogirou, 2001).
The use of the ANNs for modelling and prediction pur-
poses is increasingly becoming popular in the last decades
(C¸ am et al., 2005). Researchers have been applying the
ANN method successfully in various fields of mathematics,
engineering, medicine, economics, meteorology, psychol-
ogy, neurology, as well as in the prediction of mineral
exploration sites, in electrical and thermal load predictions,
in adaptive and robotic control, and many other subjects.
ANNs have been trained to overcome the limitations of
the conventional approaches to solve complex problems.
This method learns from given examples by constructing
an input-output mapping in order to perform predictions
(Kalogirou, 2000). Fundamentals processing element of a
neural network is a neuron. Each neuron computes a
weighted sum of its input signals.
The neuronal model of Fig. 2 includes an externally
applied bias, denoted by bk. The bias bk has the effect of
increasing or lowering the net input of the activation func-
tions, depending on whether it is positive or negative,
respectively.
In mathematical terms, a neuron k may be described by
writing the following pair of equations:
uk ¼
Xm
j¼1
wkjxj ð7Þ
yk ¼ uðuk þ bkÞ ð8Þ
where x1,x2, . . .,xm are the inputs signals; wk1, wk2, . . ., wkm
are the synaptic weights of neuron k; uk is the linear com-
biner output due to the input signals; bk is the bias; /(Á) is
the activation function and yk is the output signal of the
neuron. The use of bias bk has the effect of applying an
affine transformation to the output uk of the linear com-
biner in the model of Fig. 2, as shown by
vk ¼ uk þ bk ð9Þ
In particular, depending on whether the bias bk is posi-
tive or negative, the relationship between the induced local
field or activation potential vk of neuron k and the linear
combiner output uk is modified in the manner illustrated
in Fig. 3; hereafter the term “induced local field” is used.
Note that as a result of this affine transformation, the
graph of vk versus uk no longer passes through the origin.
The bias bk is an external parameter of artificial neuron
k. It may be accounted for its presence as in Eq. (8). Equiv-
alently, the combination of Eqs. (7) and (8) may be formu-
lated as follows, respectively (Haykin, 1999):
vk ¼
Xm
j¼0
wkjxj ð10Þ
yk ¼ uðvkÞ ð11Þ
The tangent sigmoid transfer function Eq. (12), log-sig-
moid transfer function Eq. (13) and linear transfer function
Eq. (14) are described with the following equation respec-
tively (Vogl et al.,1988).
uðxÞ ¼
2
1 þ eÀ2x
ð12Þ
uðxÞ ¼
1
1 þ eÀx
ð13Þ
uðxÞ ¼ linearðxÞ ¼ x ð14Þ
An ANN is organized as layers of neurons. Each neuron
in a layer is connected to all neurons in the previous layer.
An example of this type of arrangement, which is used also
in this study, is shown in Fig. 4. The network consists of an
input layer, one hidden layer and an output layer.
When Fig. 4 examined, it can be seen that the parame-
ters of city, month, altitude, latitude, longitude, and
monthly mean land surface temperatures in the input layer
x1
x2
xn
∑
wk1
wk2
wkn
Synaptic
weights
Inputs
yk
Activation
function
Summing
junction
Output
(.)ϕ
Bias
bk
vk
.
.
.
.
.
.
Fig. 2. Nonlinear model of a neuron.
Linear conbiner’s
output, uk
Induced local
field, vk
0
Bias bk>0
bk=0
bk<0
Fig. 3. Affine transformation produced by the presence of a bias; note that
vk = bk at uk = 0.
M. Sßahin / Advances in Space Research 50 (2012) 973–985 977
7. Author's personal copy
were employed to able to get monthly air temperature in
the output layer. Even if the values of land surface
temperature and air temperatures differ from one another,
both are always in the case of thermal interaction. The land
surface that is heated by solar radiation warms up the air;
heat lost to the air causes land surface temperature dimin-
ishing. So, ANN is an indispensable parameter in estima-
tion of air temperature. Further, because atmosphere is
heated by the radiations reflected from the earth ground,
lower atmosphere is hot while upper atmosphere is cold.
There is a progressive cooling of 1 °C for every 200 m rose
in the atmosphere. So, the altitude where the point of air
temperature estimation exists is crucial.
The angle at which solar radiation strikes the land sur-
face is the most important factor that affects temperature
pattern on the earth. The more the angle of solar radiation
increases the direction at a right angle, the more the point
where it strikes gets warmer. As the strike angle contracts,
the heating lessens. As known, the angle of incoming solar
radiation changes with latitude. The sun shines straight
down like near the equator whereas inclined around the
poles. The temperature diminishes when moved from the
equator towards the poles. That law put forwards that lat-
itude is salient in calculating air temperature. Moreover,
the hitting angle of solar radiation shifts throughout the
year depending on axial tilt and earth annual move. That
increases the importance of temporal resolution in estima-
tion of air temperature accurately. In the study, monthly
temporal resolution followed and month was used as one
of the input parameters.
The longitude is an angular measurement of any point
from starting meridian. The only impact of longitude is
the building local time differences. As known, each pixel
in the satellite image represents for a different point. Tem-
perature values scattered from thousands of different
points reach to satellite sensors depending on different
angles. The angles were linked with longitude angles, so
longitude was employed as input parameter in the study.
The other input parameter in the study is city. In sunny
and hot days, cities, in which tall buildings exist and which
are densely populated, is hotter when compared to their
surroundings because of urban heat island (UHI) effect.
UHI effects come into existence in cities, and the tempera-
ture values in these kinds of cities are higher because they
spread more heating energy. UHI effect changes from city
to city. In the study UHI effect is stated as city.
3.3. Evaluation of the estimation results
The choice of the relevant criteria allowing performance
evaluation of the estimation methods is an important issue.
Various statistical parameters can be used to measure the
strength of the statistical relationship between the esti-
mated values and the reference values. I assume that vi,
(i = 1, n) is the set of n reference values and ei, (i = 1, n)
is the set of the estimates. v and e are mean of reference
and estimates values respectively. The bias, R and RMSE
can be calculated by using standard deviations of reference
(rv) and estimate (re) values, mean of reference and esti-
mates values, estimated values and the reference values.
The bias which is the difference between the mean estimate
e and the mean reference value v. The statistical criteria for-
mula of the linear correlation coefficient R is the following,
R ¼
Pn
i¼1ðvi À vÞðei À eÞ
nrvre
ð15Þ
where R measures the proximity between estimate and ref-
erence. It is not sensitive to a bias (Kendall and Stuart,
1963). The formula of the RMSE is;
RMSE ¼
1
n
Xn
i¼1
ðei À viÞ
2
#1
2
ð16Þ
In statistics, RMSE is a frequently used measure of the
differences between values predicted by a model or an esti-
mator and the values actually observed from the thing
being modelled or estimated (Laurent et al., 1998).
4. Results and discussions
4.1. Estimation of land surface temperature
First, with the help of Quorum software, the data of
NOAA 12-14-15/AVHRR was converted to Level-1B for-
mat which image processing software can recognize easily.
Then, radiometric and geometric arrangements of the
images were done through Envi 4.3 and Idrisi Andes image
processing software. The primary factor that is crucial in
calculating land surface temperature is brightness tempera-
ture values. The brightness temperatures of the images for
4th and 5th channels were obtained also through Envi 4.3
and Idrisi Andes image processing software. Another fac-
tor that is necessary in calculating land surface temperature
is NDVI values. To acquire the stated values; 1(VIS). and
2(NIR). channels of NOAA 12-14-15/AVHRR and Eq.
(6) were used, and their NDVI images were obtained.
ln(NDVI) function should be used to calculate the values
of e4 and e5 in Eq. (4) and Eq. (5). The values in the range
of À1 and 0 will lead mathematically to trouble for
Altitude
Latitude
Longtitude
Months
Montly mean
LST temperature
Monthly mean
air temperature
City
Input layer Hidden layer Output layer
Fig. 4. The ANN model used in the study.
978 M. Sßahin / Advances in Space Research 50 (2012) 973–985
8. Author's personal copy
ln(NDVI) function. To overcome the trouble, the stated
ranges were deactivated in the images. The last form of
NDVI images were employed in Eq. (4) and (5), hence,
emissivity values of 4th
and 5th
channels were acquired.
By adding pre-calculated e4 and e5 values to the formulas
of De = (e4 À e5) and e = (e4 + e5)/2, respectively the emis-
sivity difference and mean of emissivity of 4th and 5th
channels were obtained.
In Eq. (1) land surface temperature maps were acquired
based on Ulivieri et al. (1994) algorithm via the use of
brightness temperature of 4th (T4) and 5th (T5) channels,
De, e. In Fig. 5, land surface temperature map was shown
as based on Ulivieri et al. (1994) algorithm at 06.56 a.m
local time on 10th June 2002.
Having an overall examination over the map, it is seen
that land surface temperature on coastal lines of Black
Sea Region in north of Turkey, is in the range of
293–302 K whereas in internal parts of Black Sea Region
and in Eastern Regions it is within the range of
281À299 K. The temperature in Eastern Region varies,
even if just a bit, between 299 and 308 K. Furthermore, it
is taken in from the map that the coastal lines of Aegean
and Mediterranean Regions, the majority of Central Ana-
tolia Region and inlands of Mediterranean Region take
temperature range of 296–305 K. Still, it can overtly be
viewed in the map that the temperature range in South-
eastern Region is mostly amongst 308–319 K. The temper-
ature range in most locations of the Thrace region i.e.
North-western is between 296 K and 299 K. And also,
the change of temperature is seen between 278 K and
287 K in cloud-covered areas. Furthermore, it is under-
stood from the map that land surface temperatures of
South and West regions of Turkey are more than North’s
and East’s regions.
At certain parts of Turkey’s neighbouring countries Iraq
and Syria, the temperature map has taken the black colour.
Because the stated countries have quite a weak vegetation
cover and desert climate, the algorithm developed on the
Fig. 5. Land surface temperature map based on Ulivieri et al. (1994) algorithm at 06.56 a.m local time on 10th June 2002 (K).
y = 0.9991x
R = 0.979
RMSE=1.778K
N=3055
240
250
260
270
280
290
300
310
320
330
255 265 275 285 295 305 315
Meteorological value(K)
Satellitevalue(K)
Fig. 6. The comparison of LST values obtained through Ulivieri et al. (1994) algorithm with meteorological values.
M. Sßahin / Advances in Space Research 50 (2012) 973–985 979
9. Author's personal copy
basis of the emissivity of vegetation was not able to have
had measurements with sufficient precision. But, because
there is enough vegetation cover in the study areas, the
temperature measure developed based on vegetation index
algorithm, does not bear any hinder for the study.
Similarly, the total 147 LST satellite images were derived
providing at least one image in each month with the same
method on the basis of algorithm developed by Ulivieri
et al.(1994), between 1995 and 2005 years. Land surface
temperature values were obtained from over the derived
images by using coordination of 20 cities specified in Table
1. By using Eqs. (15), (16), 3055 land surface temperature
values obtained through satellite, were compared with the
ones of TSMS values. At the end of the comparison, R
and RMSE were found to be 0.979 and 1.778 K, respec-
tively (see Fig. 6).
Land surface temperature in various points of the world
was calculated via satellite data. On examining the studies
in the literature, it was seen that rms error range in all stud-
ies occurred between 1 K and 3 K (Price, 1984; Becker and
Li, 1990; Vidal, 1991; Sobrino et al., 1996; Coll et al., 1994;
Ouaidrari et al., 2002; Pinheiro et al., 2006; Katsiabani
et al., 2009; Sßahin and Kandırmaz, 2010). Because the
RMSE value in the study was found as 1.778 K, the study
is in tune with the literature. So, there is no inconvenience
to use the algorithm developed by Ulivieri et al. (1994) to
acquire LST values based on NOAA/AVHRR data in Tur-
key. More, it is suggested researchers to use the stated algo-
rithm in theirs studies.
4.2. Estimation of air temperature
In this study, ANN was employed to calculate monthly
mean air temperature. The network used in the study is
composed of input layer, hidden layer and one output
layer. While month, altitude, latitude, longitude, city and
monthly mean land surface temperature were used as
input, monthly mean air temperature was acquired from
the output layer. Whereas the data from the period of
1995–2004 were used for the training of the network, the
data of 2005 were used to test the accuracy of the trained
network.
There is not a mathematical formula to determine the
number of neuron in hidden layer of ANN. The number
of neuron in hidden layer is decided in the result of net-
work training. Neurons between 1 and 50 in the hidden
layer were tested to determine the optimum artificial net-
work model employed in the study. In the meantime,
because the starting weights of ANNs were composed
randomly, the appropriate ANN model was decided after
the trails.
As consequence of the trails, the values of transfer func-
tions, correlation coefficients and root mean squared error
of models which were used in hidden and output layers of
the most accurate fourteen networks were calculated (see
Table 2).
High correlation coefficient and small RMSE value is a
statistical rule in the model which was developed to use in
comparison of coefficient values of calculated correlation
coefficient and error mean square. After having examined
Table 2 and when air temperature estimation results were
compared to statistical criteria, it was seen that the opti-
mum ANNs are 6-14-1 and 6-24-1 models which are called
M8 and M9. The transfer function in the hidden layer of
the model 6-14-1 is tansig whereas linear in output layer.
In addition, 6 neurons exist in the input layer while 14 in
the hidden layer, and 1 in the output layer. Similarly, the
transfer function in the hidden layer of the model 6-24-1,
called as M9, is tansig whereas it is linear in the output
layer. The 6 neurons exist in the input layer of the Model
M9 while 24 in the hidden layer, and 1 in the output layer.
Correlation coefficients of M8 and M9 models were found
equal to one another; 0.991. That means input variables in
ANN got a success up to 99.1% in estimating monthly
mean air temperature. But the values of RMSE are differ-
ent from one another. Whereas the RMSE value of M8 is
Table 2
The R and RMSE statistics of different ANN models.
Name Model Transfer
function
hidden
Transfer
function
output
R RMSE (K)
M1 6-05-1 Logsig Logsig 0.990 1.368
M2 6-25-1 Logsig Logsig 0.989 1.471
M3 6-25-1 Logsig Linear 0.987 1.562
M4 6-44-1 Logsig Linear 0.968 2.403
M5 6-24-1 Logsig Tansig 0.987 1.562
M6 6-44-1 Logsig Tansig 0.988 1.517
M7 6-50-1 Logsig Tansig 0.989 1.433
M8 6-14-1 Tansig Linear 0.991 1.254
M9 6-24-1 Tansig Linear 0.991 1.263
M10 6-44-1 Tansig Linear 0.990 1.373
M11 6-14-1 Tansig Tansig 0.989 1.430
M12 6-05-1 Tansig Tansig 0.991 1.268
M13 6-16-1 Tansig Logsig 0.989 1.399
M14 6-34-1 Tansig Logsig 0.976 2.118
980 M. Sßahin / Advances in Space Research 50 (2012) 973–985
10. Author's personal copy
1.254 K, it is 1.263 K with M9. In that case, the model M8
is the most accurate one developed in the study. More, by
using the model M8, city based correlation coefficient and
RMSE values were calculated (see Table 3). Along with
having rather high values on city based correlation coeffi-
cient in the range of 0.966–0.997, the highest value belongs
to Adana. On the other hand, the smallest value is of Kay-
seri. Its RMSE values are between 0.705 K and 2.600 K. In
estimation study of monthly mean air temperature, with
0.705 K, the smallest error was of Afyonkarahisar while
the highest is of Kayseri; 2.600 K. When the study is com-
pared to the other studies in the literature, it is seen that the
error ranges of the studies in the literature, for monthly
mean air temperature, fluctuate between 1.79 K and 3 K
(Kawamura and Edamatsu, 1993; Prihodko and Goward,
1997; Czajkowski et al., 1997; Cresswell et al., 1999;
Lakshmi et al., 2001; Jang et al., 2004; Riddering and
Queen, 2006; Stisen et al., 2007; Vancutsem et al., 2010)
whereas it is 0.705 K and 2.600 K in this study. The study
is accordant with the literature. Even, the general outcomes
of the study is more accurate than the ones in the literature
(R = 0.991; RMSE = 1.254 K).
Moreover in the study, estimated monthly mean air tem-
perature values and city based graphical figures of monthly
meteorological values were formed (see Fig. 7).
When Fig. 7 examined, it can be seen that ANN and
meteorological values which were estimated monthly in
Adana are rather close to one another. A difference
occurred between meteorological and ANN values in
September and November, but through the calculations
made, it was understood that the difference was not as
much as thought. Whereas the error between both values
in September was 1.629 K, it was 1.002 K in November.
In other months, the errors were in the range of
0.020–0.671 K. When the figure examined, it will be seen
that the errors in Ankara were quite high in February
and December. In consequence of a statistical study, it
was emerged that an error of 1.418 K was made in the
study carried in January for Ankara. The error reached
up to 5.825 K in February while 4.020 K in December.
Similarly, the errors got values between 0.005–0.995 K in
other months. It is understood from the graphic on the fig-
ure that the error in August in Balıkesir was higher than
other months. As a result of calculations, it was seen that
errors of 1.264 K in May and 2.338 K in August were
made. In other months the error range got a value between
0.180–0.871 K. When the figure examined for _Izmir, it can
be seen that the amount of error in August is more than
other months. In consequence of a statistical study, it
was emerged that the error in August was found as
2.903 K while in other months between 0.106 and
0.965 K. As can be seen from the figure, the amount of
error in Samsun was high in February, October and
December; 1.514 K in February, 1.729 K in October and
2.231 K in December. In other months, the error values
were in the range of 0.013–0.913 K. It was seen that the
error value for Sßanlıurfa was rather high in June whereas
low in October and December. The error was found as
3.990 K in June while 1.216 K in October, and 1.012 K in
December. The error range acquired in other months was
between 0.022 K and 0.848 K. It can be understood from
the figure that the amount of error in Van was rather high
in January, February, November, and December. The
error ranges were 3.303 K in January; 2.275 K in February;
1.533 K in November; and 1.122 K in December while
between 0.226 and 0.665 K in other months.
Generally describing, it is understood that the cities of
Afyonkarahisar, Antalya, Artvin, Erzurum, Eskisßehir,
Kars, and Sivas have rather close meteorological and
monthly air temperature values with one another. Error
ranges of the cities resulted in below 1.000 K. It can be
understood from the figure that error values of Denizli
increased in May and September. The error value found
2.100 K in May while 1.400 K in September. The error
value in _Istanbul-Go¨ztepe found between 1.200–1.800 K
in May, June, September, October, November, and
December whereas the value stayed under 1.000 K in other
months. In Kayseri, although meteorological and esti-
mated values happened fairly close, the error values were
in the range of 1.200–8.800 K in the months of June and
July, respectively. The error value of Konya fluctuated
between 1.300 and 3.500K in January, February, July,
August, and November whereas the value stayed under
1.000 K in the other months. Although the error values
got values below 1 K in Malatya in March, October,
November, and December, the error values in other
months were between 1.000 and 2.400 K. The error value
of 0.200–0.900 K prevailed in March, April, November,
Table 3
The correlation coefficient and RMSE values of cities for monthly mean
air temperature.
Stations Correlation
coefficient (R)
RMSE (K)
Adana 0.997 0.767
Afyonkarahisar 0.995 0.705
Ankara 0.983 2.142
Antalya 0.993 0.904
Artvin 0.995 0.779
Balıkesir 0.994 0.991
Denizli 0.990 1.060
Erzurum 0.996 0.961
Eskisßehir 0.995 0.826
_Istanbul-Go¨ztepe 0.991 1.134
Izmir 0.992 0.993
Kars 0.996 0.733
Kayseri 0.966 2.600
Konya 0.992 1.520
Malatya 0.995 1.477
Rize 0.990 1.189
Samsun 0.990 0.987
Sivas 0.994 0.880
Sßanlıurfa 0.993 1.309
Van 0.991 1.343
M. Sßahin / Advances in Space Research 50 (2012) 973–985 981
11. Author's personal copy
and December in the city of Rize while the values changed
from 1.000 to 2.100 K in the other months.
5. Conclusion
In the study, ANN and remote sensing methods were
used to estimate monthly mean air temperature in Adana,
Afyonkarahisar, Ankara, Antalya, Artvin, Balıkesir, Den-
izli, Erzurum, Eskisßehir, _Istanbul-Go¨ztepe, _Izmir, Kars,
Kayseri, Konya, Malatya, Rize, Samsun, Sivas, Sßanlıurfa
and Van. While month, latitude, longitude, altitude, city
and monthly mean land surface temperature obtained
through satellite data were used as input in ANN, monthly
mean air temperature were used as output. Satellite based
Adana
270
280
290
300
310
1 2 3 4 5 6 7 8 9 10 11 12
Months
Airtemperature(K)
Meteorological value(K)
Estimated value(K)
Afyonkarahisar
260
270
280
290
300
1 2 3 4 5 6 7 8 9 10 11 12
Months
Airtemperature(K)
Ankara
250
260
270
280
290
300
1 2 3 4 5 6 7 8 9 10 11 12
Months
Airtemperature(K)
Antalya
270
280
290
300
310
1 2 3 4 5 6 7 8 9 10 11 12
Months
Airtemperature(K)
Artvin
260
270
280
290
300
1 2 3 4 5 6 7 8 9 10 11 12
Months
Airtemperature(K)
Balıkesir
260
270
280
290
300
1 2 3 4 5 6 7 8 9 10 11 12
Months
Airtemperature(K)
Denizli
270
280
290
300
1 2 3 4 5 6 7 8 9 10 11 12
Months
Airtemperature(K)
Erzurum
240
250
260
270
280
290
300
1 2 3 4 5 6 7 8 9 10 11 12
Months
Airtemperature(K)
Eskişehir
260
270
280
290
300
1 2 3 4 5 6 7 8 9 10 11 12
Months
Airtemperature(K)
İzmir
270
280
290
300
310
1 2 3 4 5 6 7 8 9 10 11 12
Months
Airtemperature(K)
Fig. 7. Comparison of monthly mean air temperature between ANN and meteorological values.
982 M. Sßahin / Advances in Space Research 50 (2012) 973–985
12. Author's personal copy
land surface temperature values were obtained through the
use of NOAA-AVHRR satellite data together with Ulivieri
et al. (1994) algorithm. The values were compared statically
to the meteorological values. In accordance with the litera-
ture, R and RMSE values were found 0.979 and 1.778 K,
respectively.
Various ANN models were employed in monthly mean
air temperature estimation. The data from the period of
1995–2004 were used to develop the models while the
2005 data were used to test the trained models. The opti-
mum result was obtained through the model 6-14-1. Six
neurons exist in the input layer of this model while four-
İstanbul-Göztepe
260
270
280
290
300
310
1 2 3 4 5 6 7 8 9 10 11 12
Months
Airtemperature(K)
Kars
250
260
270
280
290
300
1 2 3 4 5 6 7 8 9 10 11 12
Months
Airtemperature(K)
Kayseri
260
270
280
290
300
1 2 3 4 5 6 7 8 9 10 11 12
Months
Airtemperature(K)
Konya
260
270
280
290
300
1 2 3 4 5 6 7 8 9 10 11 12
Months
Airtemperature(K)
Malatya
260
270
280
290
300
310
1 2 3 4 5 6 7 8 9 10 11 12
Months
Airtemperature(K)
Rize
260
270
280
290
300
310
1 2 3 4 5 6 7 8 9 10 11 12
Months
Airtemperature(K)
Samsun
260
270
280
290
300
1 2 3 4 5 6 7 8 9 10 11 12
Months
Airtemperature(K)
Sivas
260
270
280
290
300
1 2 3 4 5 6 7 8 9 10 11 12
Months
Airtemperature(K)
Şanlıurfa
260
270
280
290
300
310
1 2 3 4 5 6 7 8 9 10 11 12
Months
Airtemperature(K)
Van
260
270
280
290
300
1 2 3 4 5 6 7 8 9 10 11 12
Months
Airtemperature(K)
Fig 7. (continued)
M. Sßahin / Advances in Space Research 50 (2012) 973–985 983
13. Author's personal copy
teen in the hidden layer, and one in the output layer.
More, R and RMSE values were found as 0.991 and
1.254 K, respectively when estimation results of the
model were compared to meteorological values. The out-
comes obtained through the study shows that the present
study is more accurate than other studies in the
literature.
To develop a successful model is very important like in
study belongs to remote sensing and ANN. Because, even if
it is possible for the same study to be successful only based
on meteorological data, inadequacy of meteorological sta-
tions, financial burden, and inconvenient geographic distri-
bution of meteorological stations due to climate conditions
cause remote sensing method to be unavoidable. As
known, meteorological satellites employed in remote sens-
ing studies are able to commit easier and cheaper data
transmitting by scanning the land surface. Thus, ANN
technique and remote sensing can be used as an alternate
method in air temperature estimations which are useful
for lots of applications including study of vector-borne dis-
eases, epidemic forecasting, weather forecasting, veterinary
uses, climate change, determination of various heat and
radiation fluxes, vapour pressure deficit, water potential,
urban land use and urban heat island, shortwave and long-
wave radiation, stomatal resistance, ecology, hydrology
and atmospheric sciences. And also, this method is offered
to researchers who study for the health of human being,
especially about high blood pressure, ischemic heart dis-
ease, respiratory infections and system, heat related mor-
tality, influenza, ambient temperature.
References
Aasamaa, K., So˜ber, A. Stomatal sensitivities to changes in leaf water
potential, air humidity, CO2 concentration and light intensity and the
effect of abscisic acid on the sensitivities in six temperate deciduous tree
species. Environ. Exp. Bot. 71, 72–78, 2011.
Almeida, S.P., Casimiro, E., Calheiros, J. Effects of apparent temperature
on daily mortality in Lisbon and Oporto. Environ. Health 9, 1–7,
Portugal, 2010.
Analitis, A., Katsouyanni, K., Biggeri, A., Baccini, M., Forsberg, B.,
Bisanti, L., Kirchmayer, U., Ballester, F., Cadum, E., Goodman, P.G.,
Hojs, A., Sunyer, J., Tiittanen, P., Michelozzi, P. Effects of cold
weather on mortality: results from 15 european cities within the
PHEWE project. Am. J. Epidemiol. 168, 1397–1408, 2008.
Ballester, F., Corella, D., Pe´rez-Hoyos, S., Sa´ez, M., Herva´s, A. Mortality
as a function of temperature: a study in Valencia, Spain, 1991–1993.
Int. J. Epidemiol. 26, 551–561, 1997.
Becker, F. The impact of spectral emissivity on the measurement of land
surface temperature from a satellite. Int. J. Remote Sens. 8, 1509–1522,
1987.
Becker, F., Li, Z.-L. Surface temperature and emissivity at various scales:
definition, measurement and related problems. Remote Sens. Rev. 12,
225–253, 1995.
Becker, F., Li, Z.L. Toward a local split window method over land
surface. Int. J. Remote Sens. 11, 369–393, 1990.
Bian, L., Li, L., Yan, G. Combining global and local estimates for spatial
distribution of mosquito larval habitats. GISci. Remote Sens. 43, 128–
141, 2006.
Bocchiola, D., Diolaiuti, G. Evidence of climate change within the
Adamello Glacier of Italy. Theor. Appl. Climatol. 100, 351–369, 2010.
Brunsell, N.A., Mechem, D.B., Anderson, M.C. Surface heterogeneity
impacts on boundary layer dynamics via energy balance partitioning.
Atmos. Chem. Phys. 11, 3403–3416, 2011.
C¸ am, E., Arcaklıog˘lu, E., C¸ avusßog˘lu, A., Akbıyık, B.A. Classification
mechanism for determining average wind speed and power in several
regions of Turkey using artificial neural networks. Renew. Energy 30,
227–239, 2005.
Cheval, S., Dumitrescu, A., Bell, A. The urban heat island of Bucharest
during the extreme high temperatures of July 2007. Theor. Appl.
Climatol. 97, 391–401, 2009.
Coll, C., Sobrino, J.A., Valor, E. On the atmospheric dependence of the
split-window equation for land surface temperature. Int. J. Remote
Sens. 15, 105–122, 1994.
Cresswell, M.P., Morse, A.P., Thomson, M.C., Connor, S.J. Estimating
surface air temperatures from METEOSAT land surface temperatures
using an empirical solar zenith angle model. Int. J. of Remote Sens. 20,
1125–1132, 1999.
Czajkowski, K.P., Mulhern, T., Goward, S.N., Cihlar, J., Dubayah, R.O.,
Prince, S.D. Biospheric environmental monitoring at BOREAS with
AVHRR observations. J. Geophys. Res. 102, 29651–29662, 1997.
Elwood, P.C., Beswick, A., O’Brien, J.R., Renaud, S., Fifield, R., Limb,
E.S., Bainton, D. Temperature and risk factors for ischaemic heart
disease in the caerphilly prospective study. British Heart J. 70, 520–
523, 1993.
Gates, D.M. Biophysical Ecology. Springer, New York, 1980.
Goetz, S.J., Prince, S.D., Small, J. Advances in satellite remote sensing of
environmental variables for epidemiological applications. Adv. Para-
sit. 47, 289–307, 2000.
Goward, S.N., Markham, B., Dye, D.G., Dulaney, W., Yang, J.
Normalized difference vegetation index measurements from the
advanced very high resolution radiometer. Remote Sens. Environ.
35, 257–277, 1991.
Haykin, S. Neural Networks: A Comprehensive Foundation. Prentice-
Hall International Inc., New Jersey, 1999.
Heding, S., Kai, L., Hanchun, C., Xianlong, C., Yongan, H., Zhiyi, S.
Experimental ecology and hibernation of onchidium struma (gastrop-
oda: pulmonata: systellommatophora). J. Exp. Mar. Biol. Ecol. 396,
71–76, 2011.
Jain, S.K., Jain, S.K., Hariprasad, V., Choudhry, A. Water balance study
for a basin integrating remote sensing data and GIS. Indian Society of
Remote Sensing, 2011, http://dx.doi.org/10.1007/s12524-011-0078-2
Jang, J.D., Viau, A.A., Anctil, F. Neural network estimation of air
temperatures from AVHRR data. Int. J. Remote Sens. 25, 4541–4554,
2004.
Kalogirou, S.A. Applications of artificial neural-networks for energy
systems. Appl. Energy 67, 17–35, 2000.
Kalogirou, S.A. Artificial neural networks in renewable energy systems
applications: a review. Renew. Sust. Energy Rev. 5, 373–401, 2001.
Katsiabani, K., Adaktilou, N., Cartalis, C. A generalised methodology for
estimating land surface temperature for non-urban areas of Greece
through the combined use of NOAA–AVHRR data and ancillary
information. Adv. Space Res. 43, 930–940, 2009.
Kawamura, H., Edamatsu, Y. Better understanding of earth environment.
Int. Geosci. Remote Sens. Symp. 3, 473–1475, 1993.
Kendall, M.A., Stuart, A. The Advanced Theory of Statistics. Griffin,
London, 1963.
Kittel, T.G.F., Baker, B.B., Higgins, J.V., Haney, J.C. Climate vulnera-
bility of ecosystems and landscapes on Alaska’s North Slope. Reg.
Environ. Change 11, 249–264, 2011.
Kucharik, C.J., Serbin, S.P., Vavrus, S., Hopkins, E.J., Motew, M.M.
Patterns of climate change across Wisconsin from 1950 to 2006. Phys.
Geogr. 31, 1–28, 2010.
Kunst, A.E., Looman, C.W.N., Johan, P.M. Outdoor air temperature and
mortality in the Netherlands: a time-series analysis. Am. J. Epidemiol.
137, 331–334, 1993.
Lakshmi, V., Czajkowski, K., Dubayah, R., Susskind, J. Land surface air
temperature mapping using TOVS and AVHRR. Int. J. Remote Sens.
22, 643–662, 2001.
984 M. Sßahin / Advances in Space Research 50 (2012) 973–985
14. Author's personal copy
Laurent, H., Jobard, I., Toma, A. Validation of satellite and ground-based
estimates of precipitation over the Sahel. Atmos. Res. 47–48, 651–670,
1998.
Lee, S.H., Kim, S.W., Angevine, W.M., Bianco, L., McKeen, S.A., Senff,
C.J., Trainer, M., Tucker, S.C., Zamora, R.J. Evaluation of urban
surface parameterizations in the WRF model using measurements
during the Texas air quality study 2006 field campaign. Atmos. Chem.
Phys. 11, 2127–2143, 2011.
Michelozzi, P., Accetta, G., De Sario, M., D’Ippoliti, D., Marino, C.,
Baccini, M., Biggeri, A., Anderson, H.R., Katsouyanni, K., Ballester,
F., Bisanti, L., Cadum, E., Forsberg, B., Forastiere, F., Goodman,
P.G., Hojs, A., Kirchmayer, U., Medina, S., Paldy, A., Schindler, C.,
Sunyer, J., Perucci, C.A. High temperature and hospitalizations for
cardiovascular and respiratory causes in 12 European cities. Am. J.
Respir. Crit. Care Med. 179, 383–389, 2009.
Myint, S.W., Brazel, A., Okin, G., Buyantuyev, A. Combined effects of
impervious surface and vegetation cover on air temperature variations
in a rapidly expanding desert city. GISci. Remote Sens. 47, 301–320,
2010.
Ouaidrari, H., Gowarda, S.N., Czajkowskib, K.P., Sobrinoc, J.A.,
Vermotea, E. Land surface temperature estimation from AVHRR
thermal infrared measurements: An assessment for the AVHRR Land
Pathfinder II data set. Remote Sens. Environ. 81, 114–128, 2002.
Pinheiro, A.C.T., Mahoney, R., Privette, J.L., Tucker, C.J. Development
of a daily long term record of NOAA-14 AVHRR land surface
temperature over Africa. Remote Sens. Environ. 103, 153–164, 2006.
Price, J.C. Land surface temperature measurements from the split window
channels of the NOAA-7/AVHRR. J. Geophys. Res. 89, 7231–7237,
1984.
Prihodko, L., Goward, S.N. Estimation of air temperature from remotely
sensed surface observations. Remote Sens. Environ. 60, 335–346, 1997.
Riddering, J.P., Queen, L.P. Estimating near-surface air temperature with
NOAA –AVHRR. Can. J. Remote Sens. 32, 33–43, 2006.
Santos, P., Negri, A.J. A comparison of the normalized difference
vegetation index and rainfall for the Amazon and Northeastern Brazil.
J. Appl. Meteorol. 36, 958–965, 1997.
Smith, L.C. Agents of change in the New North. Eurasian Geography and
Economics. 52, 30–55, 2011.
Sobrino, J.A., Li, Z.L., Stoll, M.P., Becker, F. Multi-channel and multi-
angle algorithms for estimating sea and land surface temperature with
ATSR data. Int. J. Remote Sens. 17, 2089–2114, 1996.
Stanelle, T., Vogel, B., Vogel, H., Baumer, D., Kottmeier, C. Feedback
between dust particles and atmospheric processes over West Africa
during dust episodes in March 2006 and June 2007. Atmos. Chem.
Phys. 10, 10771–10788, 2010.
Stisen, S., Sandholt, I., Nørgaard, A., Fensholt, R., Eklundh, L.
Estimation of diurnal air temperature using MSG SEVIRI data in
West Africa. Remote Sens. Environ. 110, 262–274, 2007.
Sßahin, M., Kandırmaz, H.M. Calculation land surface temperature
depending on Becker and Li-1990 algorithm. J. Therm. Sci. Technol.
30, 35–43, 2010.
Thomson, M.C., Connor, S.J., Milligan, P.J.W., Flasse, S. The ecology of
malaria – as seen from earth observation satellites. Ann. Trop. Med.
Parasit. 90, 243–264, 1996.
Ulivieri, C., Castronuovo, M.M., Francioni, R., Cardillo, A. A split
window algorithm for estimating land surface temperature from
satellites. Adv. Space Res. 14, 59–65, 1994.
Valor, E., Casselles, V. Mapping of land surface emissivity from NDVI:
application to European, African, and South American Areas. Remote
Sens. Environ. 57, 167–184, 1995.
Vancutsem, C., Ceccato, P., Dinku, T., Connor, S.J. Evaluation of
MODIS land surface temperature data to estimate air temperature in
different ecosystems over Africa. Remote Sens. Environ. 114, 449–465,
2010.
Vazquez, D.P., Reyes, F.J.O., Arboledas, L.A. A comparative study of
algorithms for estimation of land surface temperature from AVHRR.
Remote Sens. Environ. 62, 215–222, 1997.
Vidal, A. Atmospheric and emissivity correction of land surface temper-
ature measured from satellite using ground measurements or satellite
data. Int. J. Remote Sens. 12, 2449–2460, 1991.
Viotti, P., Liuti, G., Genova, P.D. Atmospheric urban pollution:
applications of an artificial neural network (ANN) to the City Peugia.
Ecol. Model. 148, 27–46, 2002.
Vogl, T.P., Mangis, J.K., Rigler, A.K., Zink, W.T., Alkon, D.L.
Accelerating the convergence of the backpropagation method. Biol.
Cybern. 59, 257–263, 1988.
Yu, Y., Privette, J.L., Pinheiro, A.C., Vogel, R. Theoretical evaluation of
split window methods to retrieve land surface temperature. IEEE
Trans. Geosci. Remote Sens. 46, 179–192, 2008.
M. Sßahin / Advances in Space Research 50 (2012) 973–985 985