Download as PDF, PPTX

![that need bias correction
TCD
9, 3821–3857, 2015
Improved Arctic sea
ice thickness
projections using
bias corrected CMIP5
simulations
N. Melia et al.
Title Page
Abstract Introduction
Conclusions References
Tables Figures
J I
J I
Back Close
Full Screen / Esc
Printer-friendly Version
Interactive Discussion
DiscussionPaper|DiscussionPaper|DiscussionPaper|DiscussionPaper|
The Cryosphere Discuss., 9, 3821–3857, 2015
www.the-cryosphere-discuss.net/9/3821/2015/
doi:10.5194/tcd-9-3821-2015
© Author(s) 2015. CC Attribution 3.0 License.
This discussion paper is/has been under review for the journal The Cryosphere (TC).
Please refer to the corresponding final paper in TC if available.
Improved Arctic sea ice thickness
projections using bias corrected CMIP5
simulations
N. Melia1
, K. Haines2
, and E. Hawkins3
1
Department of Meteorology, University of Reading, Reading, UK
2
National Centre for Earth Observation, Department of Meteorology, University of Reading,
Reading, UK
3
NCAS-Climate, Department of Meteorology, University of Reading, Reading, UK
Received: 26 June 2015 – Accepted: 29 June 2015 – Published: 22 July 2015
Correspondence to: N. Melia (n.melia@pgr.reading.ac.uk)
Published by Copernicus Publications on behalf of the European Geosciences Union.
3821
ESDD
6, 1999–2042, 2015
Ensemble bias
correction
S. Sippel et al.
Title Page
Abstract Introduction
Conclusions References
Tables Figures
J I
DiscussionPaper|DiscussionPaper|Discussio
Earth Syst. Dynam. Discuss., 6, 1999–2042, 2015
www.earth-syst-dynam-discuss.net/6/1999/2015/
doi:10.5194/esdd-6-1999-2015
© Author(s) 2015. CC Attribution 3.0 License.
This discussion paper is/has been under review for the journal Earth System
Dynamics (ESD). Please refer to the corresponding final paper in ESD if available.
A novel bias correction methodology for
climate impact simulations
S. Sippel1,2
, F. E. L. Otto3
, M. Forkel1
, M. R. Allen3
, B. P. Guillod3
, M. Heimann1
,
M. Reichstein
1
, S. I. Seneviratne
2
, K. Thonicke
4
, and M. D. Mahecha
1,5
1
Max Planck Institute for Biogeochemistry, Hans-Knöll-Str. 10, 07745 Jena, Germany
2
Institute for Atmospheric and Climate Science, ETH Zürich, Rämistr. 101,
8075 Zürich, Switzerland
3
Environmental Change Institute, University of Oxford, South Parks Road,
Bias correction of regional climate model simulations for hydrological
climate-change impact studies: Review and evaluation of different methods
Claudia Teutschbein a,⇑
, Jan Seibert a,b,c
a
Department of Physical Geography and Quaternary Geology, Stockholm University, Svante Arrhenius Väg 8, S-10691 Stockholm, Sweden
b
Department of Geography, University of Zurich, Winterthurerstrasse 190, CH-8057 Zurich, Switzerland
c
Department of Earth Sciences, Uppsala University, Villavägen 16, S-75236 Uppsala, Sweden
a r t i c l e i n f o
Article history:
Received 14 March 2012
Received in revised form 14 May 2012
Accepted 26 May 2012
Available online 6 June 2012
This manuscript was handled by
Konstantine P. Georgakakos, Editor-in-Chief,
with the assistance of Ashish Sharma,
Associate Editor
Keywords:
RCM
Bias correction
Downscaling
Hydrology
HBV
Streamflow
s u m m a r y
Despite the increasing use of regional climate model (RCM) simulations in hydrological climate-change
impact studies, their application is challenging due to the risk of considerable biases. To deal with these
biases, several bias correction methods have been developed recently, ranging from simple scaling to
rather sophisticated approaches. This paper provides a review of available bias correction methods and
demonstrates how they can be used to correct for deviations in an ensemble of 11 different RCM-simu-
lated temperature and precipitation series. The performance of all methods was assessed in several ways:
At first, differently corrected RCM data was compared to observed climate data. The second evaluation
was based on the combined influence of corrected RCM-simulated temperature and precipitation on
hydrological simulations of monthly mean streamflow as well as spring and autumn flood peaks for five
catchments in Sweden under current (1961–1990) climate conditions. Finally, the impact on hydrological
simulations based on projected future (2021–2050) climate conditions was compared for the different
bias correction methods. Improvement of uncorrected RCM climate variables was achieved with all bias
correction approaches. While all methods were able to correct the mean values, there were clear differ-
ences in their ability to correct other statistical properties such as standard deviation or percentiles. Sim-
ulated streamflow characteristics were sensitive to the quality of driving input data: Simulations driven
with bias-corrected RCM variables fitted observed values better than simulations forced with uncorrected
RCM climate variables and had more narrow variability bounds.
Ó 2012 Elsevier B.V. All rights reserved.
Journal of Hydrology 456–457 (2012) 12–29
Contents lists available at SciVerse ScienceDirect
Journal of Hydrology
journal homepage: www.elsevier.com/locate/jhydrol
Intercomparison of bias-correction methods for monthly
temperature and precipitation simulated by multiple
climate models
Satoshi Watanabe,1
Shinjiro Kanae,2
Shinta Seto,3
Pat J.-F. Yeh,4
Yukiko Hirabayashi,1
and Taikan Oki3
Received 28 May 2012; revised 20 October 2012; accepted 23 October 2012; published 13 December 2012.
[1] Bias-correction methods applied to monthly temperature and precipitation data
simulated by multiple General Circulation Models (GCMs) are evaluated in this study.
JOURNAL OF GEOPHYSICAL RESEARCH, VOL. 117, D23114, doi:10.1029/2012JD018192, 2012](https://image.slidesharecdn.com/presentaiontcdfaf2016lowres-160517125626/75/Presentation-at-Adaptation-Futures-2016-Conference-7-2048.jpg)
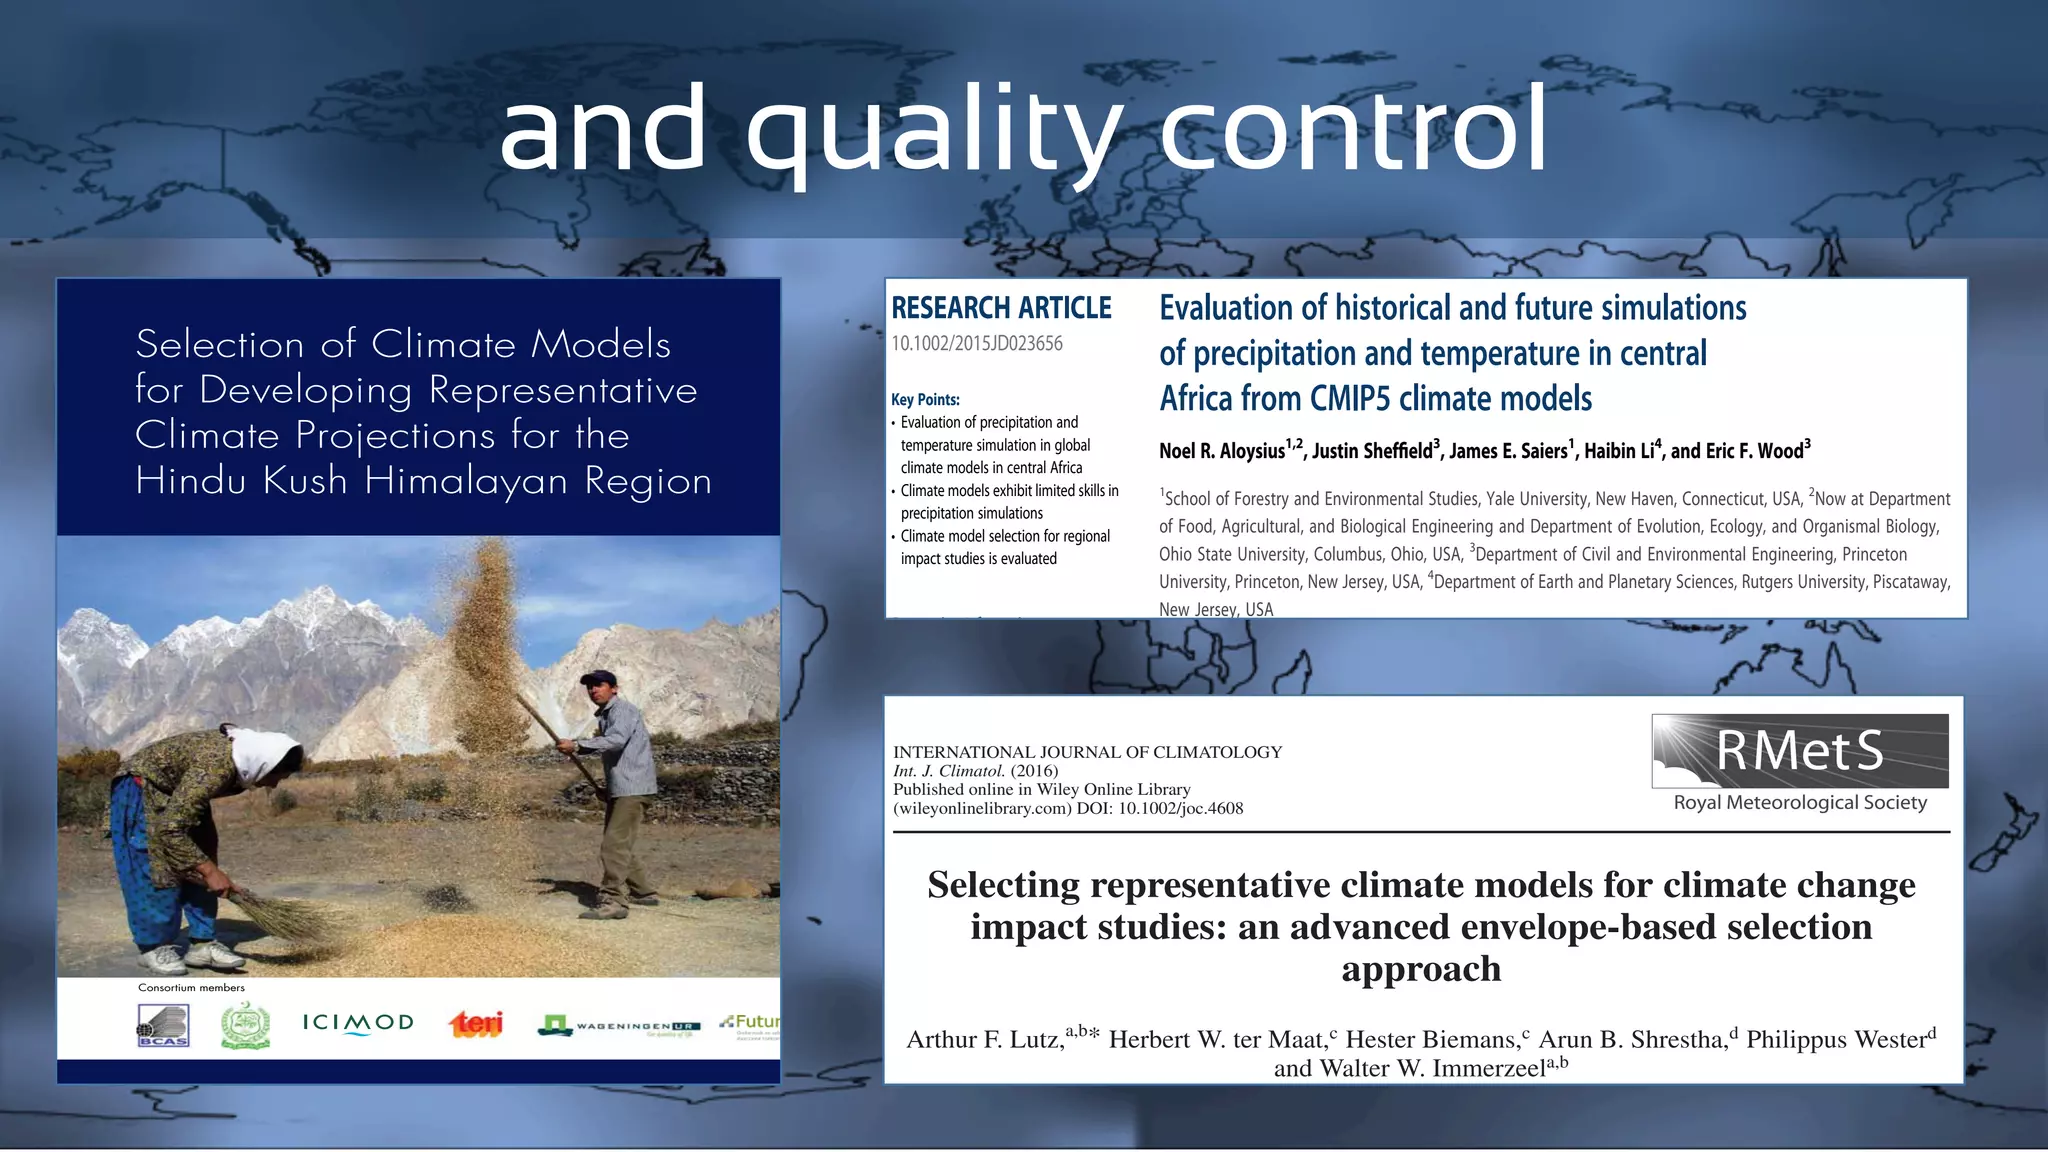


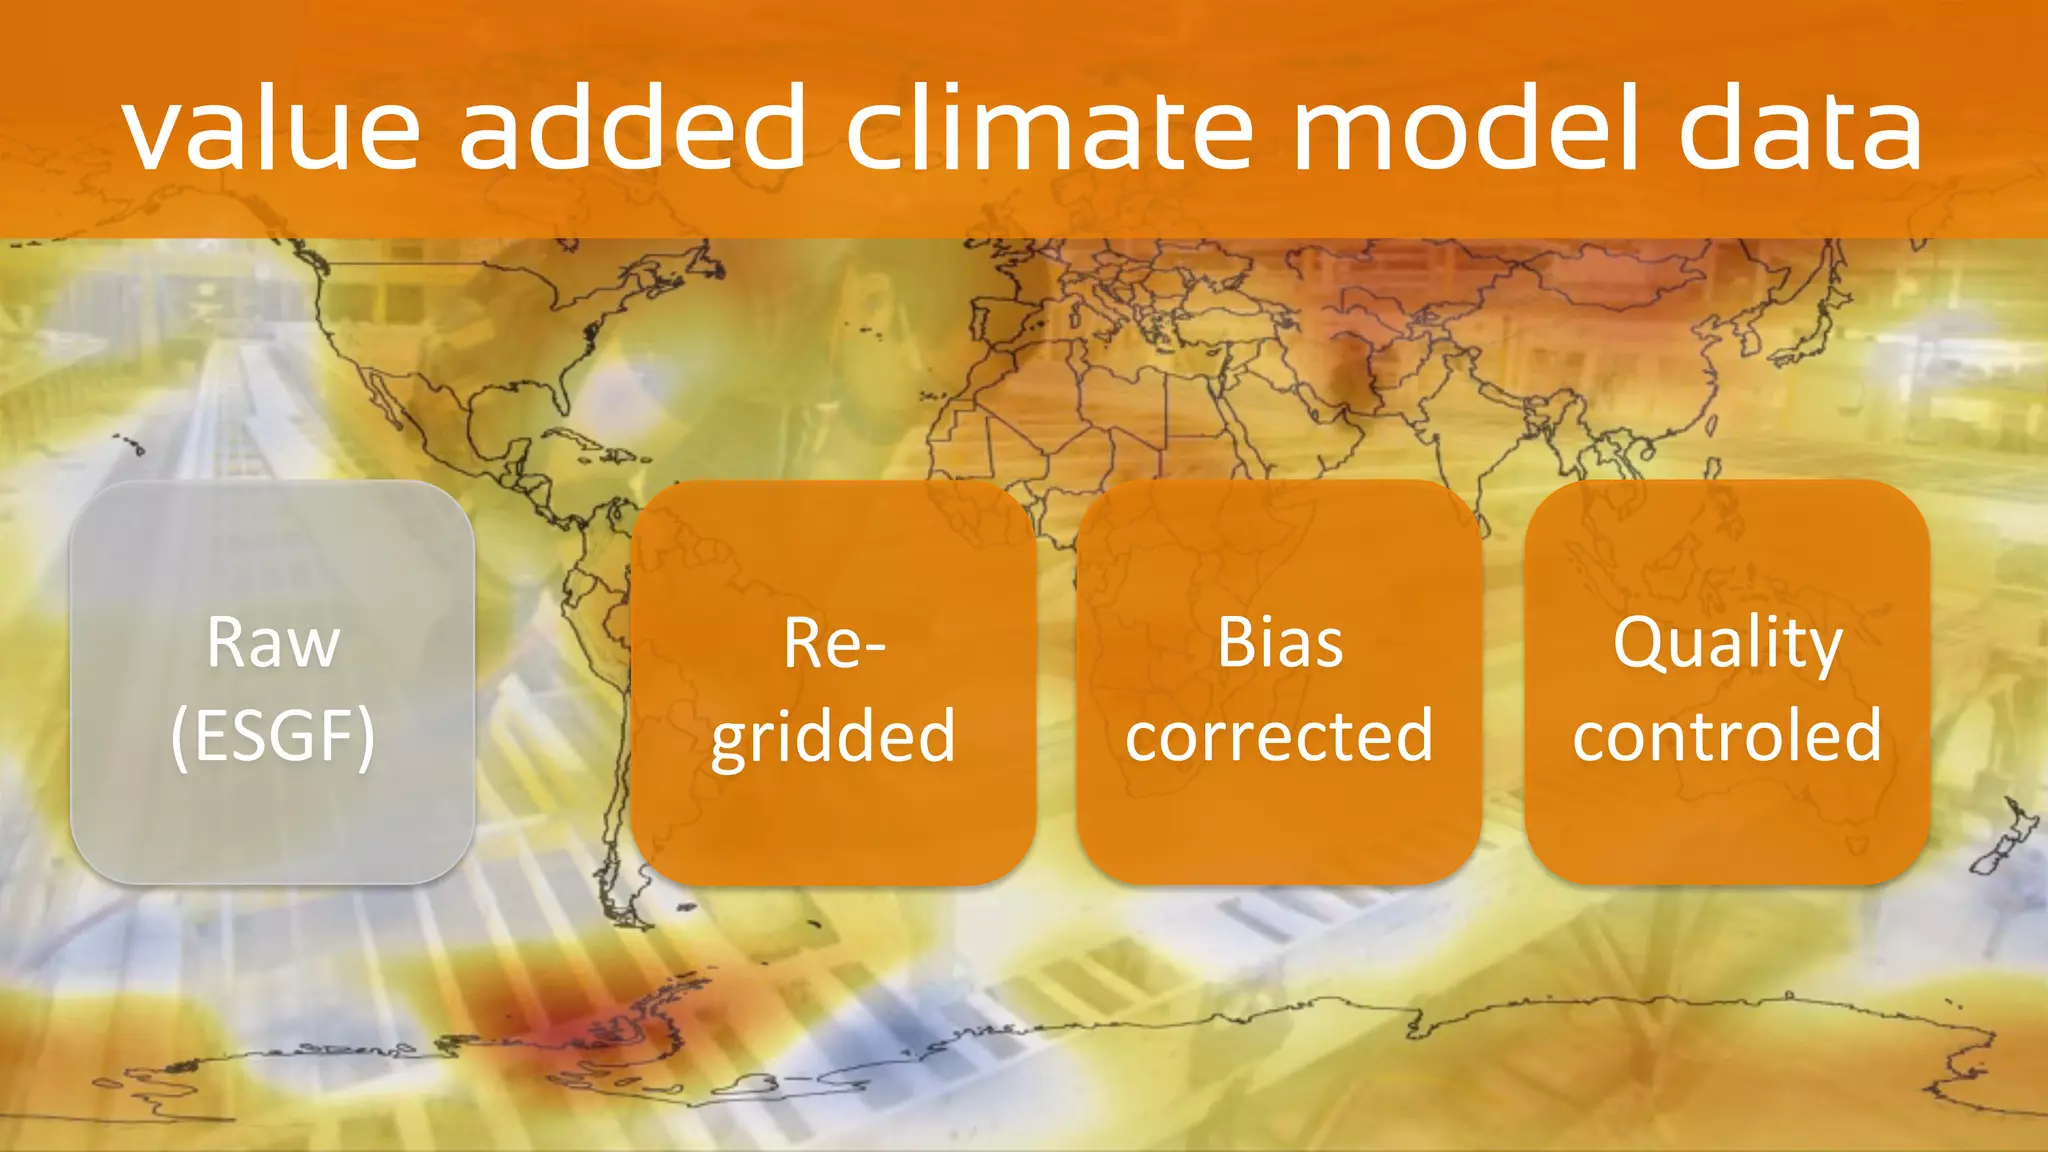
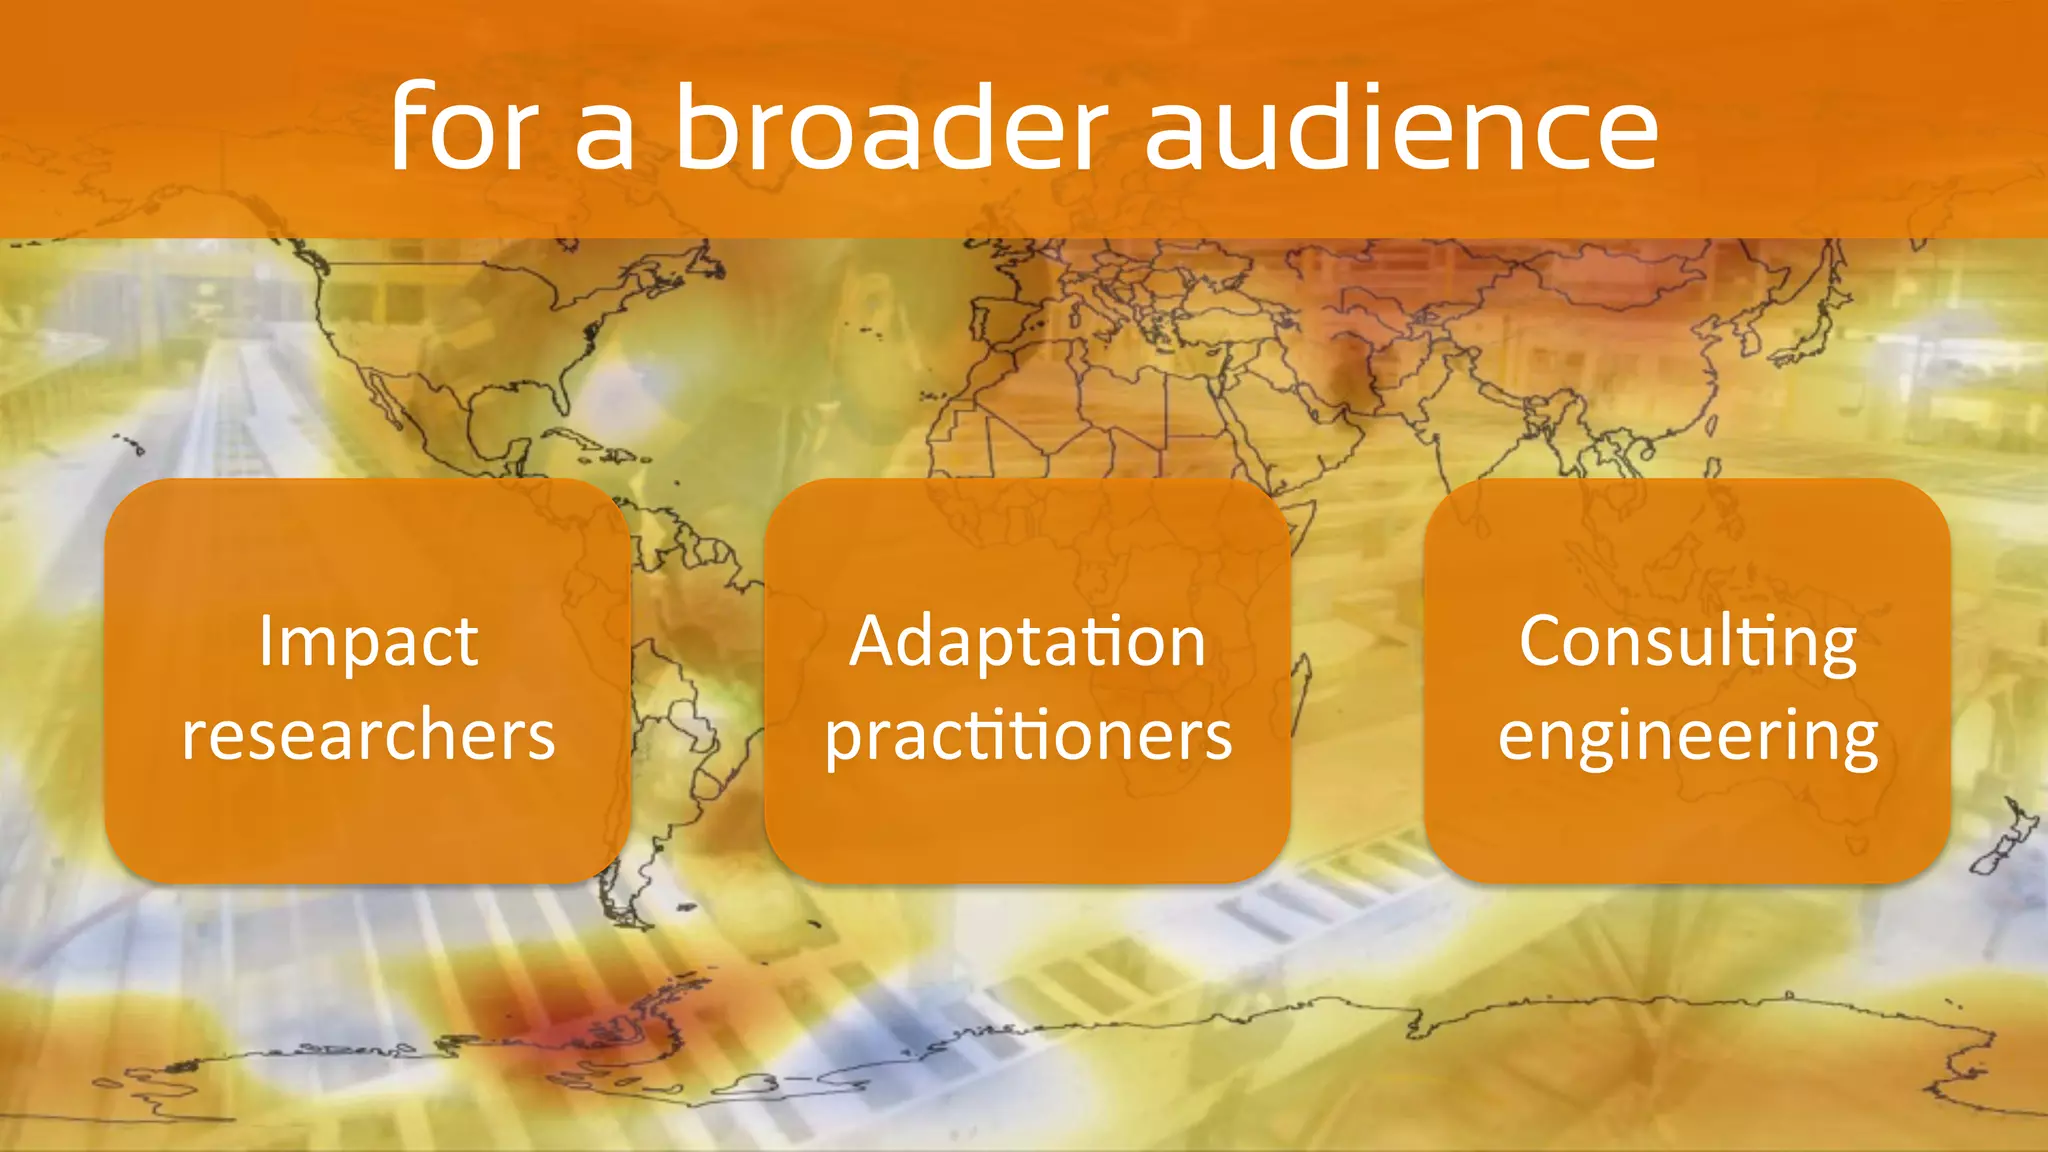


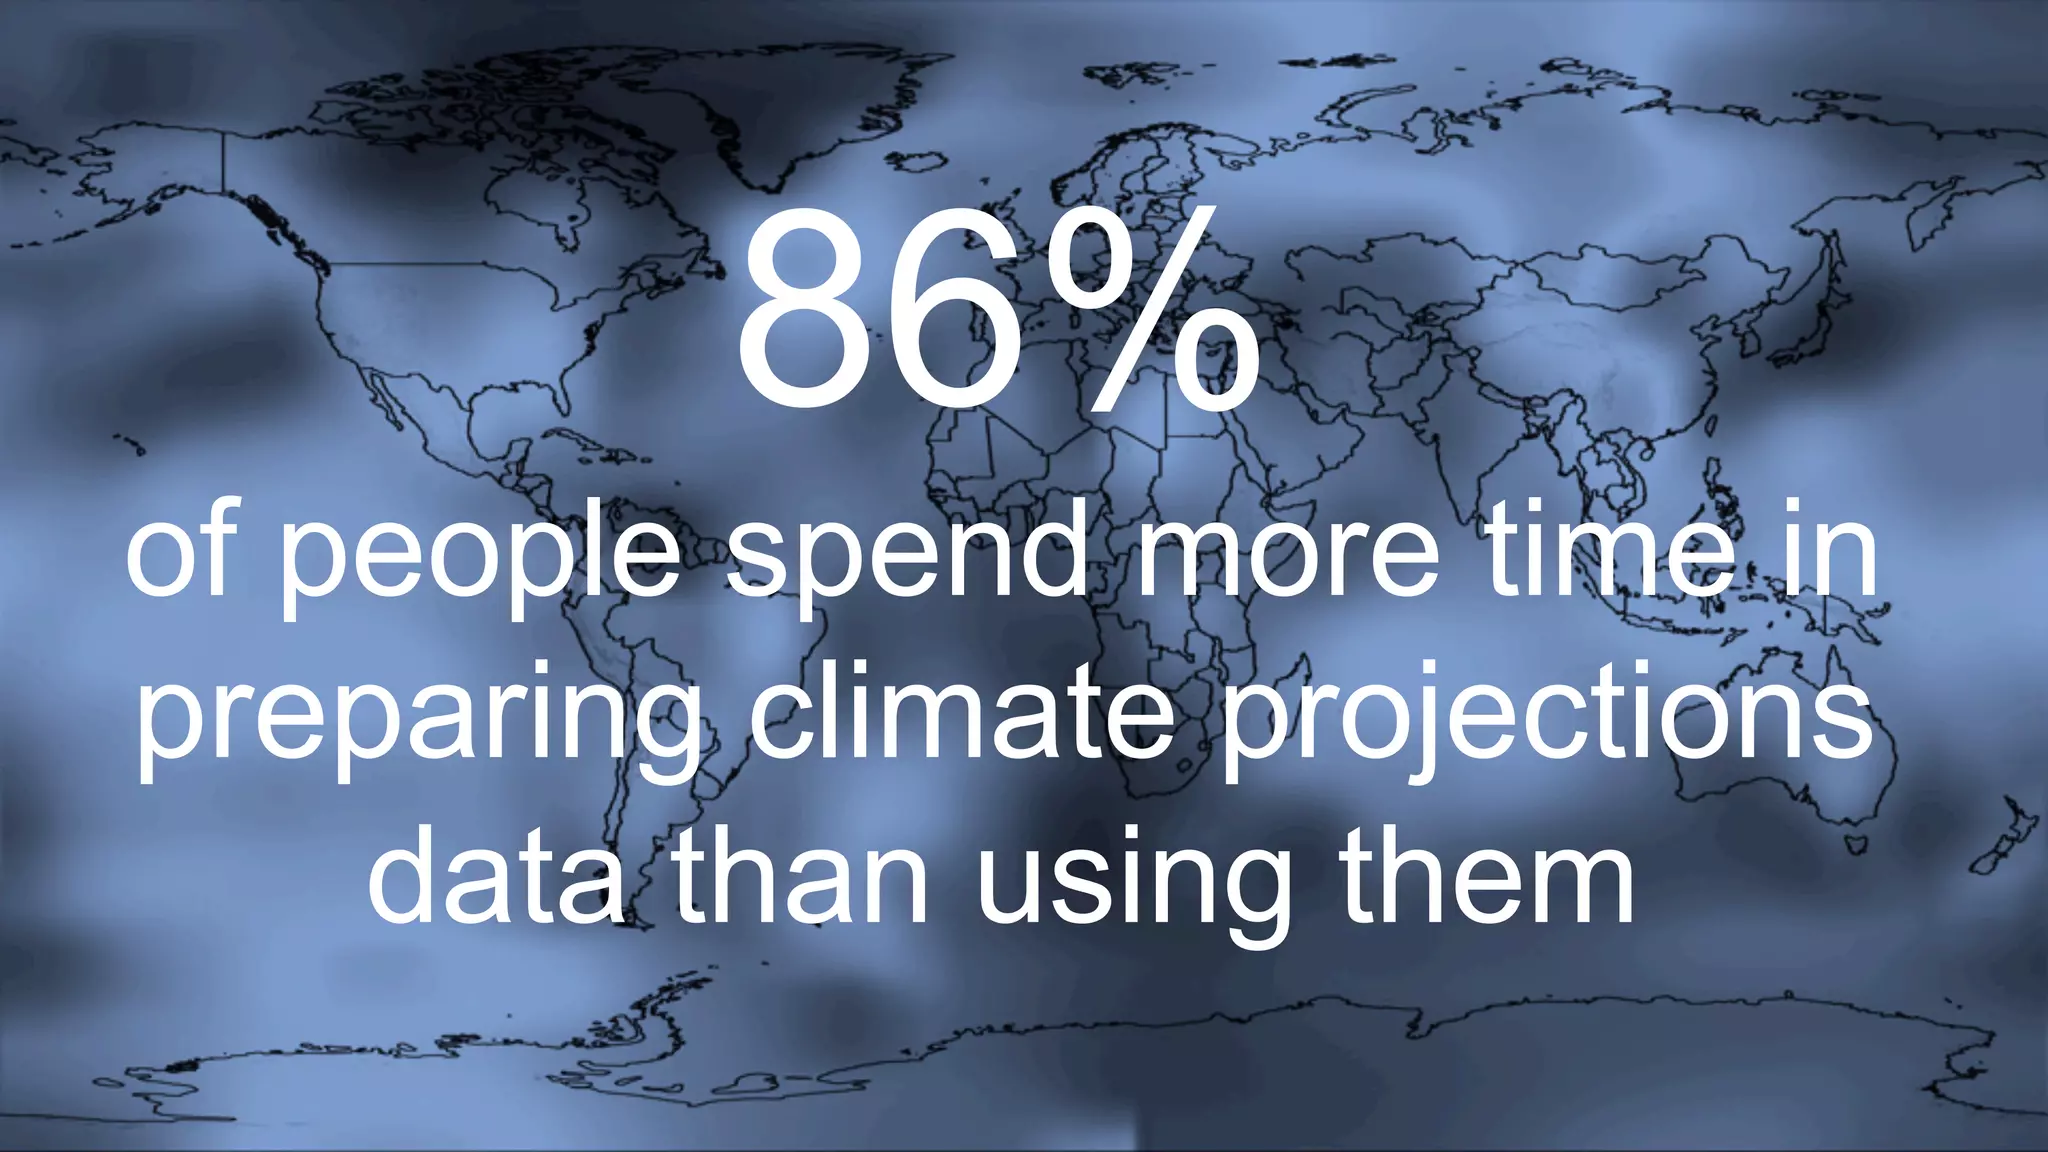
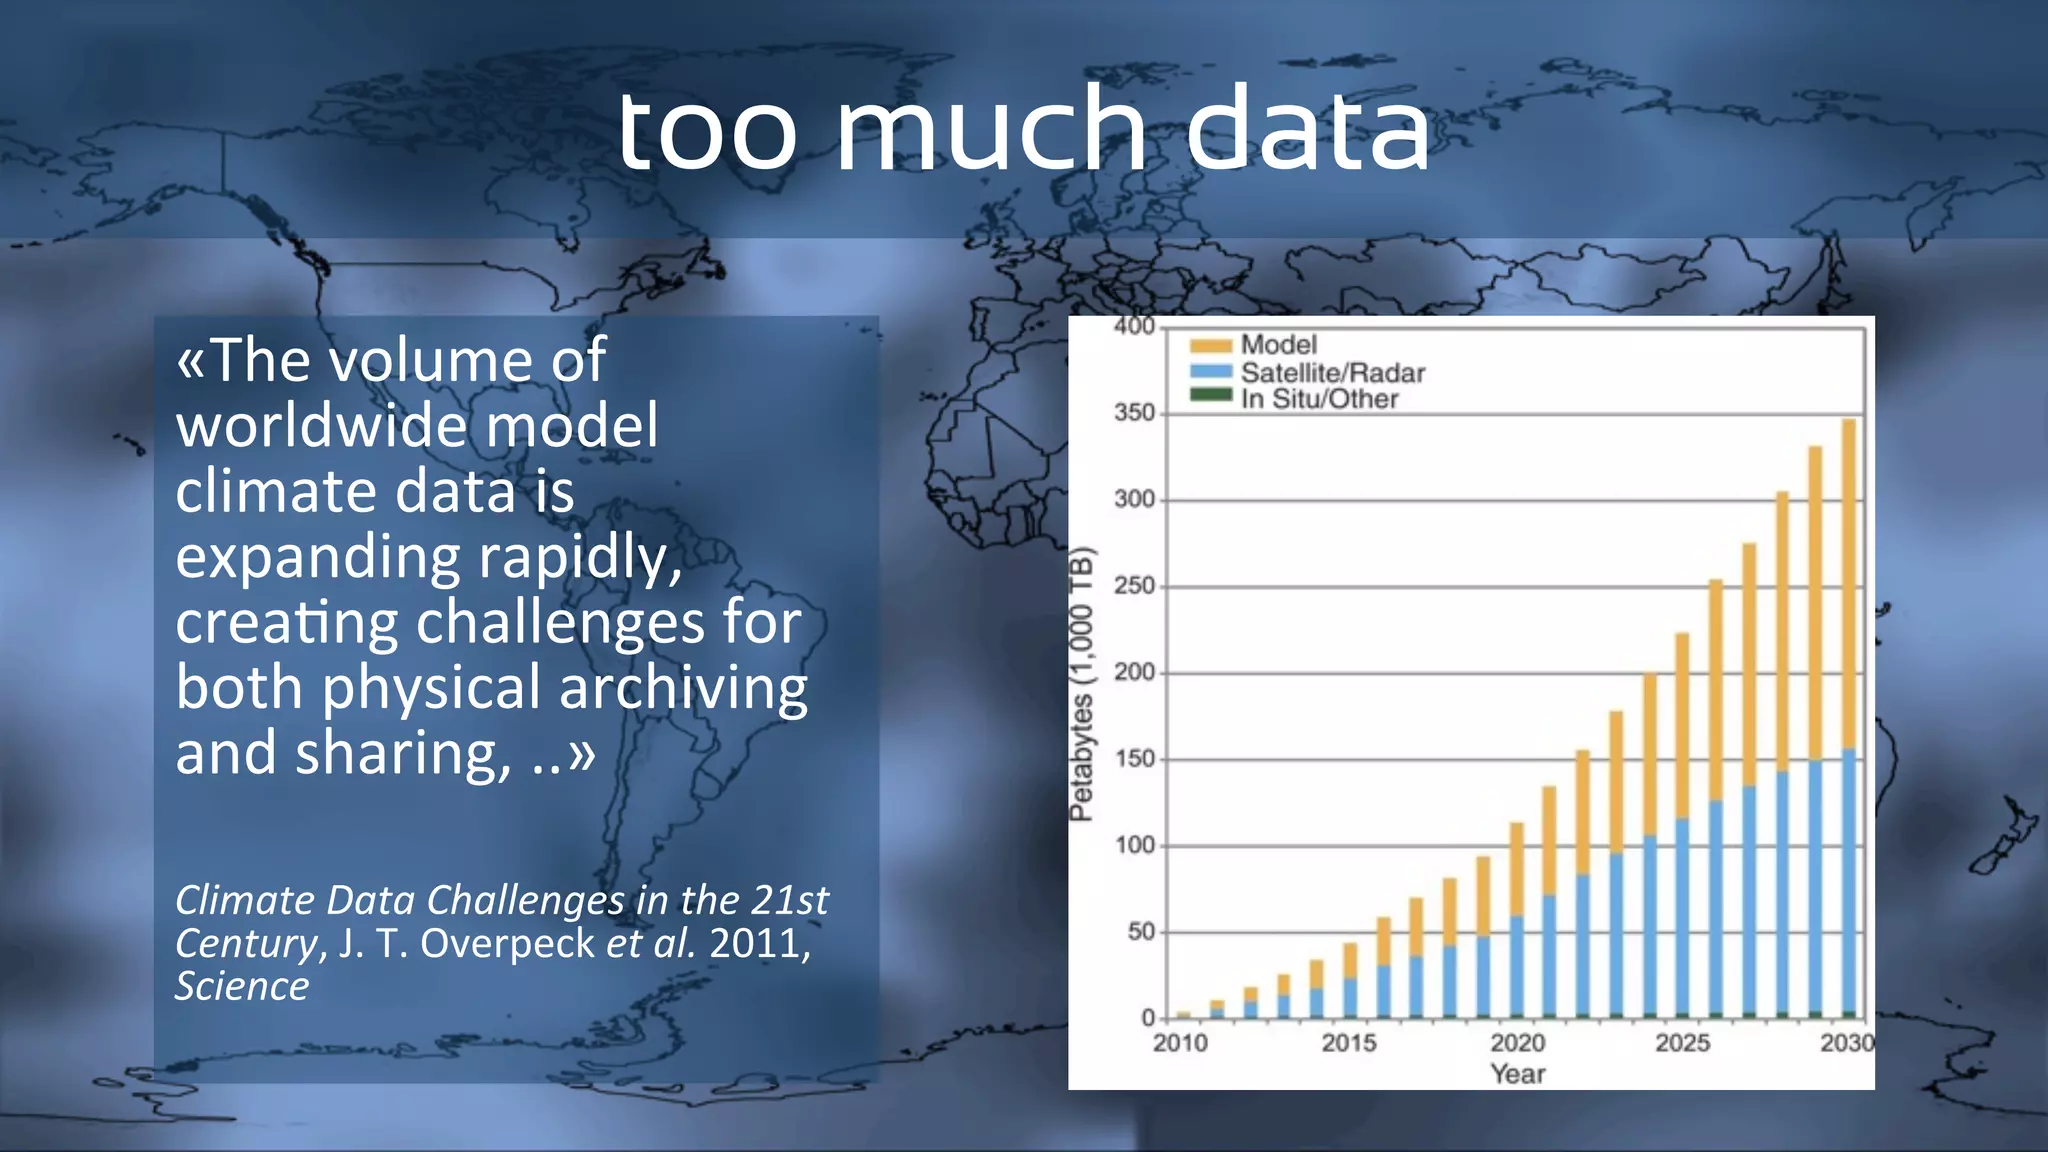
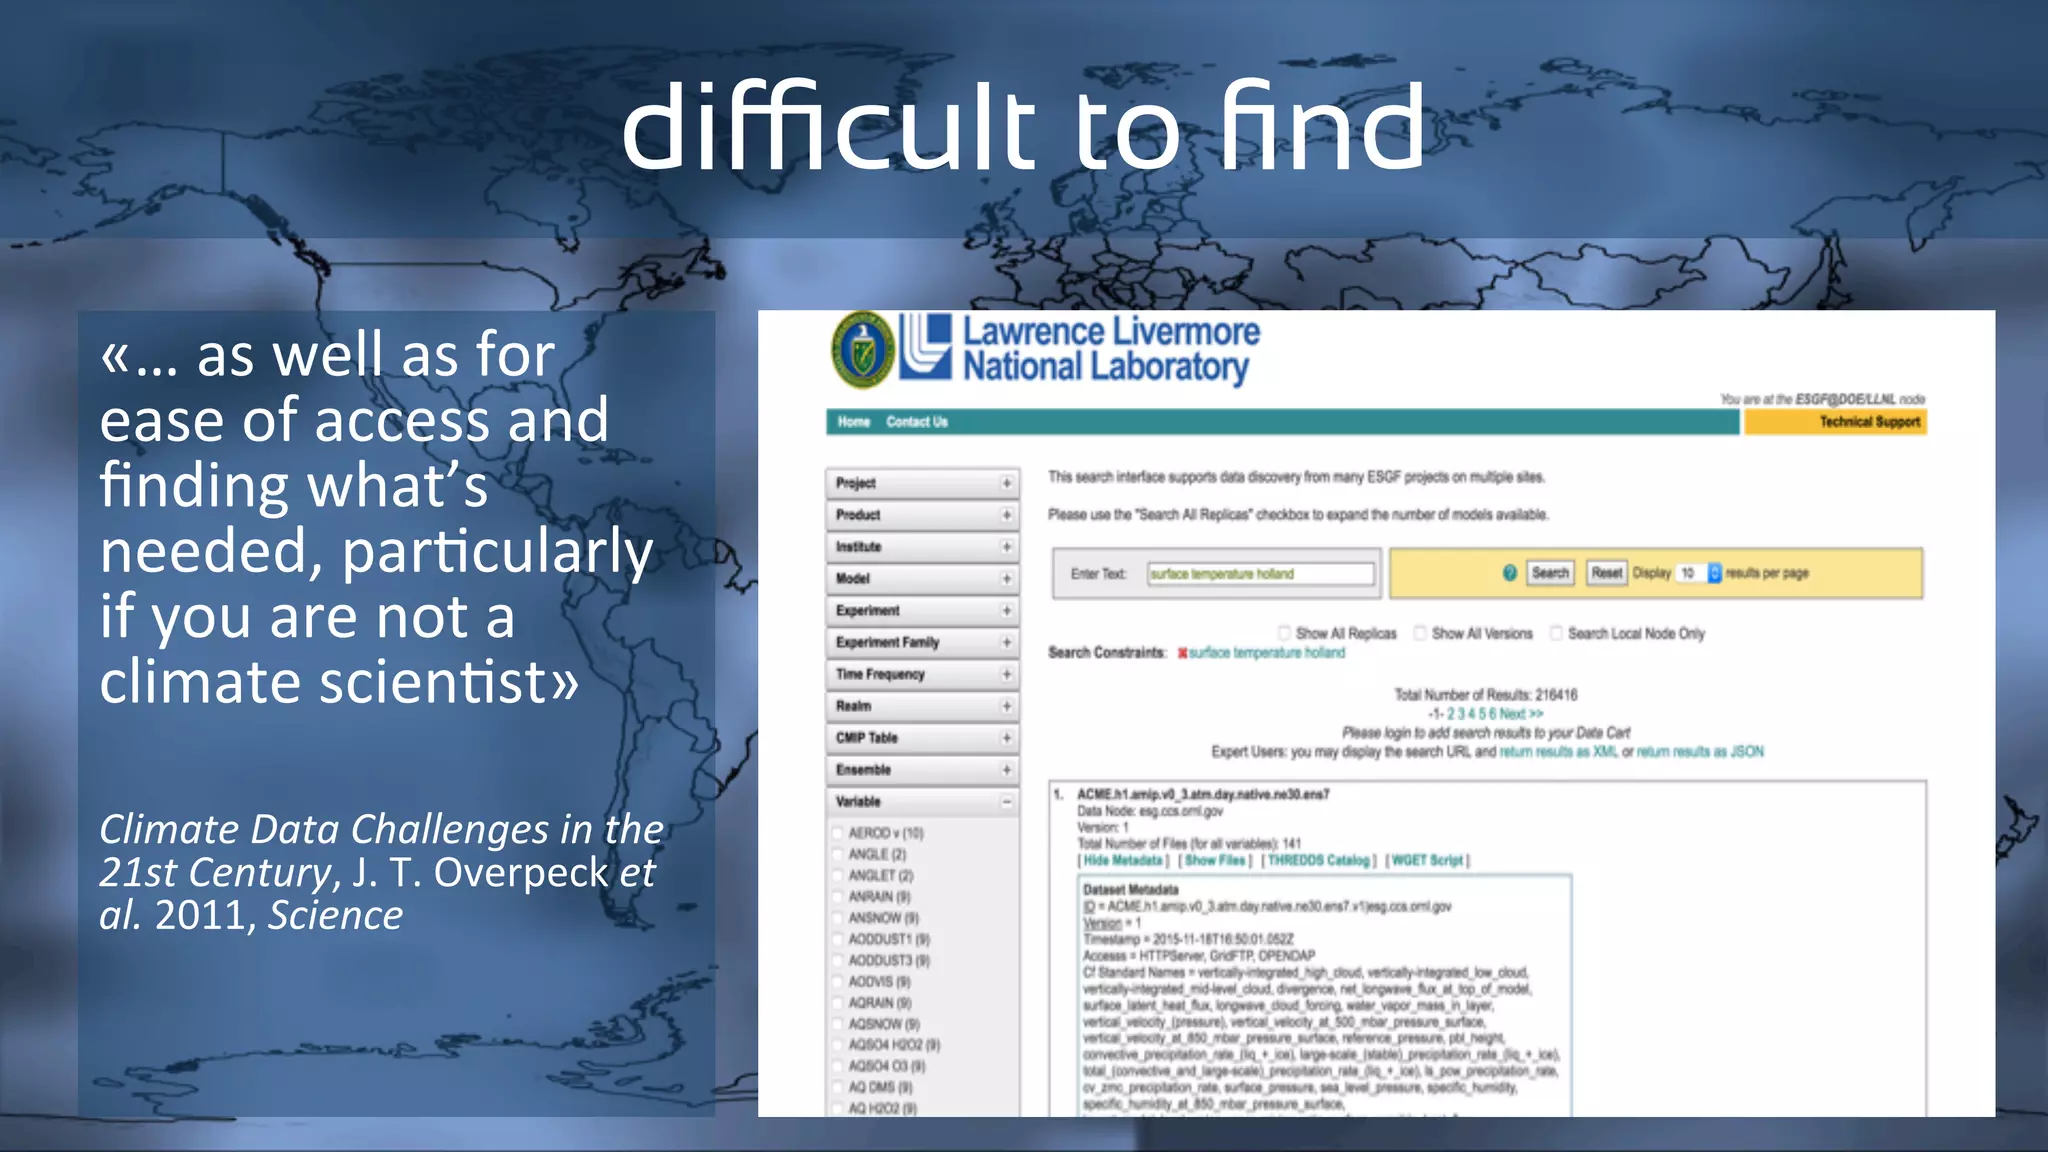
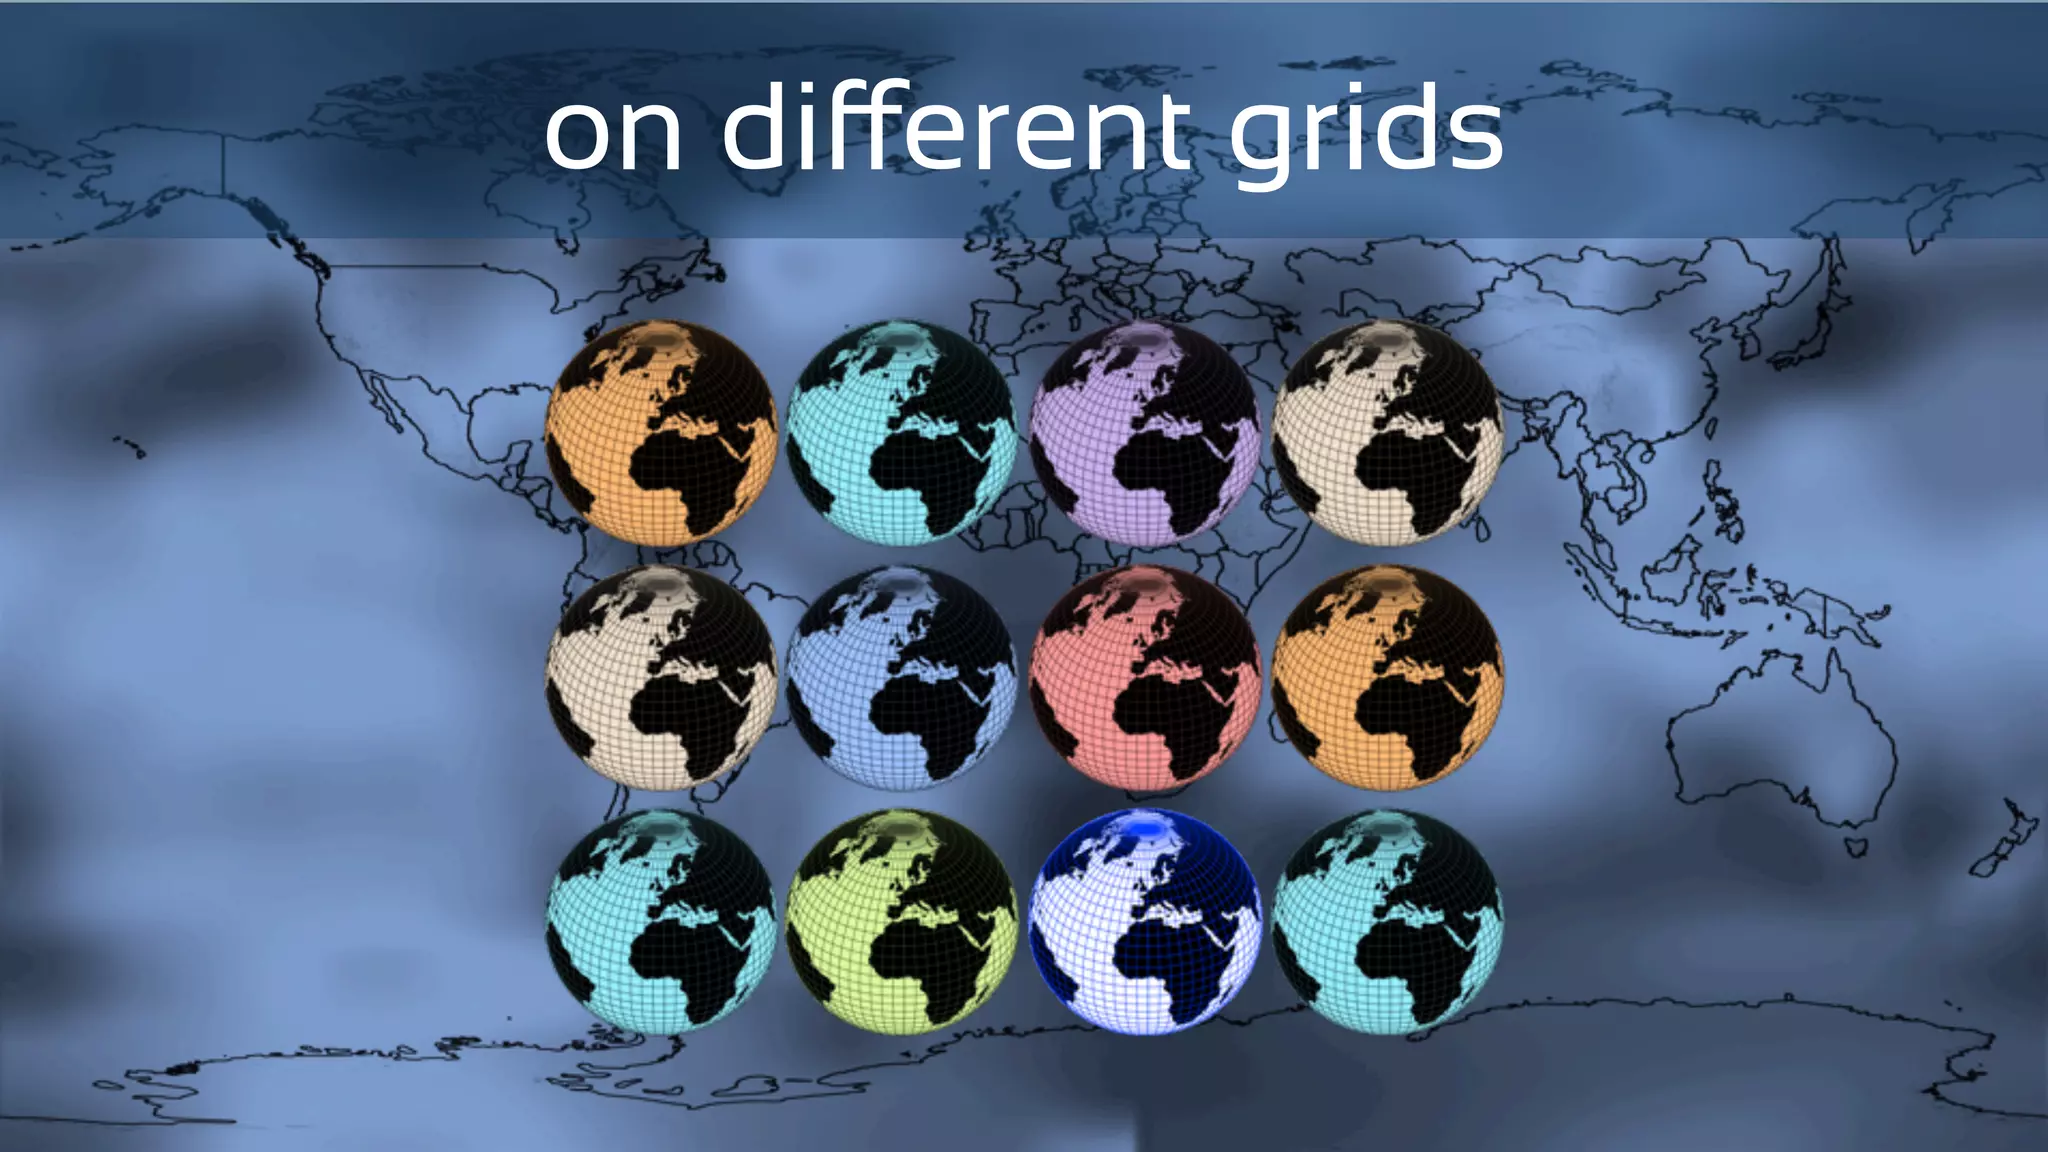
This document describes The Climate Data Factory, a service that aims to make climate projection data easier to access and use for non-climate scientists. It notes that preparing and working with raw climate model data is currently difficult and time-consuming for most users due to issues like different grids, bias, and data volume. The Climate Data Factory addresses these problems by providing re-gridded, bias-corrected, quality-controlled climate model projections that can be easily searched and accessed through their website. This is intended to help various audiences like impact researchers, adaptation practitioners, and consulting engineers make more effective use of climate model data.


