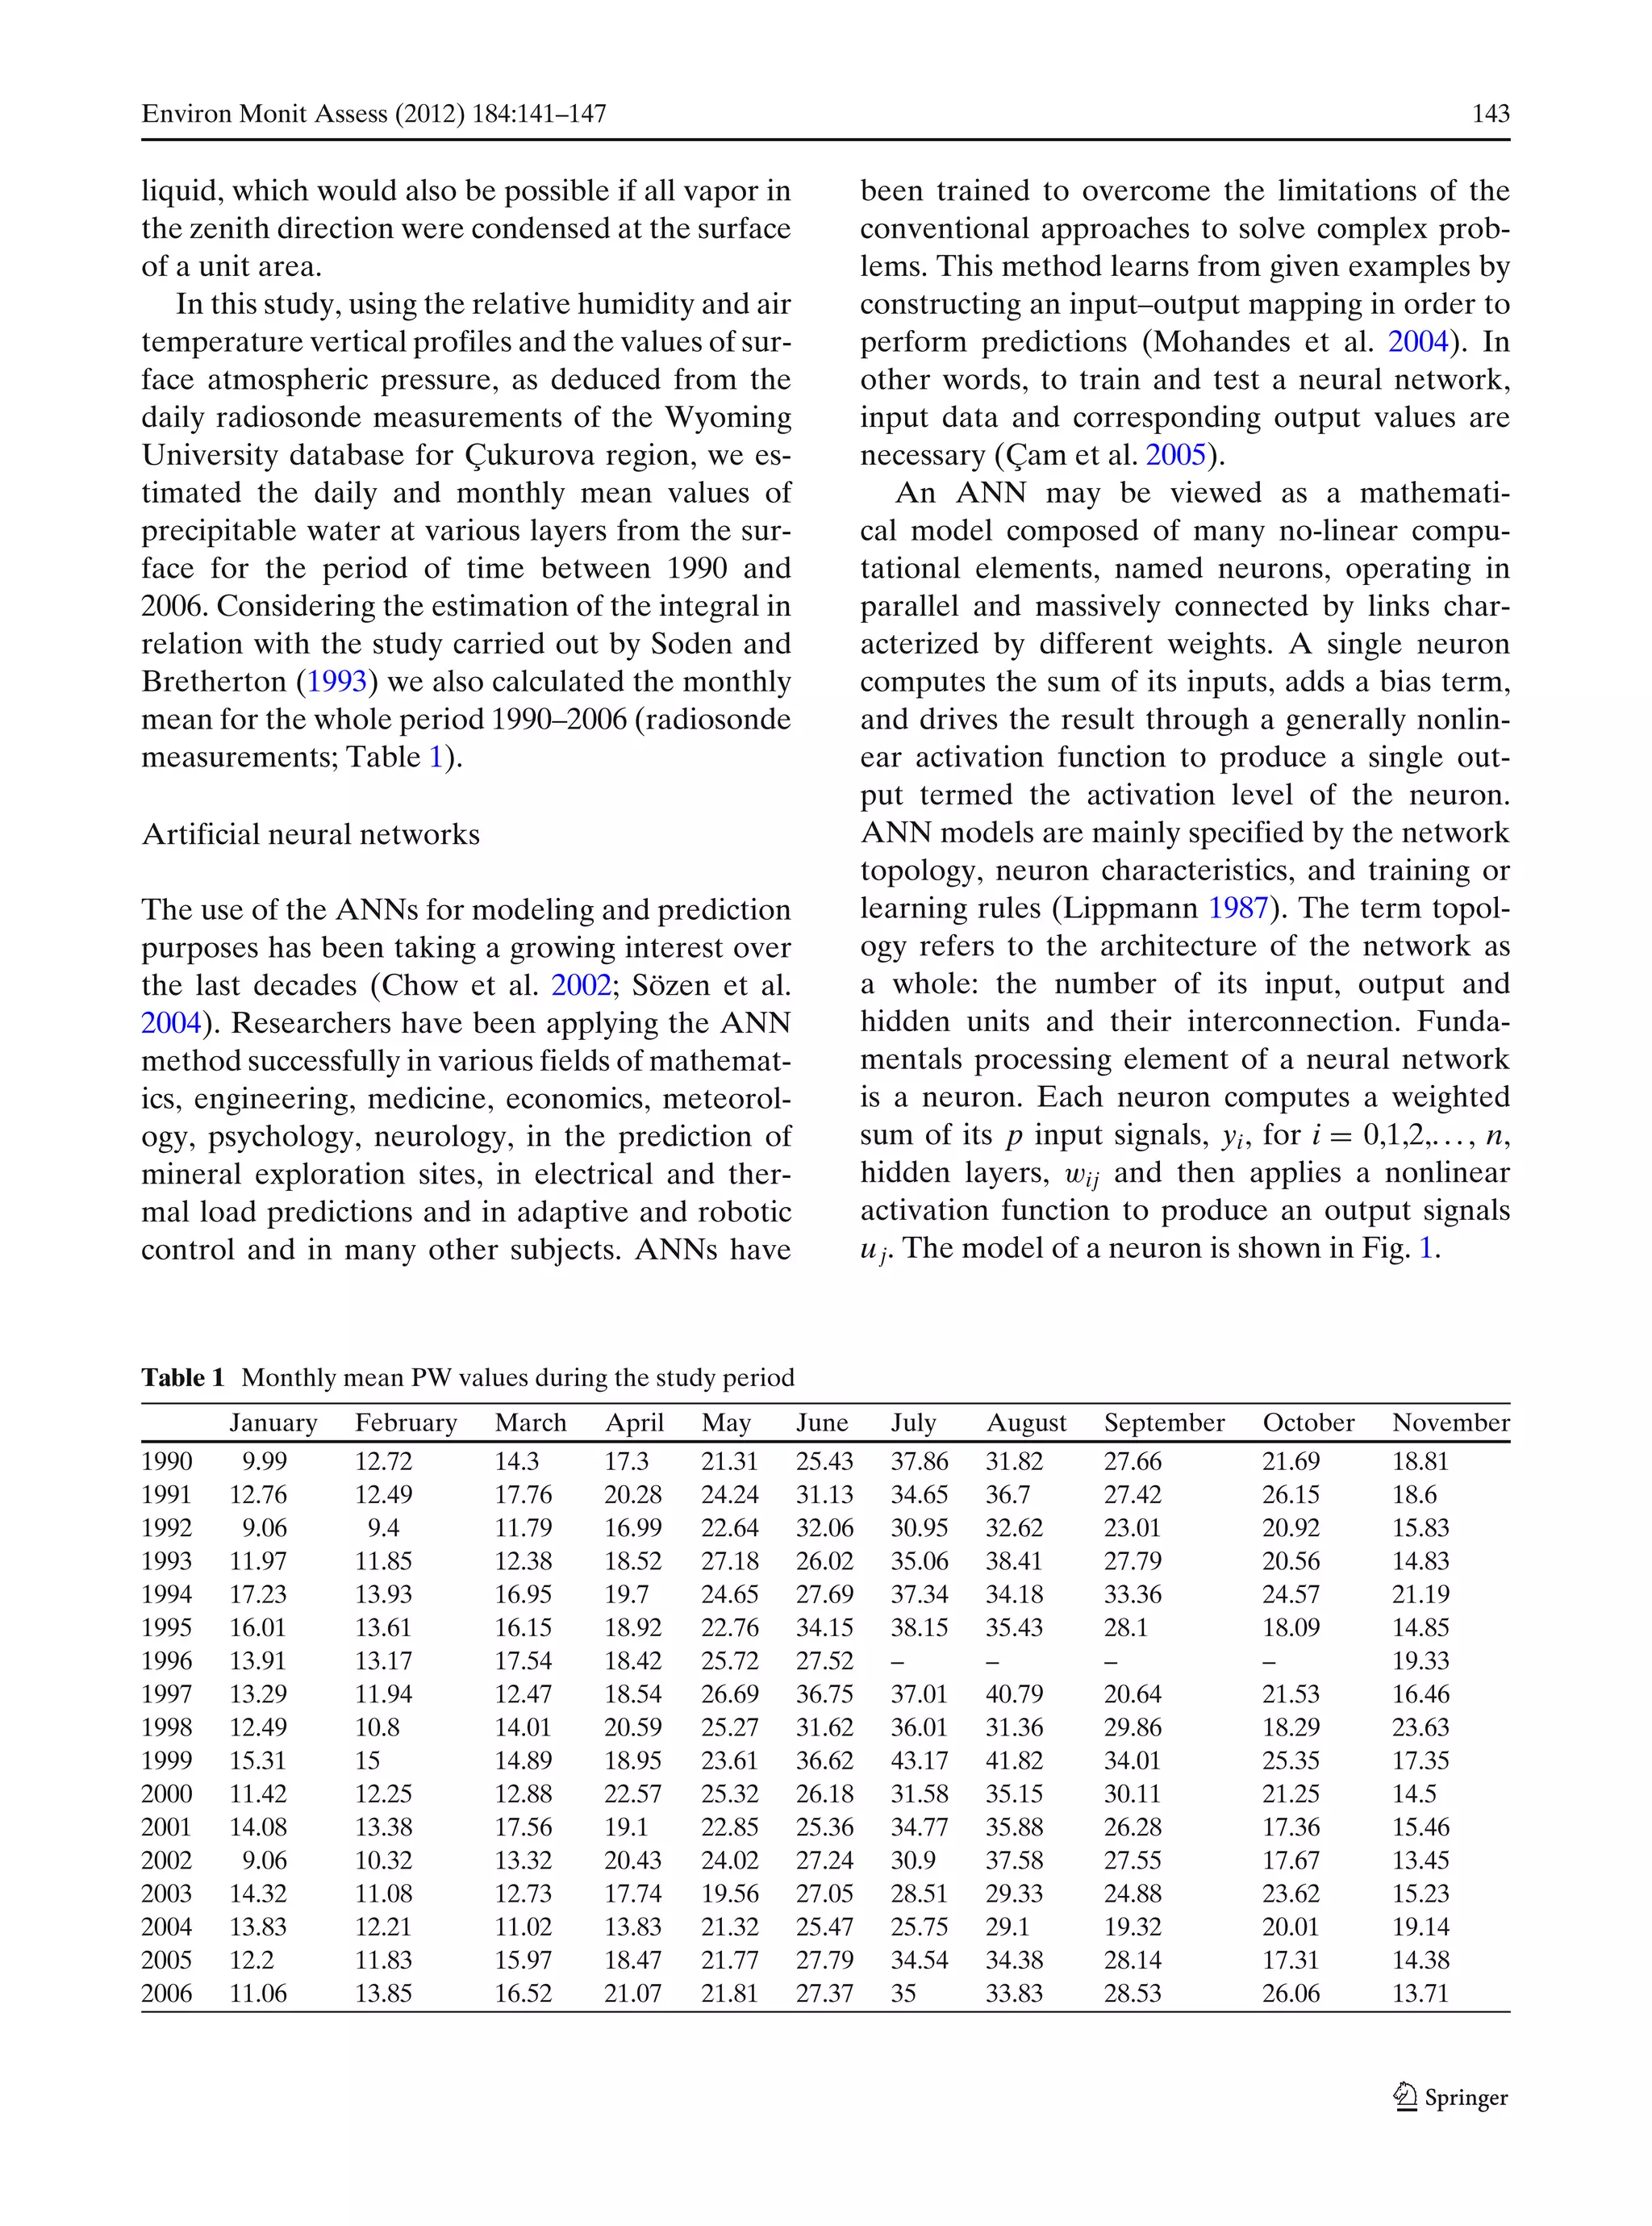
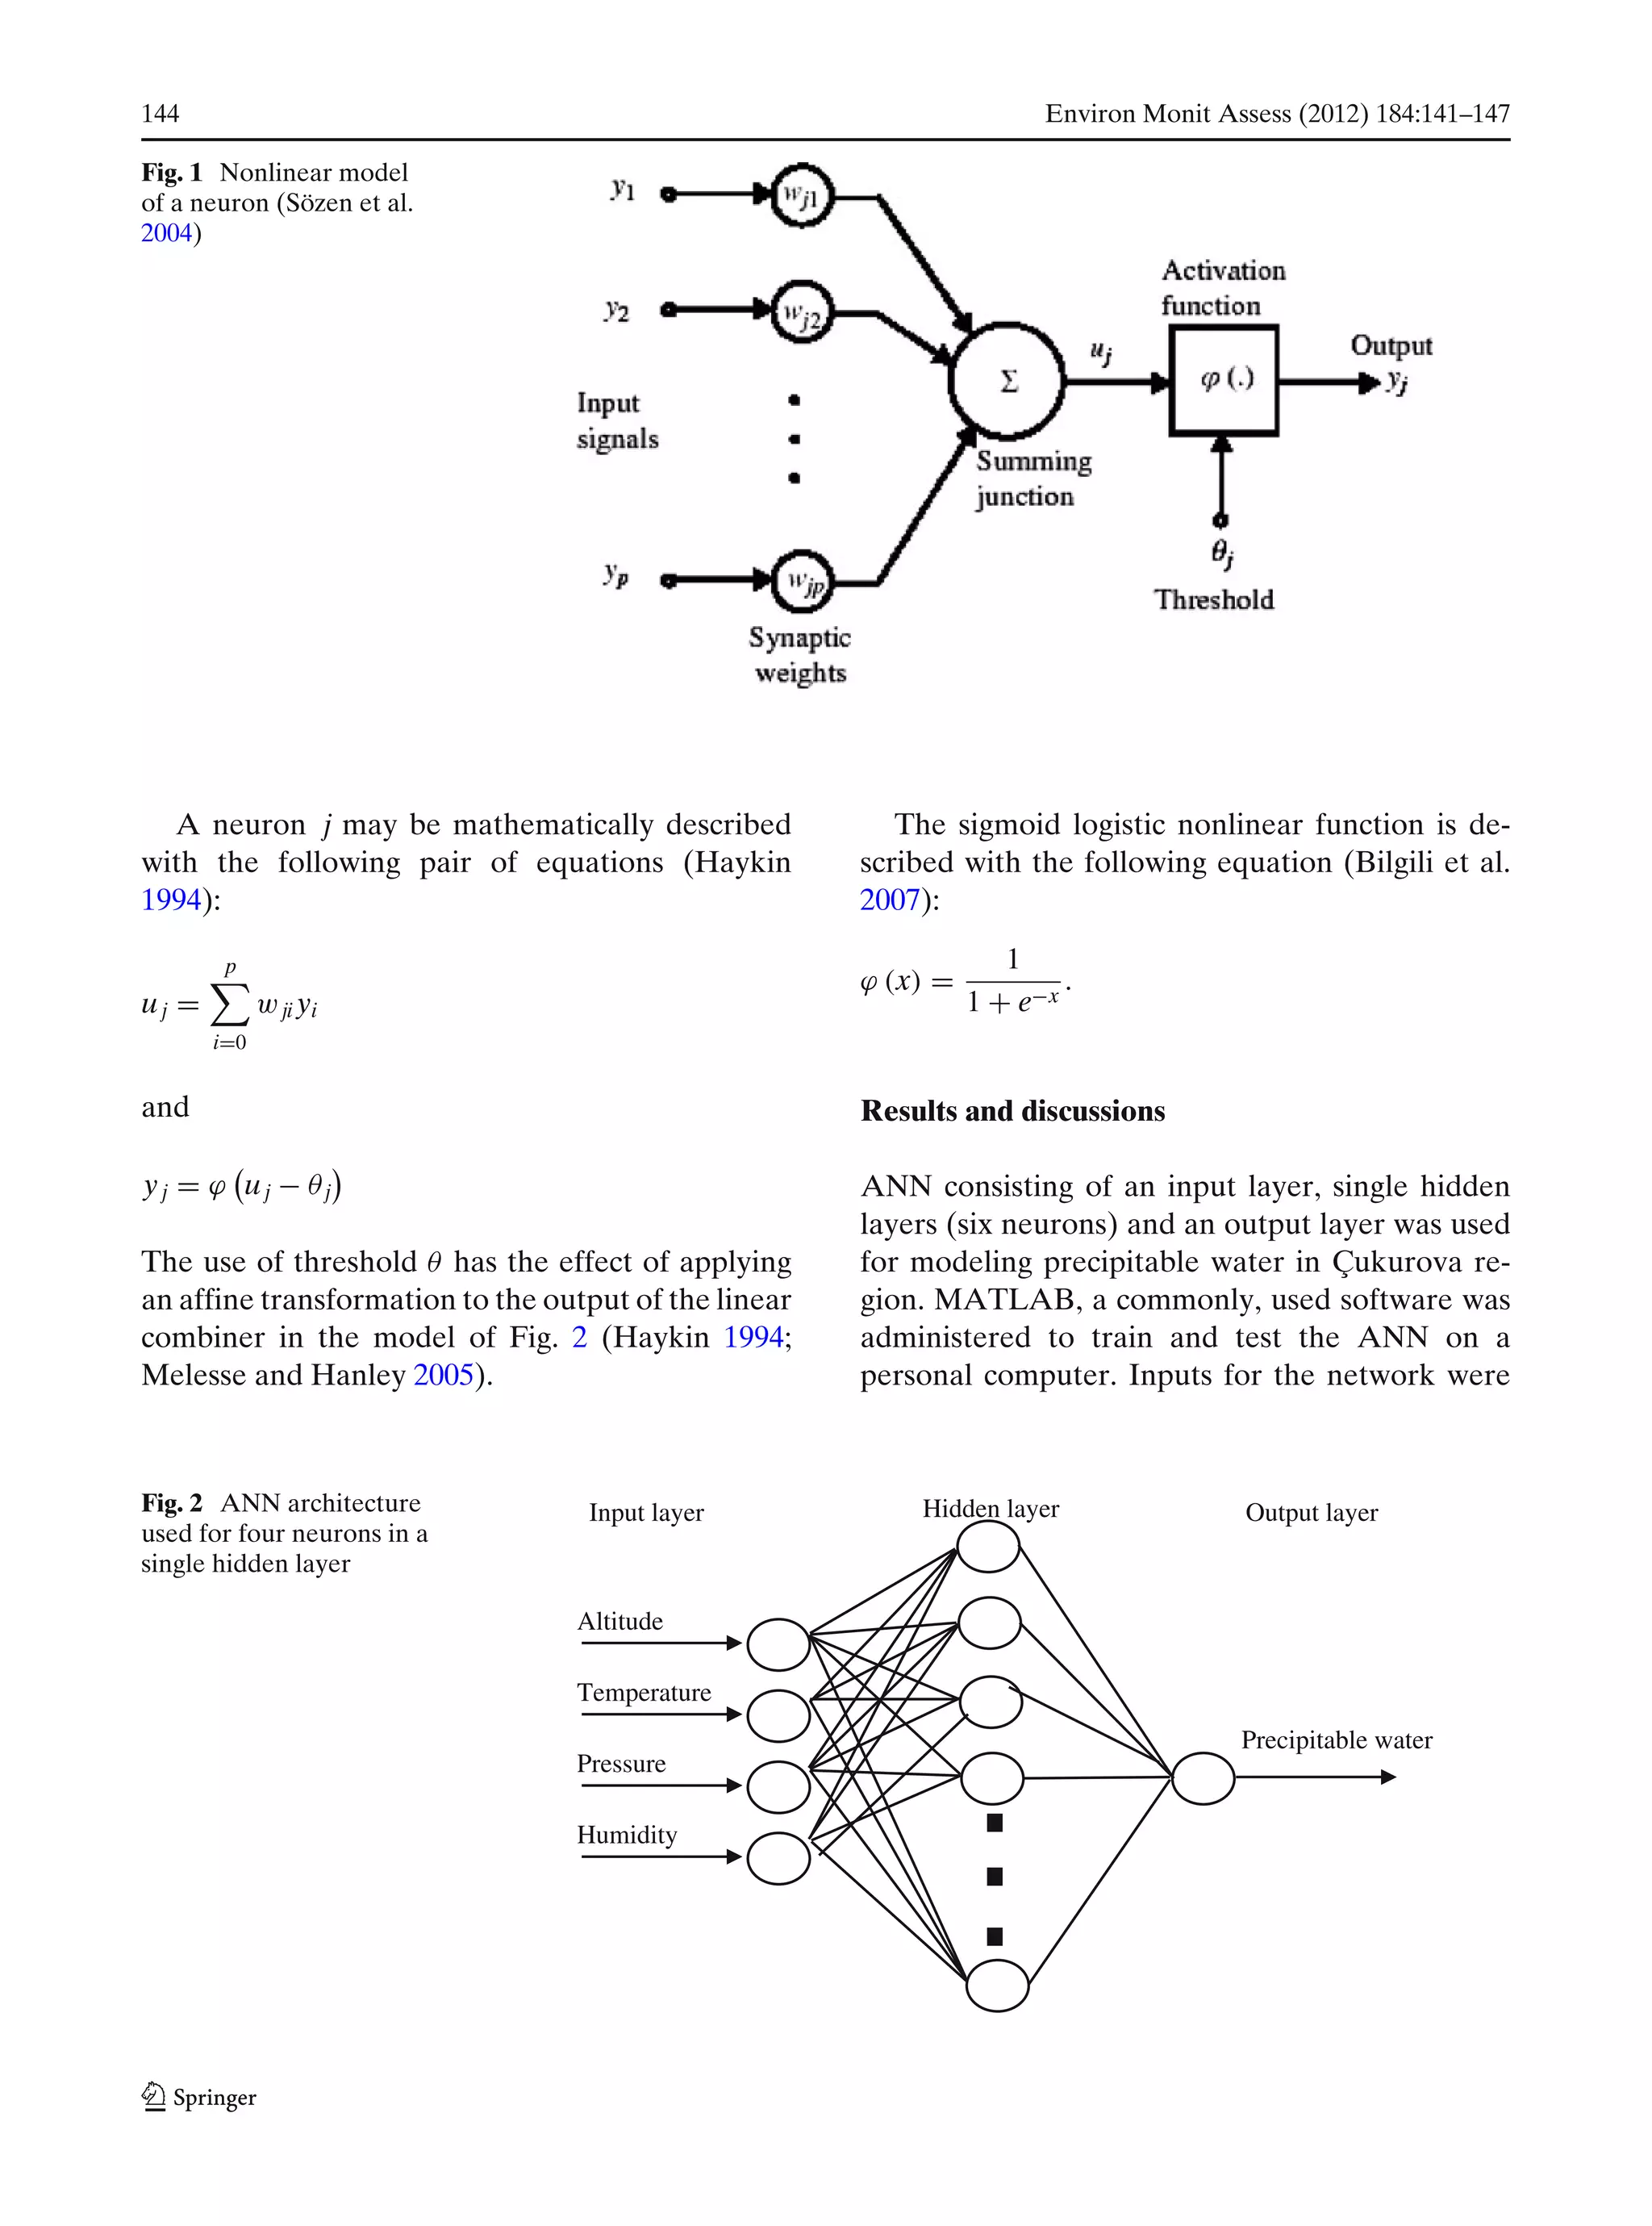
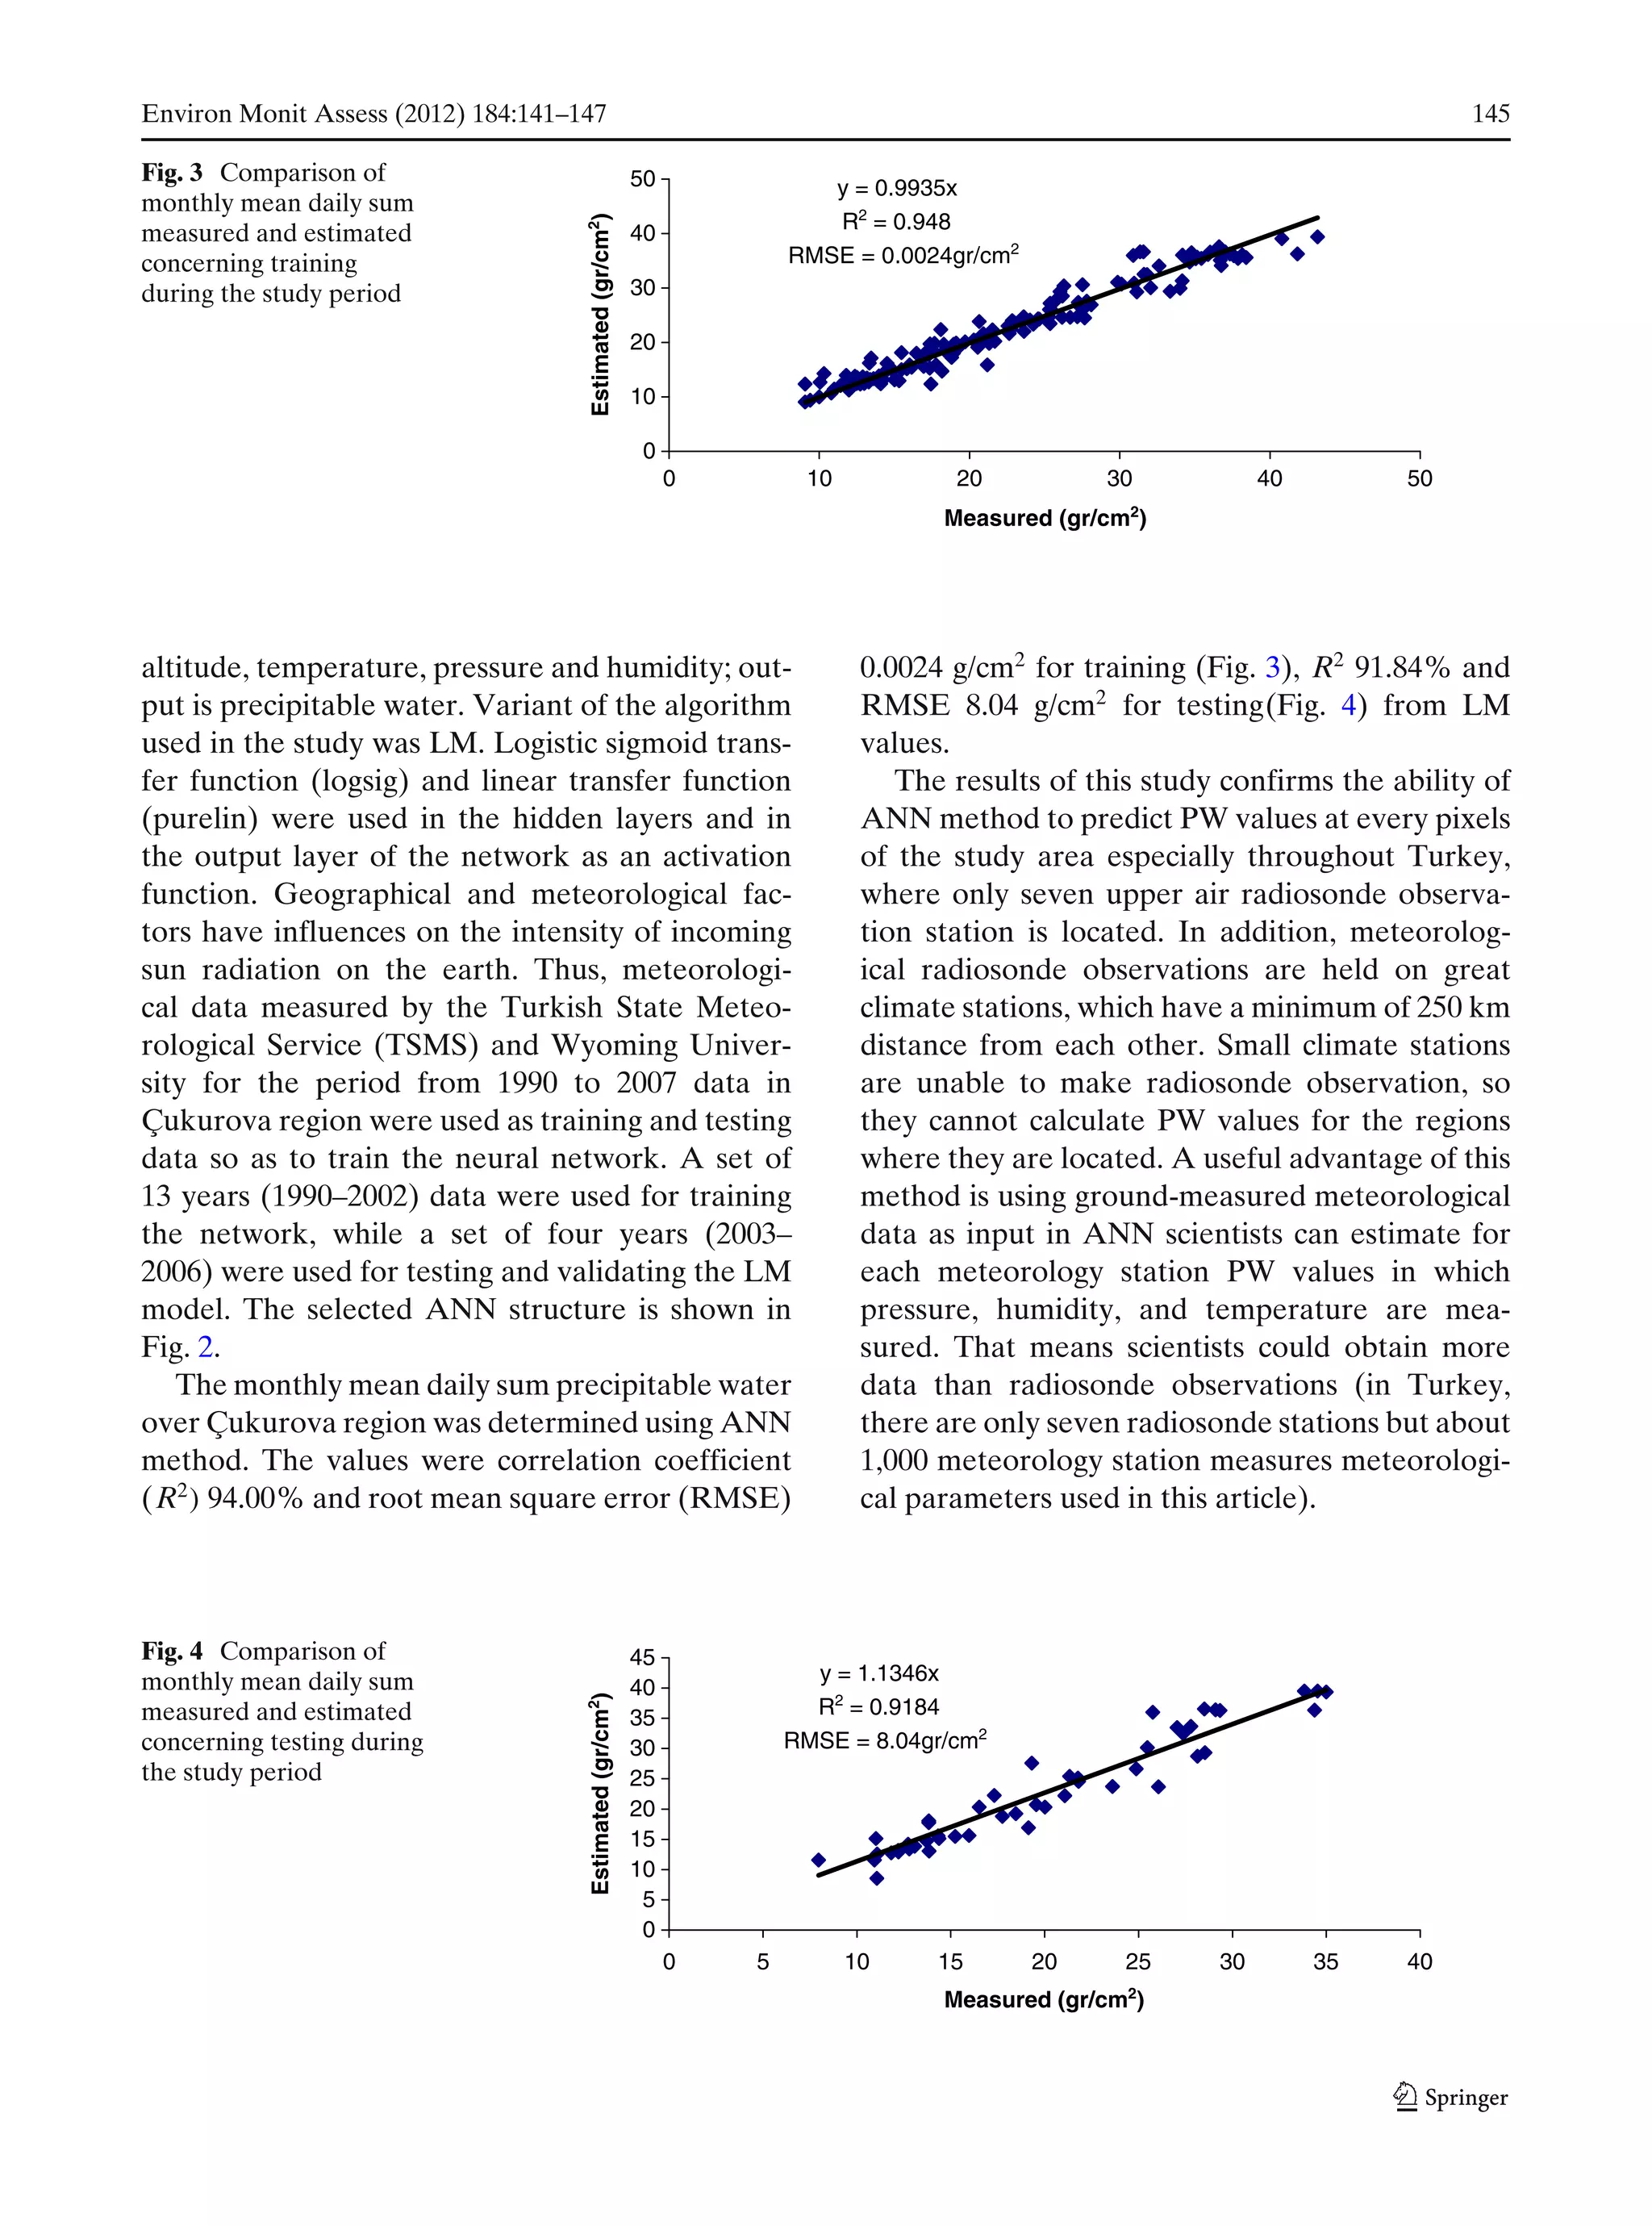
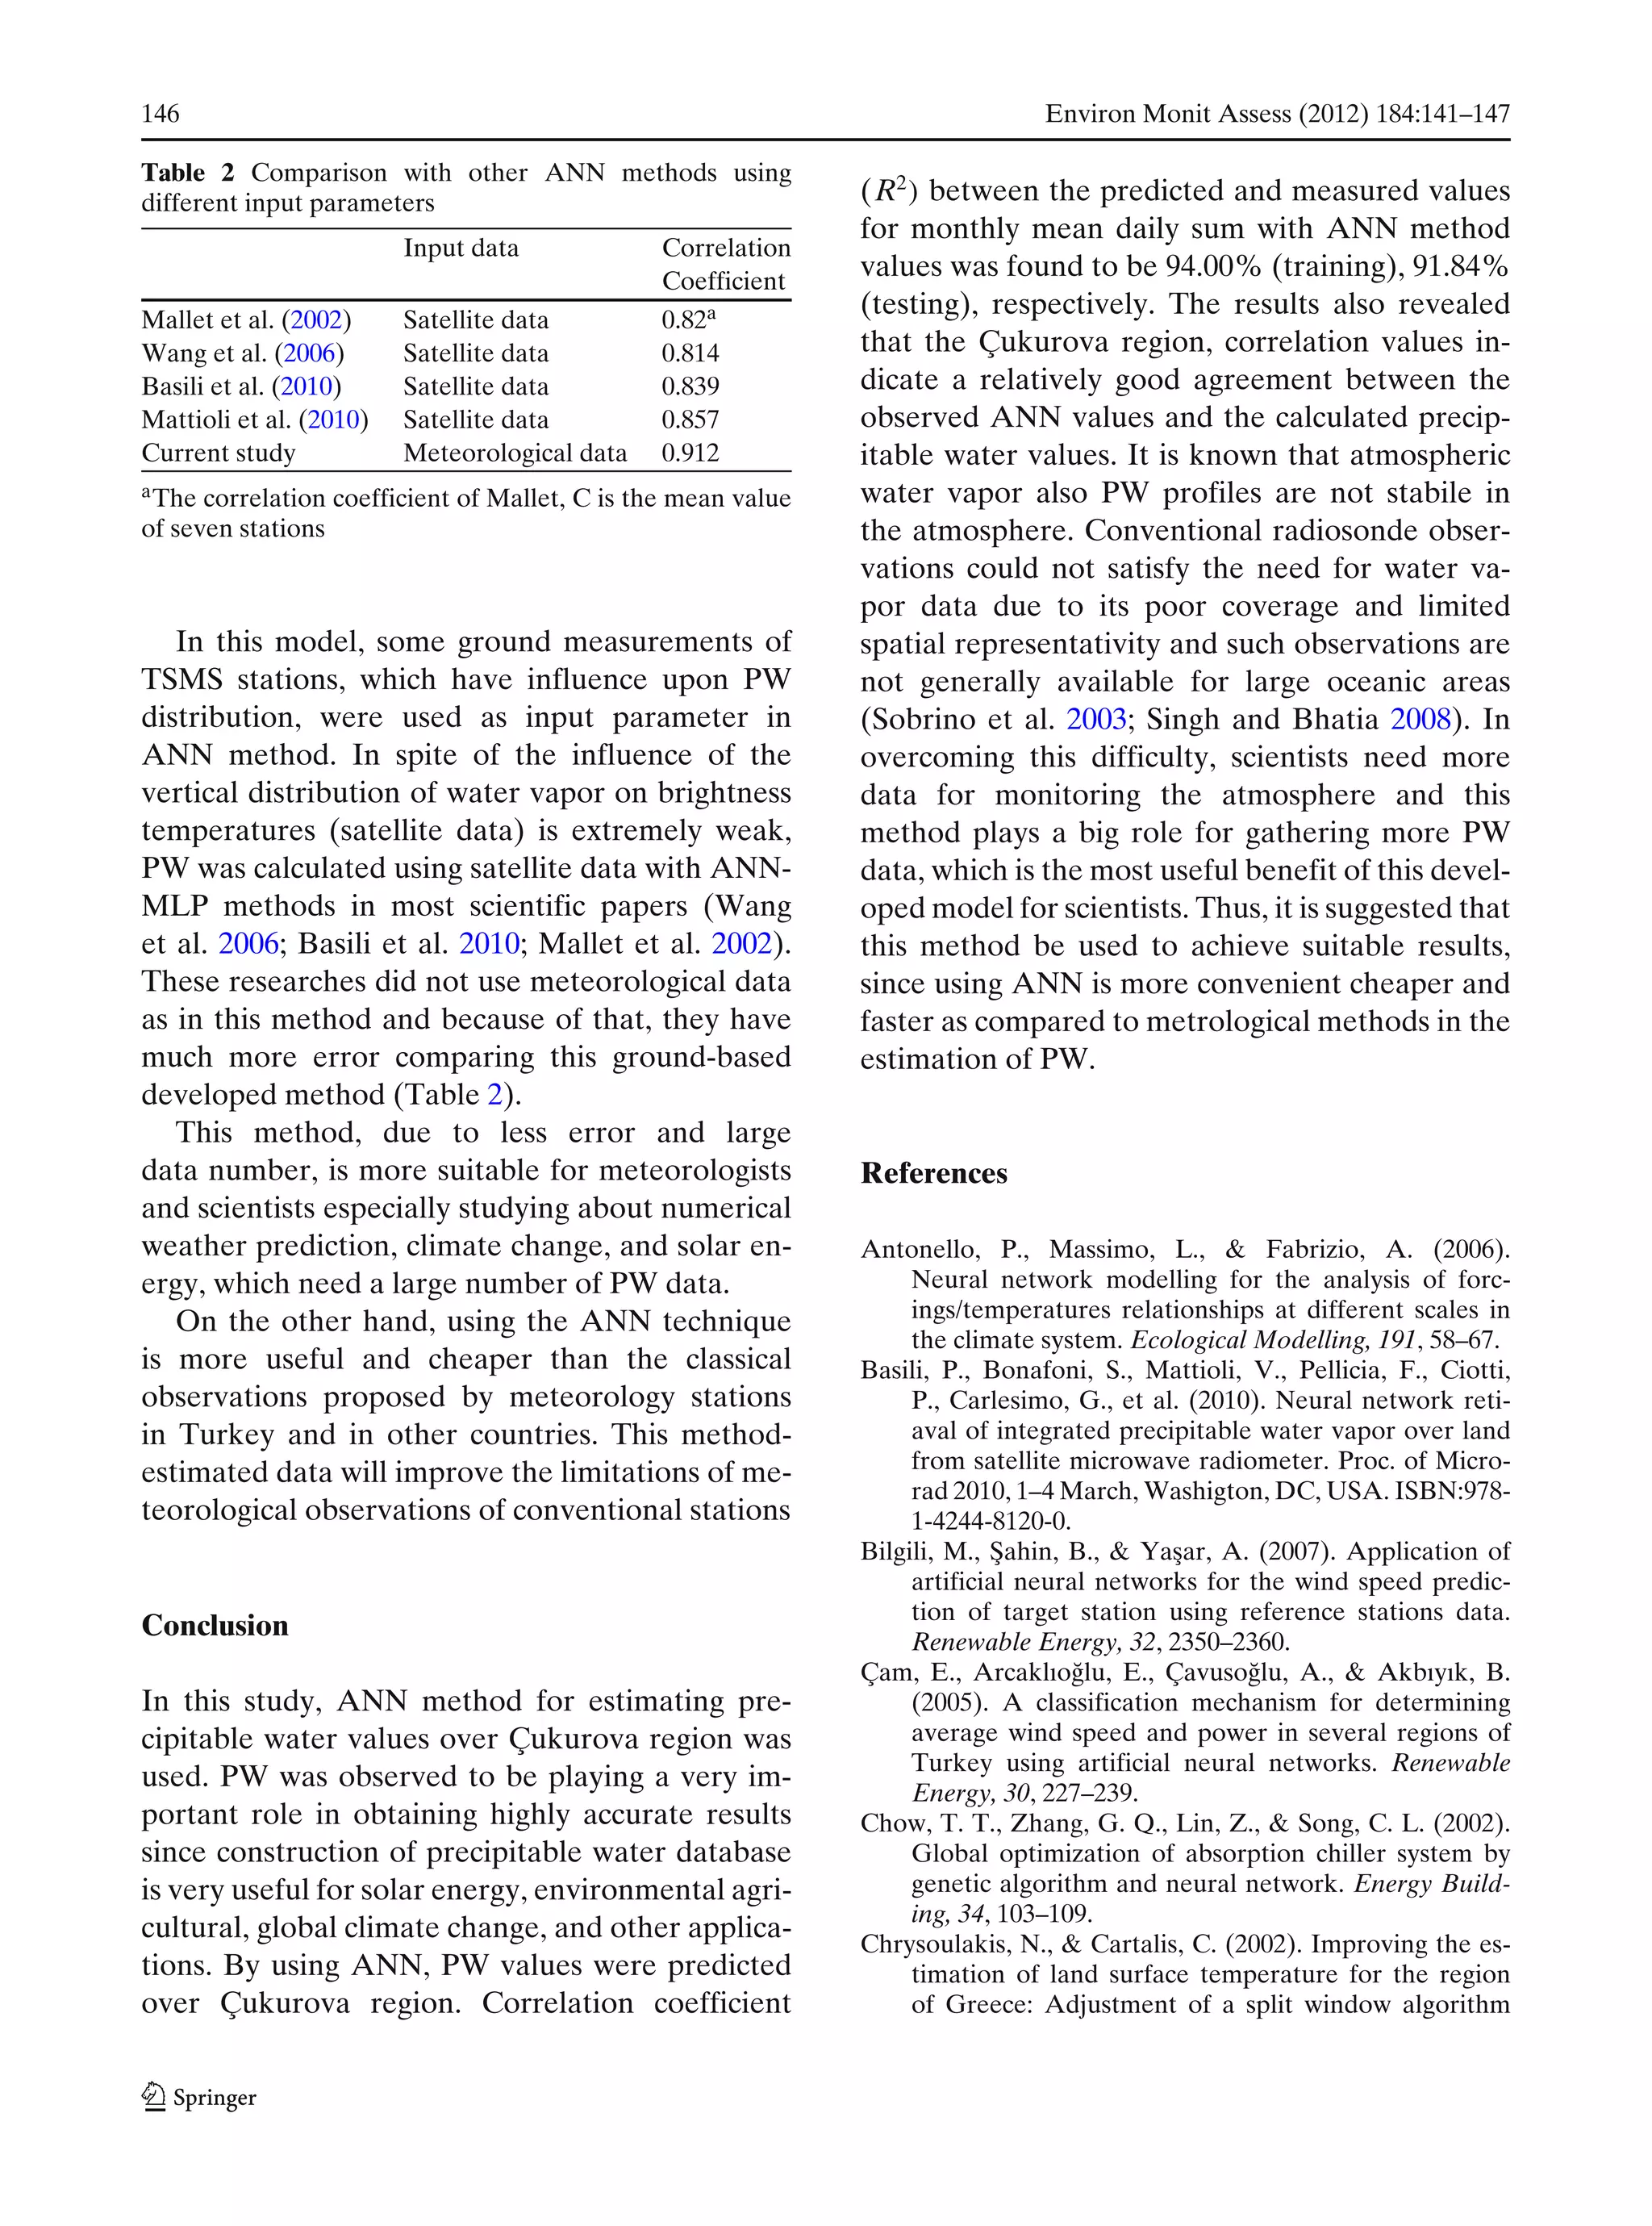
Environ Monit Assess (2012) 184:141–147
DOI 10.1007/s10661-011-1953-6
Precipitable water modelling using artificial neural
network in Çukurova region
Ozan ¸Senkal · B. Yi˘git Yıldız · Mehmet ¸Sahin ·
Vedat Pestemalcı
Received: 4 January 2010 / Accepted: 9 February 2011 / Published online: 5 March 2011
© Springer Science+Business Media B.V. 2011
Abstract Precipitable water (PW) is an important
atmospheric variable for climate system calcula-
tion. Local monthly mean PW values were mea-
sured by daily radiosonde observations for the
time period from 1990 to 2006. Artificial neural
network (ANN) method was applied for modeling
and prediction of mean precipitable water data in
Çukurova region, south of Turkey. We applied
Levenberg–Marquardt (LM) learning algorithm
and logistic sigmoid transfer function in the net-
work. In order to train our neural network we
used data of Adana station, which are assumed to
give a general idea about the precipitable water
of Çukurova region. Thus, meteorological and ge-
ographical data (altitude, temperature, pressure,
and humidity) were used in the input layer of
the network for Çukurova region. Precipitable
water was the output. Correlation coefficient (R2
)
between the predicted and measured values for
O. ¸Senkal (B) · B. Y. Yıldız
Karaisalı Vocational School, Çukurova University,
01770, Karaisalı, Adana, Turkey
e-mail: osenkal@cu.edu.tr
M. ¸Sahin
Siirt Vocational School, Siirt University, 56100,
Siirt, Turkey
V. Pestemalcı
Physics Department, Çukurova University, 01330,
Adana, Turkey
monthly mean daily sum with LM method val-
ues was found to be 94.00% (training), 91.84%
(testing), respectively. The findings revealed that
the ANN-based prediction technique for estimat-
ing PW values is as effective as meteorological
radiosonde observations. In addition, the results
suggest that ANN method values be used so as to
predict the precipitable water.
Keywords Precipitable water · Artificial neural
network · Meteorology · Çukurova region
Introduction
Water vapor is considered to be one of the most
significant atmospheric constituents as it con-
tributes substantially to the greenhouse effect, and
it is also a critical element of the climate sys-
tem (Chrysoulakis and Cartalis 2002). A meteo-
rological term, precipitable water (PW)—the total
atmospheric water vapor contained in a vertical
column of unit area from earth’s surface to top of
atmosphere—is an important variable in climate
system, hydrological system, or terrestrial ecosys-
tem. The major applications of PW are commonly
seen in quantative precipitation forecasting, de-
termination of moisture flow over an area, in
radiation balance studies and especially in global
climate change (Soden 2000). For instance, water
142 Environ Monit Assess (2012) 184:141–147
vapor is one of the greenhouse gasses that can lead
to global warming.
Water vapor influences the process of parti-
tioning incoming solar radiation into latent and
sensible heat fluxes, through its effect on stomatal
conductance and evapotranspiration, which then
turns into the Earth’s energy and water budgets.
In terrestrial ecosystem modeling, near-surface
water vapor is needed to calculate latent heat
flux since the water vapor within and just above
the vegetation canopy can limit photosynthesis
(Czajkowski 2002).
Ignoring clouds, the atmosphere is largely
transparent to the incoming solar flux, but mostly
opaque to outgoing thermal infrared radiation due
to the atmospheric water vapor and other gases,
that absorbs outgoing radiation in different wave-
lengths depending upon their spectral properties.
The absorbed radiation will be then emitted to the
ground causing global warming and to the space,
which are greenhouse gases causing global warm-
ing. More than half roughly 60% of the natural
greenhouse effect is due to water vapor (Taylor
2005).
PW has been mainly measured by radiosondes
(a radiosonde is a device that has been specially
designed to estimate atmospheric parameters of
pressure, temperature, relative humidity, wind di-
rection and speed) over land, but these instru-
ments offer limited opportunities for spatial and
continuous measurements of PW (Cuomo et al.
1997).
Specific neural network models have recently
been developed and applied to the particular
problems in atmospheric and climate sciences,
namely in boundary layer short range forecasting
(Pasini and Ameli 2003). An application of one
of these models in the valuation of the relative
importance of global physical–chemical forcing
and circulation patterns on the behavior of tem-
peratures at global and regional scales (Antonello
et al. 2006).
In precipitable water-based studies, basically
two methods, Iqbal (1983) and Levenberg–
Marquardt (LM) methods are used. In this
study, estimation of PW in Çukurova region was
grounded on meteorological and geographical
data (altitude, temperature, pressure, humidity).
LM learning algorithms and logistic sigmoid trans-
fer function are used in the network. Meteorologi-
cal and geographical data was used as input to the
network. PW was in the output layer. Comparison
of monthly mean daily sum was measured and
estimated during the study period for artificial
neural network (ANN) values. The findings of
this study indicate that the ANN-based prediction
technique is suitable for estimating PW values as
well as meteorological radiosonde observations.
Study area and data
The study area, Çukurova region, is located in
the south part of Turkey between longitudes
35◦
E–21◦
E and latitudes 36◦
N–59◦
N. Meteoro-
logical and geographical data (altitude, tempera-
ture, pressure and humidity) were constantly mea-
sured by the Turkish State Meteorological Service
(TSMS) for the period from 1990 to 2006.
We used the recorded data of Çukurova re-
gion in this study. The data included very high
humidity and temperature for summer, high hu-
midity and temperature for spring, high humidity
and temperature for autumn, but low humidity
and temperature for winter observed throughout a
year.
Method
Precipitable water
PW is the total amount of water vapor in a vertical
direction between the Earth’s surface (or a surface
in a given height) and the top of the atmosphere
(Chrysoulakis et al. 2001):
PW =
1
g
0
ps
Mrdp (1)
where, Mr is the mixing ratio, g is the acceleration
of gravity over the examined area, P is the pres-
sure at a given altitude, and ps is the pressure on
the surface of the earth (Iqbal 1983). The above
relation show that PW has dimensions mass per
surface (g/cm2
). Thus, PW, which can also be mea-
sured in cm, is described as the thickness of the
Environ Monit Assess (2012) 184:141–147 143
liquid, which would also be possible if all vapor in
the zenith direction were condensed at the surface
of a unit area.
In this study, using the relative humidity and air
temperature vertical profiles and the values of sur-
face atmospheric pressure, as deduced from the
daily radiosonde measurements of the Wyoming
University database for Çukurova region, we es-
timated the daily and monthly mean values of
precipitable water at various layers from the sur-
face for the period of time between 1990 and
2006. Considering the estimation of the integral in
relation with the study carried out by Soden and
Bretherton (1993) we also calculated the monthly
mean for the whole period 1990–2006 (radiosonde
measurements; Table 1).
Artificial neural networks
The use of the ANNs for modeling and prediction
purposes has been taking a growing interest over
the last decades (Chow et al. 2002; Sözen et al.
2004). Researchers have been applying the ANN
method successfully in various fields of mathemat-
ics, engineering, medicine, economics, meteorol-
ogy, psychology, neurology, in the prediction of
mineral exploration sites, in electrical and ther-
mal load predictions and in adaptive and robotic
control and in many other subjects. ANNs have
been trained to overcome the limitations of the
conventional approaches to solve complex prob-
lems. This method learns from given examples by
constructing an input–output mapping in order to
perform predictions (Mohandes et al. 2004). In
other words, to train and test a neural network,
input data and corresponding output values are
necessary (Çam et al. 2005).
An ANN may be viewed as a mathemati-
cal model composed of many no-linear compu-
tational elements, named neurons, operating in
parallel and massively connected by links char-
acterized by different weights. A single neuron
computes the sum of its inputs, adds a bias term,
and drives the result through a generally nonlin-
ear activation function to produce a single out-
put termed the activation level of the neuron.
ANN models are mainly specified by the network
topology, neuron characteristics, and training or
learning rules (Lippmann 1987). The term topol-
ogy refers to the architecture of the network as
a whole: the number of its input, output and
hidden units and their interconnection. Funda-
mentals processing element of a neural network
is a neuron. Each neuron computes a weighted
sum of its p input signals, yi, for i = 0,1,2,. . . , n,
hidden layers, wij and then applies a nonlinear
activation function to produce an output signals
uj. The model of a neuron is shown in Fig. 1.
Table 1 Monthly mean PW values during the study period
January February March April May June July August September October November
1990 9.99 12.72 14.3 17.3 21.31 25.43 37.86 31.82 27.66 21.69 18.81
1991 12.76 12.49 17.76 20.28 24.24 31.13 34.65 36.7 27.42 26.15 18.6
1992 9.06 9.4 11.79 16.99 22.64 32.06 30.95 32.62 23.01 20.92 15.83
1993 11.97 11.85 12.38 18.52 27.18 26.02 35.06 38.41 27.79 20.56 14.83
1994 17.23 13.93 16.95 19.7 24.65 27.69 37.34 34.18 33.36 24.57 21.19
1995 16.01 13.61 16.15 18.92 22.76 34.15 38.15 35.43 28.1 18.09 14.85
1996 13.91 13.17 17.54 18.42 25.72 27.52 – – – – 19.33
1997 13.29 11.94 12.47 18.54 26.69 36.75 37.01 40.79 20.64 21.53 16.46
1998 12.49 10.8 14.01 20.59 25.27 31.62 36.01 31.36 29.86 18.29 23.63
1999 15.31 15 14.89 18.95 23.61 36.62 43.17 41.82 34.01 25.35 17.35
2000 11.42 12.25 12.88 22.57 25.32 26.18 31.58 35.15 30.11 21.25 14.5
2001 14.08 13.38 17.56 19.1 22.85 25.36 34.77 35.88 26.28 17.36 15.46
2002 9.06 10.32 13.32 20.43 24.02 27.24 30.9 37.58 27.55 17.67 13.45
2003 14.32 11.08 12.73 17.74 19.56 27.05 28.51 29.33 24.88 23.62 15.23
2004 13.83 12.21 11.02 13.83 21.32 25.47 25.75 29.1 19.32 20.01 19.14
2005 12.2 11.83 15.97 18.47 21.77 27.79 34.54 34.38 28.14 17.31 14.38
2006 11.06 13.85 16.52 21.07 21.81 27.37 35 33.83 28.53 26.06 13.71
144 Environ Monit Assess (2012) 184:141–147
Fig. 1 Nonlinear model
of a neuron (Sözen et al.
2004)
A neuron j may be mathematically described
with the following pair of equations (Haykin
1994):
uj =
p
i=0
wji yi
and
yj = ϕ uj − θj
The use of threshold θ has the effect of applying
an affine transformation to the output of the linear
combiner in the model of Fig. 2 (Haykin 1994;
Melesse and Hanley 2005).
The sigmoid logistic nonlinear function is de-
scribed with the following equation (Bilgili et al.
2007):
ϕ (x) =
1
1 + e−x
.
Results and discussions
ANN consisting of an input layer, single hidden
layers (six neurons) and an output layer was used
for modeling precipitable water in Çukurova re-
gion. MATLAB, a commonly, used software was
administered to train and test the ANN on a
personal computer. Inputs for the network were
Fig. 2 ANN architecture
used for four neurons in a
single hidden layer
Precipitable water
Hidden layer Output layerInput layer
Altitude
Temperature
Pressure
Humidity
Environ Monit Assess (2012) 184:141–147 145
Fig. 3 Comparison of
monthly mean daily sum
measured and estimated
concerning training
during the study period
y = 0.9935x
R2
= 0.948
RMSE = 0.0024gr/cm2
0
10
20
30
40
50
0 10 20 30 40 50
Measured (gr/cm2
)
Estimated(gr/cm2
)
altitude, temperature, pressure and humidity; out-
put is precipitable water. Variant of the algorithm
used in the study was LM. Logistic sigmoid trans-
fer function (logsig) and linear transfer function
(purelin) were used in the hidden layers and in
the output layer of the network as an activation
function. Geographical and meteorological fac-
tors have influences on the intensity of incoming
sun radiation on the earth. Thus, meteorologi-
cal data measured by the Turkish State Meteo-
rological Service (TSMS) and Wyoming Univer-
sity for the period from 1990 to 2007 data in
Çukurova region were used as training and testing
data so as to train the neural network. A set of
13 years (1990–2002) data were used for training
the network, while a set of four years (2003–
2006) were used for testing and validating the LM
model. The selected ANN structure is shown in
Fig. 2.
The monthly mean daily sum precipitable water
over Çukurova region was determined using ANN
method. The values were correlation coefficient
(R2
) 94.00% and root mean square error (RMSE)
0.0024 g/cm2
for training (Fig. 3), R2
91.84% and
RMSE 8.04 g/cm2
for testing(Fig. 4) from LM
values.
The results of this study confirms the ability of
ANN method to predict PW values at every pixels
of the study area especially throughout Turkey,
where only seven upper air radiosonde observa-
tion station is located. In addition, meteorolog-
ical radiosonde observations are held on great
climate stations, which have a minimum of 250 km
distance from each other. Small climate stations
are unable to make radiosonde observation, so
they cannot calculate PW values for the regions
where they are located. A useful advantage of this
method is using ground-measured meteorological
data as input in ANN scientists can estimate for
each meteorology station PW values in which
pressure, humidity, and temperature are mea-
sured. That means scientists could obtain more
data than radiosonde observations (in Turkey,
there are only seven radiosonde stations but about
1,000 meteorology station measures meteorologi-
cal parameters used in this article).
Fig. 4 Comparison of
monthly mean daily sum
measured and estimated
concerning testing during
the study period
y = 1.1346x
R2
= 0.9184
RMSE = 8.04gr/cm2
0
5
10
15
20
25
30
35
40
45
0 5 10 15 20 25 30 35 40
Measured (gr/cm2
)
Estimated(gr/cm2
)
146 Environ Monit Assess (2012) 184:141–147
Table 2 Comparison with other ANN methods using
different input parameters
Input data Correlation
Coefficient
Mallet et al. (2002) Satellite data 0.82a
Wang et al. (2006) Satellite data 0.814
Basili et al. (2010) Satellite data 0.839
Mattioli et al. (2010) Satellite data 0.857
Current study Meteorological data 0.912
aThe correlation coefficient of Mallet, C is the mean value
of seven stations
In this model, some ground measurements of
TSMS stations, which have influence upon PW
distribution, were used as input parameter in
ANN method. In spite of the influence of the
vertical distribution of water vapor on brightness
temperatures (satellite data) is extremely weak,
PW was calculated using satellite data with ANN-
MLP methods in most scientific papers (Wang
et al. 2006; Basili et al. 2010; Mallet et al. 2002).
These researches did not use meteorological data
as in this method and because of that, they have
much more error comparing this ground-based
developed method (Table 2).
This method, due to less error and large
data number, is more suitable for meteorologists
and scientists especially studying about numerical
weather prediction, climate change, and solar en-
ergy, which need a large number of PW data.
On the other hand, using the ANN technique
is more useful and cheaper than the classical
observations proposed by meteorology stations
in Turkey and in other countries. This method-
estimated data will improve the limitations of me-
teorological observations of conventional stations
Conclusion
In this study, ANN method for estimating pre-
cipitable water values over Çukurova region was
used. PW was observed to be playing a very im-
portant role in obtaining highly accurate results
since construction of precipitable water database
is very useful for solar energy, environmental agri-
cultural, global climate change, and other applica-
tions. By using ANN, PW values were predicted
over Çukurova region. Correlation coefficient
(R2
) between the predicted and measured values
for monthly mean daily sum with ANN method
values was found to be 94.00% (training), 91.84%
(testing), respectively. The results also revealed
that the Çukurova region, correlation values in-
dicate a relatively good agreement between the
observed ANN values and the calculated precip-
itable water values. It is known that atmospheric
water vapor also PW profiles are not stabile in
the atmosphere. Conventional radiosonde obser-
vations could not satisfy the need for water va-
por data due to its poor coverage and limited
spatial representativity and such observations are
not generally available for large oceanic areas
(Sobrino et al. 2003; Singh and Bhatia 2008). In
overcoming this difficulty, scientists need more
data for monitoring the atmosphere and this
method plays a big role for gathering more PW
data, which is the most useful benefit of this devel-
oped model for scientists. Thus, it is suggested that
this method be used to achieve suitable results,
since using ANN is more convenient cheaper and
faster as compared to metrological methods in the
estimation of PW.
References
Antonello, P., Massimo, L., & Fabrizio, A. (2006).
Neural network modelling for the analysis of forc-
ings/temperatures relationships at different scales in
the climate system. Ecological Modelling, 191, 58–67.
Basili, P., Bonafoni, S., Mattioli, V., Pellicia, F., Ciotti,
P., Carlesimo, G., et al. (2010). Neural network reti-
aval of integrated precipitable water vapor over land
from satellite microwave radiometer. Proc. of Micro-
rad 2010, 1–4 March, Washigton, DC, USA. ISBN:978-
1-4244-8120-0.
Bilgili, M., ¸Sahin, B., & Ya¸sar, A. (2007). Application of
artificial neural networks for the wind speed predic-
tion of target station using reference stations data.
Renewable Energy, 32, 2350–2360.
Çam, E., Arcaklıo˘glu, E., Çavuso˘glu, A., & Akbıyık, B.
(2005). A classification mechanism for determining
average wind speed and power in several regions of
Turkey using artificial neural networks. Renewable
Energy, 30, 227–239.
Chow, T. T., Zhang, G. Q., Lin, Z., & Song, C. L. (2002).
Global optimization of absorption chiller system by
genetic algorithm and neural network. Energy Build-
ing, 34, 103–109.
Chrysoulakis, N., & Cartalis, C. (2002). Improving the es-
timation of land surface temperature for the region
of Greece: Adjustment of a split window algorithm
Environ Monit Assess (2012) 184:141–147 147
to account for the distribution of precipitable water.
International Journal of Remote Sensing, 23, 871–880.
Chrysoulakis, N., Proedrou, M., & Cartalis, C. (2001).
Variations and trends in annual and seasonal means
of precipitable water in Greece as deduced from ra-
diosonde measurements. Toxicological and Environ-
mental Chemistry, 84, 1–6.
Cuomo, V., Tramutoli, V., Pergola, N., Pietrapertosa, C.,
& Romano, F. (1997). In place merging of satellite
based atmospheric water vapour measurements. In-
ternational Journal of Remote Sensing, 18(17), 3649–
3668.
Czajkowski, K. P. (2002). Thermal remote sensing of near-
surface water vapor. Remote Sensing of Environment,
79, 253–265.
Haykin, S. (1994). Neural networks, a comprehensive foun-
dation. New Jersey: Prentice-Hall.
Iqbal, M. (1983). An Introduction to Solar Radiation.
Torondo: Academic.
Lippmann, R. P. (1987). An introduction to computing
with neural nets. IEEE ASSP Magazine, 4, 4–22.
Mallet, C., Moreau, E., Casagrande, L., & Klapisz, C.
(2002). Determination of integrated cloud liquid water
path and total precipitable water from SSM/I data us-
ing a neural network algorithm. International Journal
of Remote Sensing, 23(4), 661–674.
Mattioli, V., Bonafoni, S., Basili, P., Carlesimo, G., Ciotti,
P., Pulvirenti, L., & Pierdicca, N. (2010). Neural net-
work for the satellite retrieval of precipitable water
vapor over land. Geoscience and Remote Sensing
Symposium (IGARSS), 2010 Honolulu, HI, p. 2960–
2963. doi:10.1109/IGARSS.2010.5650528.
Melesse, A. M., & Hanley, R. S. (2005). Artificial neural
network application for multiecosystem carbon flux
simulation. Ecological Modelling, 189, 305–314.
Mohandes, M. A., Halawani, T. O., Rehman, S., & Hussain,
A. A. (2004). Support vector machines for wind speed
prediction. Renewable Energy, 29, 939–947.
Pasini, A., & Ameli, F. (2003). Radon short range forecast-
ing through time series preprocessing and neural net-
work modelling. Geophysical Research Letters, 30(7),
1386. doi:10.1029/2002GL016726.
Singh, D., & Bhatia, R. C. (2008). Development of
a neural network algorithm for the retrieval of
TPW from NOAA16 AMSU measurements. Inter-
national Journal of Remote Sensing, 29(14), 4045–
4060.
Sobrino, J. A., El Karraz, J., & Lı, Z.-L. (2003). Surface
temperature and water vapour retrieval from MODIS
data. International Journal of Remote Sensing, 24,
4045–4060.
Soden, B. J. (2000). Atmospheric physics: enlightening wa-
ter vapor. Nature, 406, 5161–5182.
Soden, B. J., & Bretherton, F. P. (1993). Upper tro-
posphere relative humidity from the GOES 6.7 um
Channel: Method and climatology for July 1987.
Journal of Geophysical Research, 98(D9), 16669–
16688.
Sözen, A., Arcaklıo˘glu, E., & Özalp, M. (2004). Perfor-
mance analysis of ejector absorption heat pump using
ozone safe fluid couple through artificial neural net-
works. Energy Conversion and Management, 45, 2233–
2253.
Taylor, F. W. (2005). Elementary climate physics. New
York: Oxford University Press.
Wang, W., Sun, X., Zhang, R., Li, Z., Zhu, Z., & Su, H.
(2006). Multi-layer perceptron neural network based
algorithm for estimating precipitable water vapour
from MODIS NIR data. International Journal of Re-
mote Sensing, 23(3), 617–621.

Precipitable water modelling using artificial neural

  • 1.
    Environ Monit Assess(2012) 184:141–147 DOI 10.1007/s10661-011-1953-6 Precipitable water modelling using artificial neural network in Çukurova region Ozan ¸Senkal · B. Yi˘git Yıldız · Mehmet ¸Sahin · Vedat Pestemalcı Received: 4 January 2010 / Accepted: 9 February 2011 / Published online: 5 March 2011 © Springer Science+Business Media B.V. 2011 Abstract Precipitable water (PW) is an important atmospheric variable for climate system calcula- tion. Local monthly mean PW values were mea- sured by daily radiosonde observations for the time period from 1990 to 2006. Artificial neural network (ANN) method was applied for modeling and prediction of mean precipitable water data in Çukurova region, south of Turkey. We applied Levenberg–Marquardt (LM) learning algorithm and logistic sigmoid transfer function in the net- work. In order to train our neural network we used data of Adana station, which are assumed to give a general idea about the precipitable water of Çukurova region. Thus, meteorological and ge- ographical data (altitude, temperature, pressure, and humidity) were used in the input layer of the network for Çukurova region. Precipitable water was the output. Correlation coefficient (R2 ) between the predicted and measured values for O. ¸Senkal (B) · B. Y. Yıldız Karaisalı Vocational School, Çukurova University, 01770, Karaisalı, Adana, Turkey e-mail: osenkal@cu.edu.tr M. ¸Sahin Siirt Vocational School, Siirt University, 56100, Siirt, Turkey V. Pestemalcı Physics Department, Çukurova University, 01330, Adana, Turkey monthly mean daily sum with LM method val- ues was found to be 94.00% (training), 91.84% (testing), respectively. The findings revealed that the ANN-based prediction technique for estimat- ing PW values is as effective as meteorological radiosonde observations. In addition, the results suggest that ANN method values be used so as to predict the precipitable water. Keywords Precipitable water · Artificial neural network · Meteorology · Çukurova region Introduction Water vapor is considered to be one of the most significant atmospheric constituents as it con- tributes substantially to the greenhouse effect, and it is also a critical element of the climate sys- tem (Chrysoulakis and Cartalis 2002). A meteo- rological term, precipitable water (PW)—the total atmospheric water vapor contained in a vertical column of unit area from earth’s surface to top of atmosphere—is an important variable in climate system, hydrological system, or terrestrial ecosys- tem. The major applications of PW are commonly seen in quantative precipitation forecasting, de- termination of moisture flow over an area, in radiation balance studies and especially in global climate change (Soden 2000). For instance, water
  • 2.
    142 Environ MonitAssess (2012) 184:141–147 vapor is one of the greenhouse gasses that can lead to global warming. Water vapor influences the process of parti- tioning incoming solar radiation into latent and sensible heat fluxes, through its effect on stomatal conductance and evapotranspiration, which then turns into the Earth’s energy and water budgets. In terrestrial ecosystem modeling, near-surface water vapor is needed to calculate latent heat flux since the water vapor within and just above the vegetation canopy can limit photosynthesis (Czajkowski 2002). Ignoring clouds, the atmosphere is largely transparent to the incoming solar flux, but mostly opaque to outgoing thermal infrared radiation due to the atmospheric water vapor and other gases, that absorbs outgoing radiation in different wave- lengths depending upon their spectral properties. The absorbed radiation will be then emitted to the ground causing global warming and to the space, which are greenhouse gases causing global warm- ing. More than half roughly 60% of the natural greenhouse effect is due to water vapor (Taylor 2005). PW has been mainly measured by radiosondes (a radiosonde is a device that has been specially designed to estimate atmospheric parameters of pressure, temperature, relative humidity, wind di- rection and speed) over land, but these instru- ments offer limited opportunities for spatial and continuous measurements of PW (Cuomo et al. 1997). Specific neural network models have recently been developed and applied to the particular problems in atmospheric and climate sciences, namely in boundary layer short range forecasting (Pasini and Ameli 2003). An application of one of these models in the valuation of the relative importance of global physical–chemical forcing and circulation patterns on the behavior of tem- peratures at global and regional scales (Antonello et al. 2006). In precipitable water-based studies, basically two methods, Iqbal (1983) and Levenberg– Marquardt (LM) methods are used. In this study, estimation of PW in Çukurova region was grounded on meteorological and geographical data (altitude, temperature, pressure, humidity). LM learning algorithms and logistic sigmoid trans- fer function are used in the network. Meteorologi- cal and geographical data was used as input to the network. PW was in the output layer. Comparison of monthly mean daily sum was measured and estimated during the study period for artificial neural network (ANN) values. The findings of this study indicate that the ANN-based prediction technique is suitable for estimating PW values as well as meteorological radiosonde observations. Study area and data The study area, Çukurova region, is located in the south part of Turkey between longitudes 35◦ E–21◦ E and latitudes 36◦ N–59◦ N. Meteoro- logical and geographical data (altitude, tempera- ture, pressure and humidity) were constantly mea- sured by the Turkish State Meteorological Service (TSMS) for the period from 1990 to 2006. We used the recorded data of Çukurova re- gion in this study. The data included very high humidity and temperature for summer, high hu- midity and temperature for spring, high humidity and temperature for autumn, but low humidity and temperature for winter observed throughout a year. Method Precipitable water PW is the total amount of water vapor in a vertical direction between the Earth’s surface (or a surface in a given height) and the top of the atmosphere (Chrysoulakis et al. 2001): PW = 1 g 0 ps Mrdp (1) where, Mr is the mixing ratio, g is the acceleration of gravity over the examined area, P is the pres- sure at a given altitude, and ps is the pressure on the surface of the earth (Iqbal 1983). The above relation show that PW has dimensions mass per surface (g/cm2 ). Thus, PW, which can also be mea- sured in cm, is described as the thickness of the
  • 3.
    Environ Monit Assess(2012) 184:141–147 143 liquid, which would also be possible if all vapor in the zenith direction were condensed at the surface of a unit area. In this study, using the relative humidity and air temperature vertical profiles and the values of sur- face atmospheric pressure, as deduced from the daily radiosonde measurements of the Wyoming University database for Çukurova region, we es- timated the daily and monthly mean values of precipitable water at various layers from the sur- face for the period of time between 1990 and 2006. Considering the estimation of the integral in relation with the study carried out by Soden and Bretherton (1993) we also calculated the monthly mean for the whole period 1990–2006 (radiosonde measurements; Table 1). Artificial neural networks The use of the ANNs for modeling and prediction purposes has been taking a growing interest over the last decades (Chow et al. 2002; Sözen et al. 2004). Researchers have been applying the ANN method successfully in various fields of mathemat- ics, engineering, medicine, economics, meteorol- ogy, psychology, neurology, in the prediction of mineral exploration sites, in electrical and ther- mal load predictions and in adaptive and robotic control and in many other subjects. ANNs have been trained to overcome the limitations of the conventional approaches to solve complex prob- lems. This method learns from given examples by constructing an input–output mapping in order to perform predictions (Mohandes et al. 2004). In other words, to train and test a neural network, input data and corresponding output values are necessary (Çam et al. 2005). An ANN may be viewed as a mathemati- cal model composed of many no-linear compu- tational elements, named neurons, operating in parallel and massively connected by links char- acterized by different weights. A single neuron computes the sum of its inputs, adds a bias term, and drives the result through a generally nonlin- ear activation function to produce a single out- put termed the activation level of the neuron. ANN models are mainly specified by the network topology, neuron characteristics, and training or learning rules (Lippmann 1987). The term topol- ogy refers to the architecture of the network as a whole: the number of its input, output and hidden units and their interconnection. Funda- mentals processing element of a neural network is a neuron. Each neuron computes a weighted sum of its p input signals, yi, for i = 0,1,2,. . . , n, hidden layers, wij and then applies a nonlinear activation function to produce an output signals uj. The model of a neuron is shown in Fig. 1. Table 1 Monthly mean PW values during the study period January February March April May June July August September October November 1990 9.99 12.72 14.3 17.3 21.31 25.43 37.86 31.82 27.66 21.69 18.81 1991 12.76 12.49 17.76 20.28 24.24 31.13 34.65 36.7 27.42 26.15 18.6 1992 9.06 9.4 11.79 16.99 22.64 32.06 30.95 32.62 23.01 20.92 15.83 1993 11.97 11.85 12.38 18.52 27.18 26.02 35.06 38.41 27.79 20.56 14.83 1994 17.23 13.93 16.95 19.7 24.65 27.69 37.34 34.18 33.36 24.57 21.19 1995 16.01 13.61 16.15 18.92 22.76 34.15 38.15 35.43 28.1 18.09 14.85 1996 13.91 13.17 17.54 18.42 25.72 27.52 – – – – 19.33 1997 13.29 11.94 12.47 18.54 26.69 36.75 37.01 40.79 20.64 21.53 16.46 1998 12.49 10.8 14.01 20.59 25.27 31.62 36.01 31.36 29.86 18.29 23.63 1999 15.31 15 14.89 18.95 23.61 36.62 43.17 41.82 34.01 25.35 17.35 2000 11.42 12.25 12.88 22.57 25.32 26.18 31.58 35.15 30.11 21.25 14.5 2001 14.08 13.38 17.56 19.1 22.85 25.36 34.77 35.88 26.28 17.36 15.46 2002 9.06 10.32 13.32 20.43 24.02 27.24 30.9 37.58 27.55 17.67 13.45 2003 14.32 11.08 12.73 17.74 19.56 27.05 28.51 29.33 24.88 23.62 15.23 2004 13.83 12.21 11.02 13.83 21.32 25.47 25.75 29.1 19.32 20.01 19.14 2005 12.2 11.83 15.97 18.47 21.77 27.79 34.54 34.38 28.14 17.31 14.38 2006 11.06 13.85 16.52 21.07 21.81 27.37 35 33.83 28.53 26.06 13.71
  • 4.
    144 Environ MonitAssess (2012) 184:141–147 Fig. 1 Nonlinear model of a neuron (Sözen et al. 2004) A neuron j may be mathematically described with the following pair of equations (Haykin 1994): uj = p i=0 wji yi and yj = ϕ uj − θj The use of threshold θ has the effect of applying an affine transformation to the output of the linear combiner in the model of Fig. 2 (Haykin 1994; Melesse and Hanley 2005). The sigmoid logistic nonlinear function is de- scribed with the following equation (Bilgili et al. 2007): ϕ (x) = 1 1 + e−x . Results and discussions ANN consisting of an input layer, single hidden layers (six neurons) and an output layer was used for modeling precipitable water in Çukurova re- gion. MATLAB, a commonly, used software was administered to train and test the ANN on a personal computer. Inputs for the network were Fig. 2 ANN architecture used for four neurons in a single hidden layer Precipitable water Hidden layer Output layerInput layer Altitude Temperature Pressure Humidity
  • 5.
    Environ Monit Assess(2012) 184:141–147 145 Fig. 3 Comparison of monthly mean daily sum measured and estimated concerning training during the study period y = 0.9935x R2 = 0.948 RMSE = 0.0024gr/cm2 0 10 20 30 40 50 0 10 20 30 40 50 Measured (gr/cm2 ) Estimated(gr/cm2 ) altitude, temperature, pressure and humidity; out- put is precipitable water. Variant of the algorithm used in the study was LM. Logistic sigmoid trans- fer function (logsig) and linear transfer function (purelin) were used in the hidden layers and in the output layer of the network as an activation function. Geographical and meteorological fac- tors have influences on the intensity of incoming sun radiation on the earth. Thus, meteorologi- cal data measured by the Turkish State Meteo- rological Service (TSMS) and Wyoming Univer- sity for the period from 1990 to 2007 data in Çukurova region were used as training and testing data so as to train the neural network. A set of 13 years (1990–2002) data were used for training the network, while a set of four years (2003– 2006) were used for testing and validating the LM model. The selected ANN structure is shown in Fig. 2. The monthly mean daily sum precipitable water over Çukurova region was determined using ANN method. The values were correlation coefficient (R2 ) 94.00% and root mean square error (RMSE) 0.0024 g/cm2 for training (Fig. 3), R2 91.84% and RMSE 8.04 g/cm2 for testing(Fig. 4) from LM values. The results of this study confirms the ability of ANN method to predict PW values at every pixels of the study area especially throughout Turkey, where only seven upper air radiosonde observa- tion station is located. In addition, meteorolog- ical radiosonde observations are held on great climate stations, which have a minimum of 250 km distance from each other. Small climate stations are unable to make radiosonde observation, so they cannot calculate PW values for the regions where they are located. A useful advantage of this method is using ground-measured meteorological data as input in ANN scientists can estimate for each meteorology station PW values in which pressure, humidity, and temperature are mea- sured. That means scientists could obtain more data than radiosonde observations (in Turkey, there are only seven radiosonde stations but about 1,000 meteorology station measures meteorologi- cal parameters used in this article). Fig. 4 Comparison of monthly mean daily sum measured and estimated concerning testing during the study period y = 1.1346x R2 = 0.9184 RMSE = 8.04gr/cm2 0 5 10 15 20 25 30 35 40 45 0 5 10 15 20 25 30 35 40 Measured (gr/cm2 ) Estimated(gr/cm2 )
  • 6.
    146 Environ MonitAssess (2012) 184:141–147 Table 2 Comparison with other ANN methods using different input parameters Input data Correlation Coefficient Mallet et al. (2002) Satellite data 0.82a Wang et al. (2006) Satellite data 0.814 Basili et al. (2010) Satellite data 0.839 Mattioli et al. (2010) Satellite data 0.857 Current study Meteorological data 0.912 aThe correlation coefficient of Mallet, C is the mean value of seven stations In this model, some ground measurements of TSMS stations, which have influence upon PW distribution, were used as input parameter in ANN method. In spite of the influence of the vertical distribution of water vapor on brightness temperatures (satellite data) is extremely weak, PW was calculated using satellite data with ANN- MLP methods in most scientific papers (Wang et al. 2006; Basili et al. 2010; Mallet et al. 2002). These researches did not use meteorological data as in this method and because of that, they have much more error comparing this ground-based developed method (Table 2). This method, due to less error and large data number, is more suitable for meteorologists and scientists especially studying about numerical weather prediction, climate change, and solar en- ergy, which need a large number of PW data. On the other hand, using the ANN technique is more useful and cheaper than the classical observations proposed by meteorology stations in Turkey and in other countries. This method- estimated data will improve the limitations of me- teorological observations of conventional stations Conclusion In this study, ANN method for estimating pre- cipitable water values over Çukurova region was used. PW was observed to be playing a very im- portant role in obtaining highly accurate results since construction of precipitable water database is very useful for solar energy, environmental agri- cultural, global climate change, and other applica- tions. By using ANN, PW values were predicted over Çukurova region. Correlation coefficient (R2 ) between the predicted and measured values for monthly mean daily sum with ANN method values was found to be 94.00% (training), 91.84% (testing), respectively. The results also revealed that the Çukurova region, correlation values in- dicate a relatively good agreement between the observed ANN values and the calculated precip- itable water values. It is known that atmospheric water vapor also PW profiles are not stabile in the atmosphere. Conventional radiosonde obser- vations could not satisfy the need for water va- por data due to its poor coverage and limited spatial representativity and such observations are not generally available for large oceanic areas (Sobrino et al. 2003; Singh and Bhatia 2008). In overcoming this difficulty, scientists need more data for monitoring the atmosphere and this method plays a big role for gathering more PW data, which is the most useful benefit of this devel- oped model for scientists. Thus, it is suggested that this method be used to achieve suitable results, since using ANN is more convenient cheaper and faster as compared to metrological methods in the estimation of PW. References Antonello, P., Massimo, L., & Fabrizio, A. (2006). Neural network modelling for the analysis of forc- ings/temperatures relationships at different scales in the climate system. Ecological Modelling, 191, 58–67. Basili, P., Bonafoni, S., Mattioli, V., Pellicia, F., Ciotti, P., Carlesimo, G., et al. (2010). Neural network reti- aval of integrated precipitable water vapor over land from satellite microwave radiometer. Proc. of Micro- rad 2010, 1–4 March, Washigton, DC, USA. ISBN:978- 1-4244-8120-0. Bilgili, M., ¸Sahin, B., & Ya¸sar, A. (2007). Application of artificial neural networks for the wind speed predic- tion of target station using reference stations data. Renewable Energy, 32, 2350–2360. Çam, E., Arcaklıo˘glu, E., Çavuso˘glu, A., & Akbıyık, B. (2005). A classification mechanism for determining average wind speed and power in several regions of Turkey using artificial neural networks. Renewable Energy, 30, 227–239. Chow, T. T., Zhang, G. Q., Lin, Z., & Song, C. L. (2002). Global optimization of absorption chiller system by genetic algorithm and neural network. Energy Build- ing, 34, 103–109. Chrysoulakis, N., & Cartalis, C. (2002). Improving the es- timation of land surface temperature for the region of Greece: Adjustment of a split window algorithm
  • 7.
    Environ Monit Assess(2012) 184:141–147 147 to account for the distribution of precipitable water. International Journal of Remote Sensing, 23, 871–880. Chrysoulakis, N., Proedrou, M., & Cartalis, C. (2001). Variations and trends in annual and seasonal means of precipitable water in Greece as deduced from ra- diosonde measurements. Toxicological and Environ- mental Chemistry, 84, 1–6. Cuomo, V., Tramutoli, V., Pergola, N., Pietrapertosa, C., & Romano, F. (1997). In place merging of satellite based atmospheric water vapour measurements. In- ternational Journal of Remote Sensing, 18(17), 3649– 3668. Czajkowski, K. P. (2002). Thermal remote sensing of near- surface water vapor. Remote Sensing of Environment, 79, 253–265. Haykin, S. (1994). Neural networks, a comprehensive foun- dation. New Jersey: Prentice-Hall. Iqbal, M. (1983). An Introduction to Solar Radiation. Torondo: Academic. Lippmann, R. P. (1987). An introduction to computing with neural nets. IEEE ASSP Magazine, 4, 4–22. Mallet, C., Moreau, E., Casagrande, L., & Klapisz, C. (2002). Determination of integrated cloud liquid water path and total precipitable water from SSM/I data us- ing a neural network algorithm. International Journal of Remote Sensing, 23(4), 661–674. Mattioli, V., Bonafoni, S., Basili, P., Carlesimo, G., Ciotti, P., Pulvirenti, L., & Pierdicca, N. (2010). Neural net- work for the satellite retrieval of precipitable water vapor over land. Geoscience and Remote Sensing Symposium (IGARSS), 2010 Honolulu, HI, p. 2960– 2963. doi:10.1109/IGARSS.2010.5650528. Melesse, A. M., & Hanley, R. S. (2005). Artificial neural network application for multiecosystem carbon flux simulation. Ecological Modelling, 189, 305–314. Mohandes, M. A., Halawani, T. O., Rehman, S., & Hussain, A. A. (2004). Support vector machines for wind speed prediction. Renewable Energy, 29, 939–947. Pasini, A., & Ameli, F. (2003). Radon short range forecast- ing through time series preprocessing and neural net- work modelling. Geophysical Research Letters, 30(7), 1386. doi:10.1029/2002GL016726. Singh, D., & Bhatia, R. C. (2008). Development of a neural network algorithm for the retrieval of TPW from NOAA16 AMSU measurements. Inter- national Journal of Remote Sensing, 29(14), 4045– 4060. Sobrino, J. A., El Karraz, J., & Lı, Z.-L. (2003). Surface temperature and water vapour retrieval from MODIS data. International Journal of Remote Sensing, 24, 4045–4060. Soden, B. J. (2000). Atmospheric physics: enlightening wa- ter vapor. Nature, 406, 5161–5182. Soden, B. J., & Bretherton, F. P. (1993). Upper tro- posphere relative humidity from the GOES 6.7 um Channel: Method and climatology for July 1987. Journal of Geophysical Research, 98(D9), 16669– 16688. Sözen, A., Arcaklıo˘glu, E., & Özalp, M. (2004). Perfor- mance analysis of ejector absorption heat pump using ozone safe fluid couple through artificial neural net- works. Energy Conversion and Management, 45, 2233– 2253. Taylor, F. W. (2005). Elementary climate physics. New York: Oxford University Press. Wang, W., Sun, X., Zhang, R., Li, Z., Zhu, Z., & Su, H. (2006). Multi-layer perceptron neural network based algorithm for estimating precipitable water vapour from MODIS NIR data. International Journal of Re- mote Sensing, 23(3), 617–621.