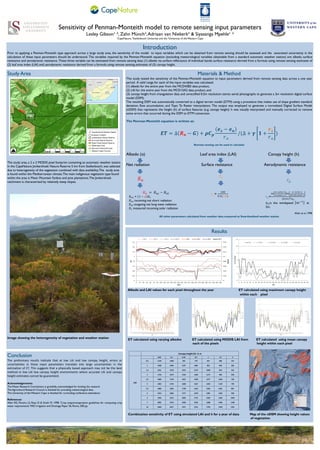
Streamflow simulation using radar-based precipitation applied to the Illinois...
ESA_smpehle_16October2015
1. Introduction
Prior to applying a Penman-Monteith type approach across a large study area, the sensitivity of the model to input variables which can be obtained from remote sensing should be assessed and the associated uncertainty in the
calculation of these input parameters should be understood. The variables required by the Penman-Monteith equation (excluding meteorological variables obtainable from a standard automatic weather station) are: albedo, surface
resistance and aerodynamic resistance. These three variable can be estimated from remote sensing data: (1) albedo via surface reflectance of individual bands; surface resistance derived from a formula using remote sensing estimates of
(2) leaf area index (LAI) and; aerodynamic resistance derived from a formula using remote sensing estimates of (3) canopy height.
Study Area
The study area, a 2 x 2 MODIS pixel footprint containing an automatic weather station
in the CapeNature Jonkershoek Nature Reserve 5 km from Stellenbosch, was selected
due to heterogeneity of the vegetation combined with data availability.The study area
is found within the Mediterranean climate.The main indigenous vegetation type found
within the area is Mesic Mountain Fynbos and pine plantations.The Jonkershoek
catchment is characterised by relatively steep slopes.
Image showing the heterogeneity of vegetation and weather station
Results
Albedo and LAI values for each pixel throughout the year ET calculated using maximum canopy height
within each pixel
ET calculated using varying albedos ET calculated using MODIS LAI from ET calculated using mean canopy
each of the pixels height within each pixel
Combination sensitivity of ET using simulated LAI and h for a year of data Map of the nDSM showing height values
of vegetation
oduct
Conclusion
The preliminary results indicate that at low LAI and low canopy height, errors or
uncertainties in these input parameters translate into large uncertainties in the
estimation of ET. This suggests that a physically based approach may not be the best
method in low LAI low canopy height environments where accurate LAI and canopy
height estimates cannot be guaranteed.
Acknowledgements:
The Water Research Commission is gratefully acknowledged for funding the research
The Agricultural Research Council is thanked for providing meteorological data
The University of theWestern Cape is thanked for co-funding conference attendance
References:
Allen RG, Pereira LS, Raes D & Smith M, 1998. ‘Crop evapotranspiration: guidelines for computing crop
water requirements’ FAO Irrigation and Drainage Paper 56, Rome, 300 pp.
Materials & Method
This study tested the sensitivity of the Penman-Monteith equation to input parameters derived from remote sensing data across a one year
period. A valid range for each of the input variables was calculated:
(1) albedo for the entire year from the MCD43B3 data product,
(2) LAI for the entire year from the MCD15A2 data product, and
(3) canopy height from triangulation data and unrectified 0.5m resolution stereo aerial photographs to generate a 2m resolution digital surface
model (DSM).
The resulting DSM was automatically converted to a digital terrain model (DTM) using a procedure that makes use of slope gradient standard
deviation, flow accumulation, and Topo To Raster interpolation. The output was employed to generate a normalized Digital Surface Model
(nDSM) that represents the height (h) of surface features (e.g. canopy height). h was visually interpreted and manually corrected to remove
some errors that occurred during the DSM to DTM conversion.
The Penman-Monteith equation is written as:
𝑬𝑻 = ∆ 𝑹 𝒏 − 𝑮 + 𝝆𝑪 𝒑
𝒆 𝒔 − 𝒆 𝒂
𝒓 𝒂
/(∆ + 𝜸 𝟏 +
𝒓 𝒔
𝒓 𝒂
)
Remote sensing can be used to calculate
Albedo (α) Leaf area index (LAI) Canopy height (h)
Net radiation Surface resistance Aerodynamic resistance
Allen et al. 1998
All other parameters calculated from weather data measured at Swartboskloof weather station
Canopy height (h) in m
LAI
0.05 0.1 0.25 0.5 1 1.5 2
0.5 1194 1090 925 770 567 400 227
1 1498 1405 1247 1087 853 640 392
1.5 1651 1570 1427 1275 1040 810 522
2 1743 1672 1544 1402 1175 940 630
2.5 1806 1743 1627 1496 1277 1044 720
3 1852 1795 1689 1567 1359 1129 799
3.5 1886 1835 1738 1624 1426 1201 867
4 1913 1866 1777 1670 1481 1262 928
5 1953 1913 1835 1741 1569 1362 1032
7 2001 1970 1909 1833 1688 1504 1189
10 2040 2017 1971 1912 1795 1639 1351
Sensitivity of Penman-Monteith model to remote sensing input parameters
Lesley Gibson¹·², Zahn Münch²,Adriaan van Niekerk² & Siyasanga Mpehle¹·³
¹CapeNature, ²Stellenbosch University and the ³University of theWestern Cape