This study investigates wind power density estimation in Turkey using artificial neural networks (ANN), analyzing data from 58 meteorological stations between 1980 and 2013. Various learning algorithms were employed to train the network, achieving a correlation coefficient of 0.9767 and a mean bias error of -0.3124 W/m². The findings suggest that the developed model is effective for estimating wind power density, supporting the country's potential for renewable energy sources.
![International Journal of Thales Natural Sciences (IJTNS)
ISSN (print): 2149-5297
29 | P a g e
www.thalespublisher.com
Estimation of Wind Power Density with Artificial Neural Network
Muhammed Yusuf Aktaç
Electrical and Electronic Engineering, Engineering Faculty/ Siirt University
Mehmet Şahin
Electrical and Electronic Engineering, Engineering Faculty/ Siirt University
Rıdvan Saraçoğlu
Electrical and Electronic Engineering, Engineering Faculty/ Yüzüncü Yil University
ABSTRACT
Industry and technology are rapidly developing with each passing day. They need energy to sustain
this evolution. The demand of energy is mainly provided from fossil fuels. Unfortunately, this kind of
energy reserves are consumed away day by day. Therefore, there is a need to use alternative energy sources
to supply energy needs. Alternative energy sources can be listed as; solar, wind, wave, biomass, geothermal
and hydro-electric power. Our country has significant potential for wind energy. Wind power density
estimation is required to determine the wind potential. In this study, the wind power density was estimated
by using artificial neural network (ANN) method. Forty meteorological stations were used for ANN
training, while eighteen meteorological stations were used to test the trained network. Network has trained
according to, respectively; trainlm, trainbfg, trainscg, traincgp traincgb, traincgf ve trainoss learning
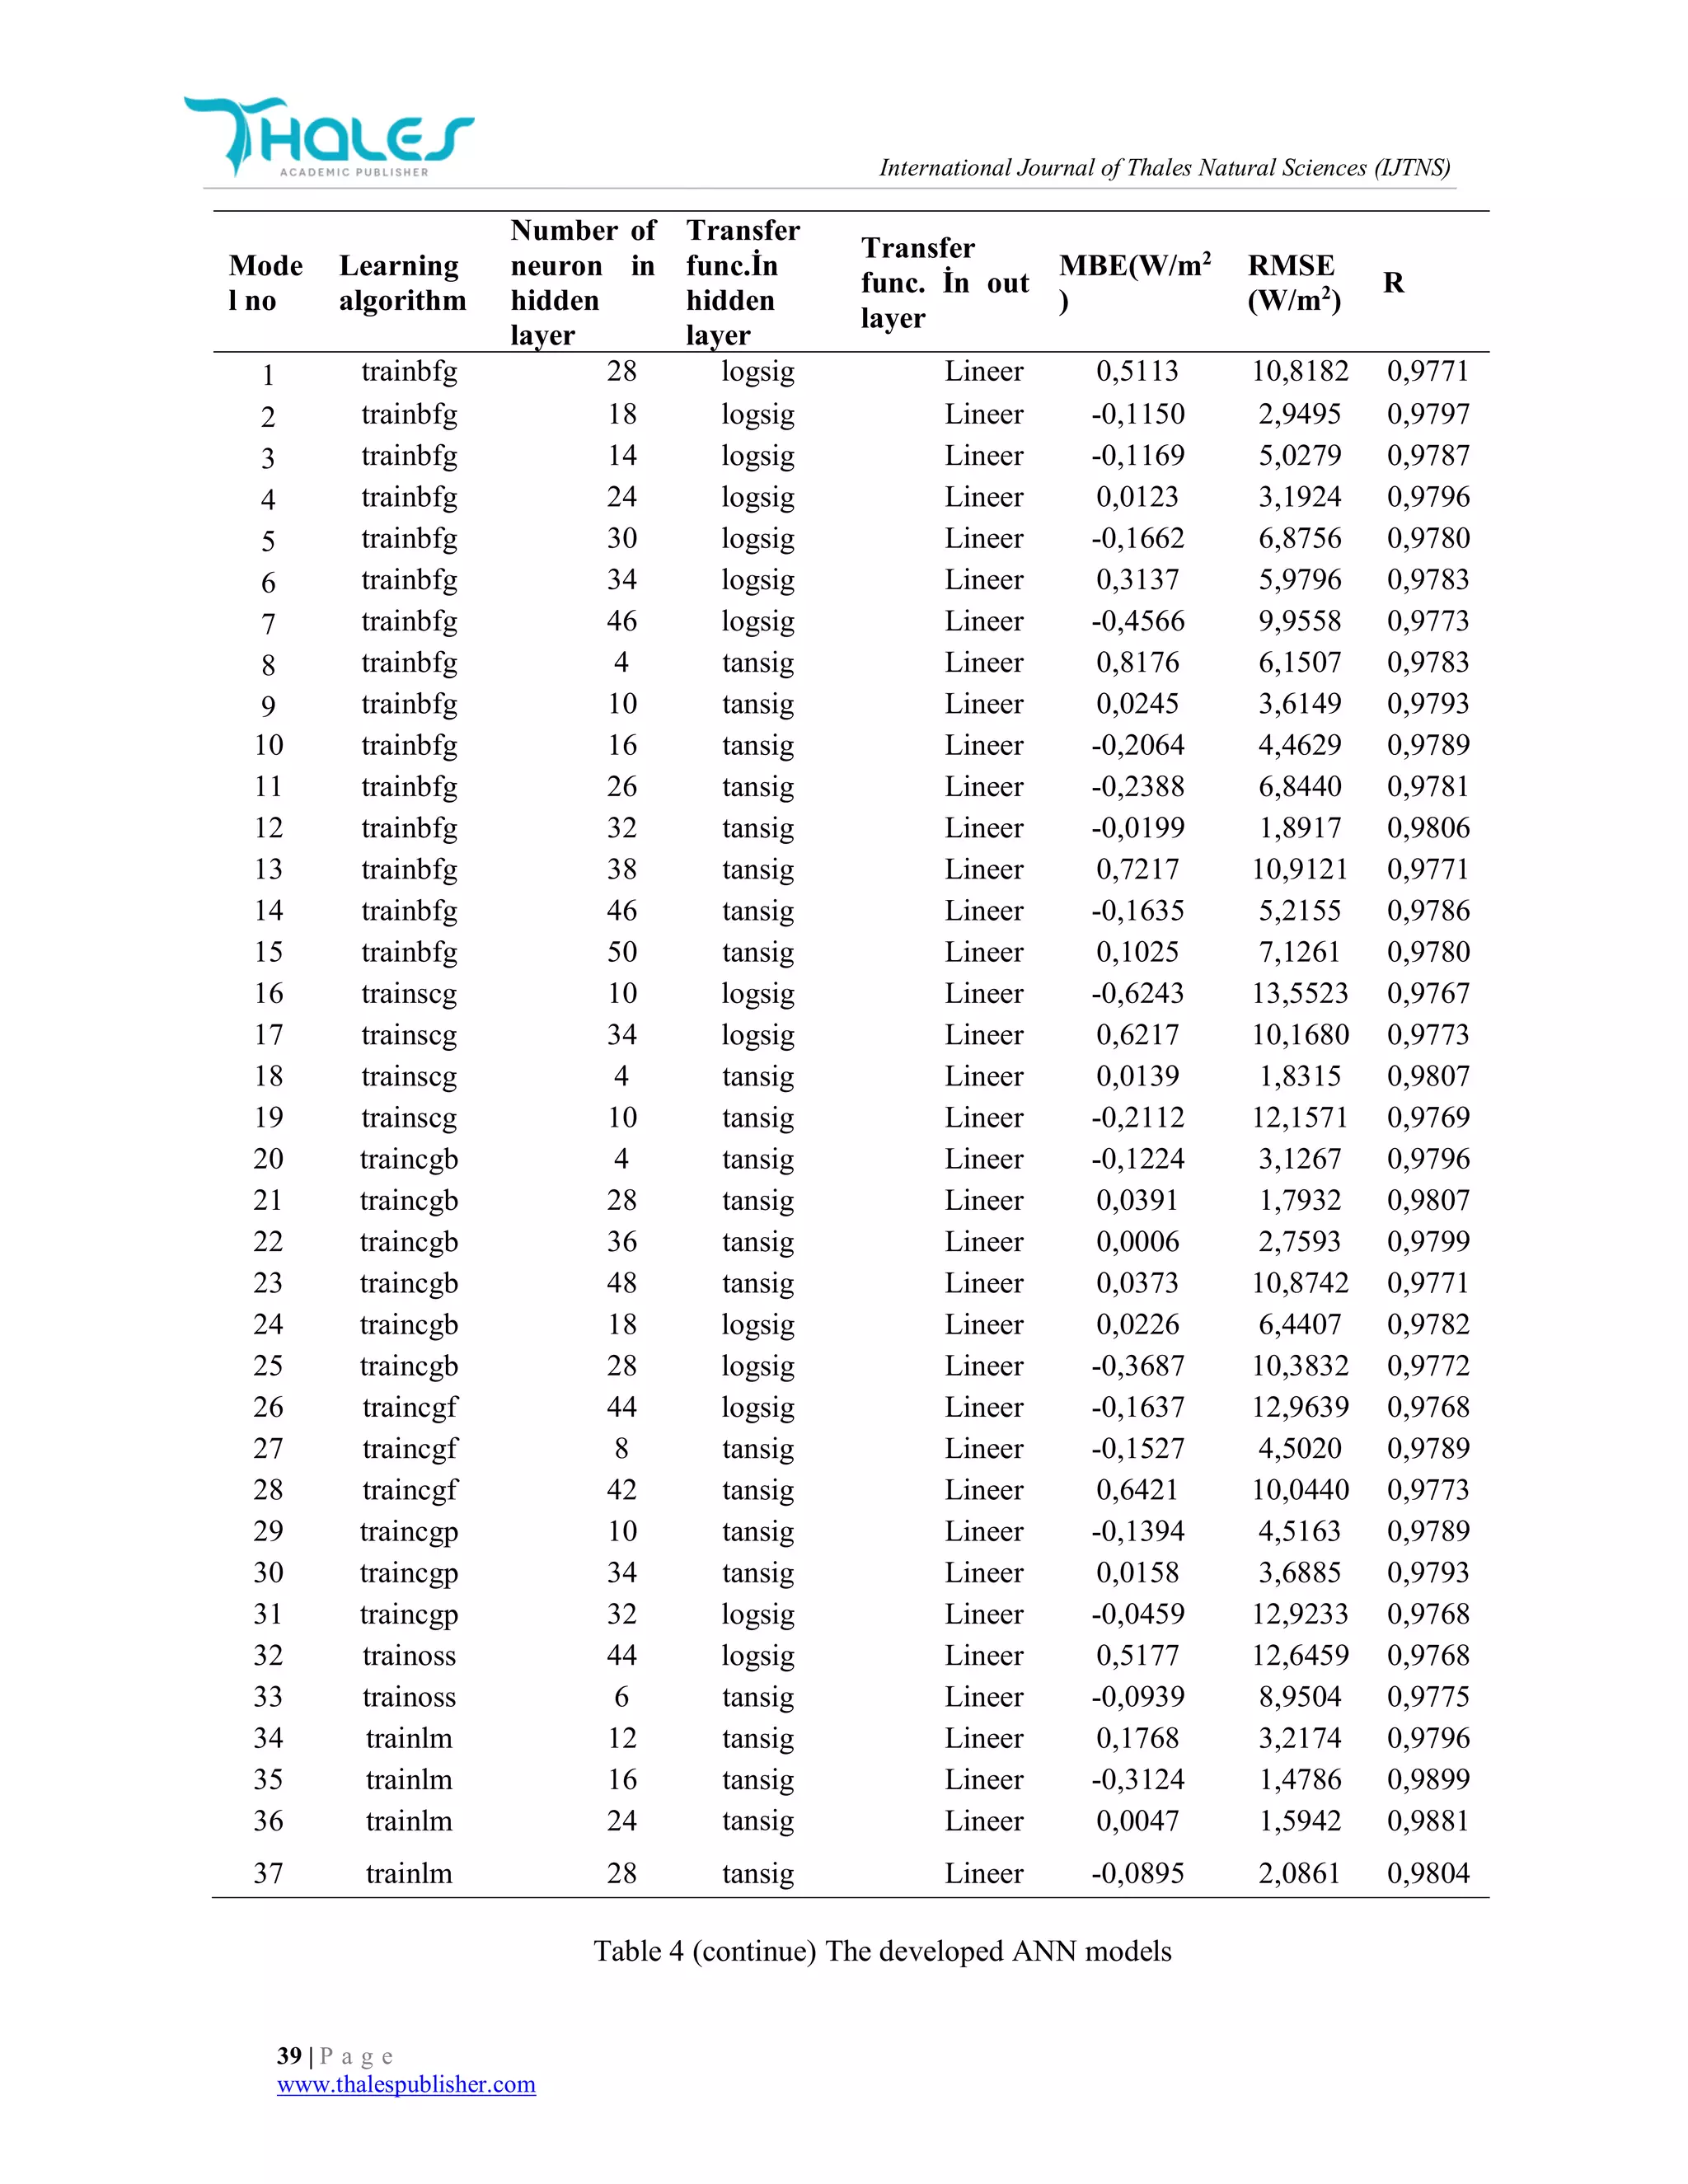
algorithms. The correlation coefficient (R) and Mean bias error (MBE) of the best developed model were
calculated as 0,9767 and -0,3124 W/m2 respectively. Root Mean Square Error (RMSE) was calculated as
1,4786 W/m2. In conclusion, the obtained results demonstrate that the developed model can be used to
estimate the wind power density.
Keywords: Alternative energy sources, wind power density, wind speed, artificial neural networks
1 INTRODUCTION
Today, the rapid population growth that have occurred around the world, with the facts of
urbanization and industrialization increased as a result of globalization there is an increasing demand for
natural resources and energy developments such as commercial facilities[1]. On the other hand used fossil
resources, causing global warming and the greenhouse effect on world climate changes are caused by this
unusual form. On the other hand, environmental pollution brought by energy source began to occur
indirectly harm the environment and human health [2].
Due to these reasons countries of the world clean, healthy, renewable energy sources to qualify as a
sustainable energy source has been forced to move toward a quick orientation. Renewable energy sources
lasting, environmentally friendly, clean and plays a major role in environmental protection. At
the same time, countries also provide a major contribution to economic development [3]. These
circumstances has increased the interest of the people of the renewable energy sources [4]. Amongst](https://image.slidesharecdn.com/estimationofwindpowerdensitywithartificialneuralnetwork-170612080824/75/Estimation-of-wind-power-density-with-artificial-neural-network-1-2048.jpg)
![International Journal of Thales Natural Sciences (IJTNS)
30 | P a g e
www.thalespublisher.com
renewable energy sources, wind energy is one of the sources which is plenty, low-cost, clean, most
advanced, and sufficient in terms of commercial aspect [5]. Therefore, the use of wind energy is getting
attention increasingly both in Turkey and all over the world in recent years [6, 7]. The aim of this research
is to examine the activity and the practicability of ANN in detecting the potential of wind energy in Turkey.
In previous studies, long-term studies which used the combination of ANN methods based on large input
parameters have not been observed in Turkey.
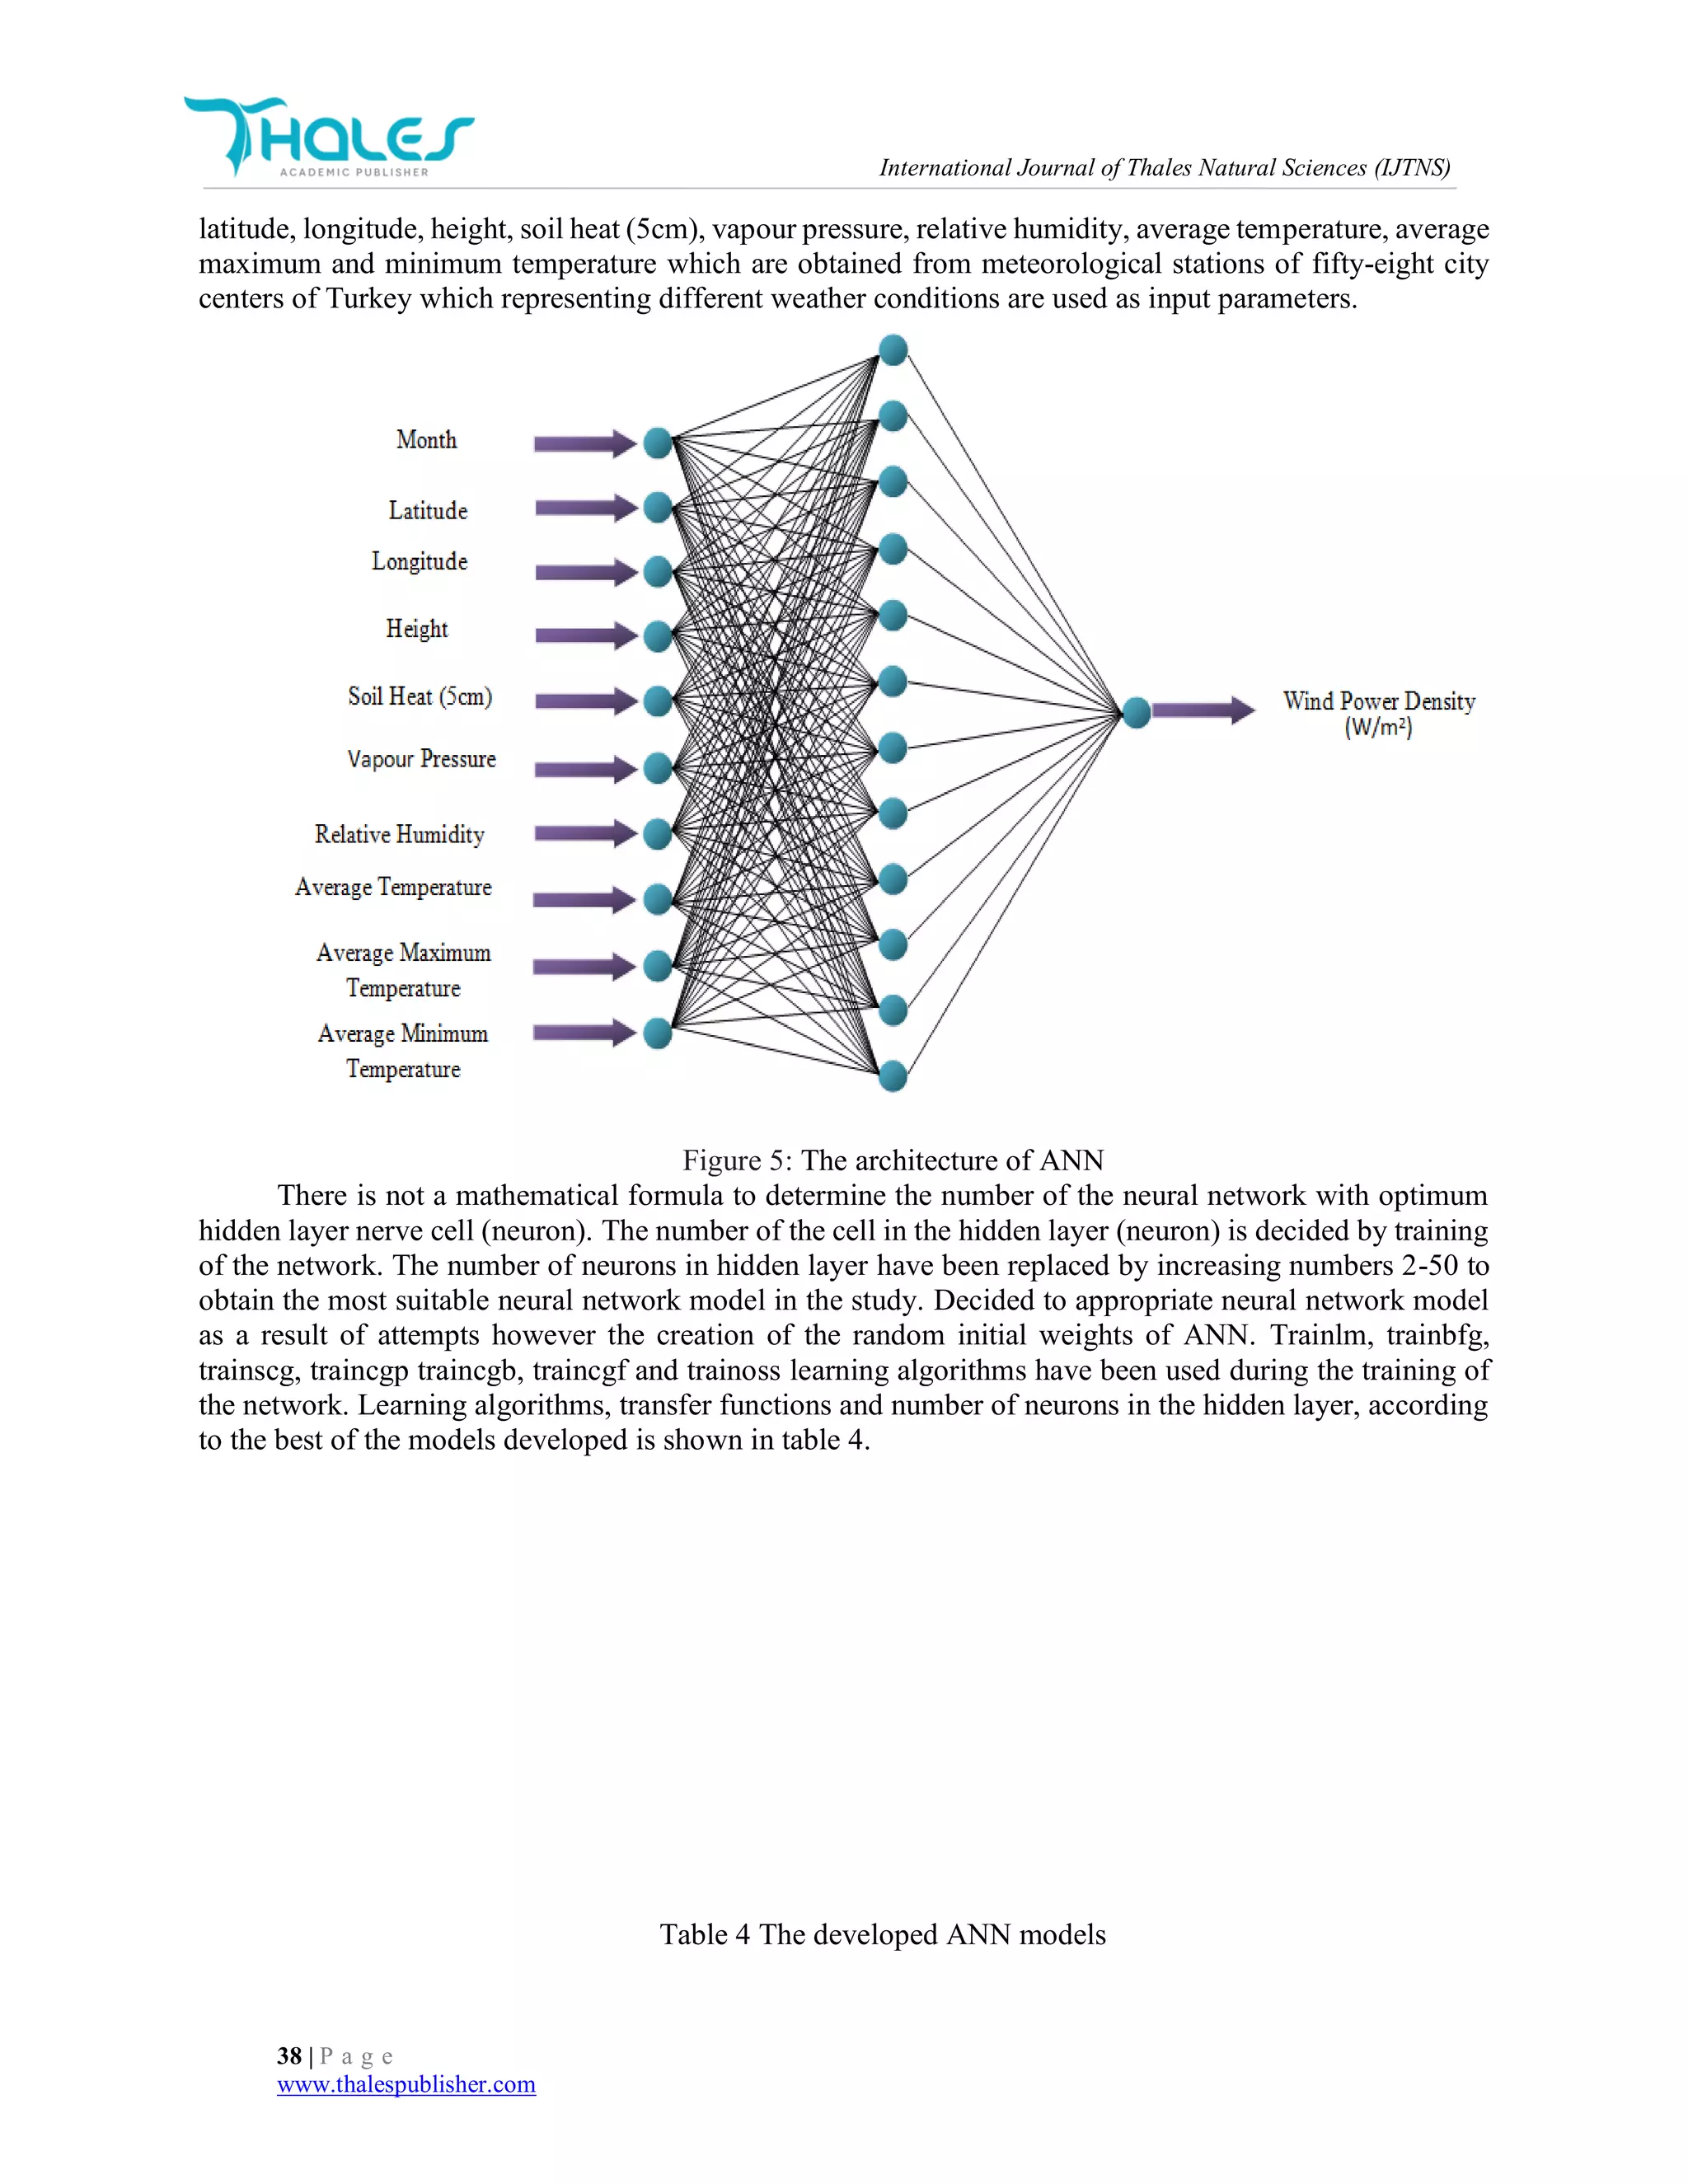
The study has its own direction in this respect. In this study, wind power density (W/m2) will be
obtained as output parameter while the month, latitude, longitude, height, soil heat (5 cm), vapour pressure,
relative humidity, average temperature, average maximum and minimum temperature which are obtained
from meteorological stations of 58 city centers of Turkey which representing different weather conditions
are used as input parameters. The datas between 1980-2010 years are used as education datas, the datas
between 2011-2013 are used as test-purpose in the study.
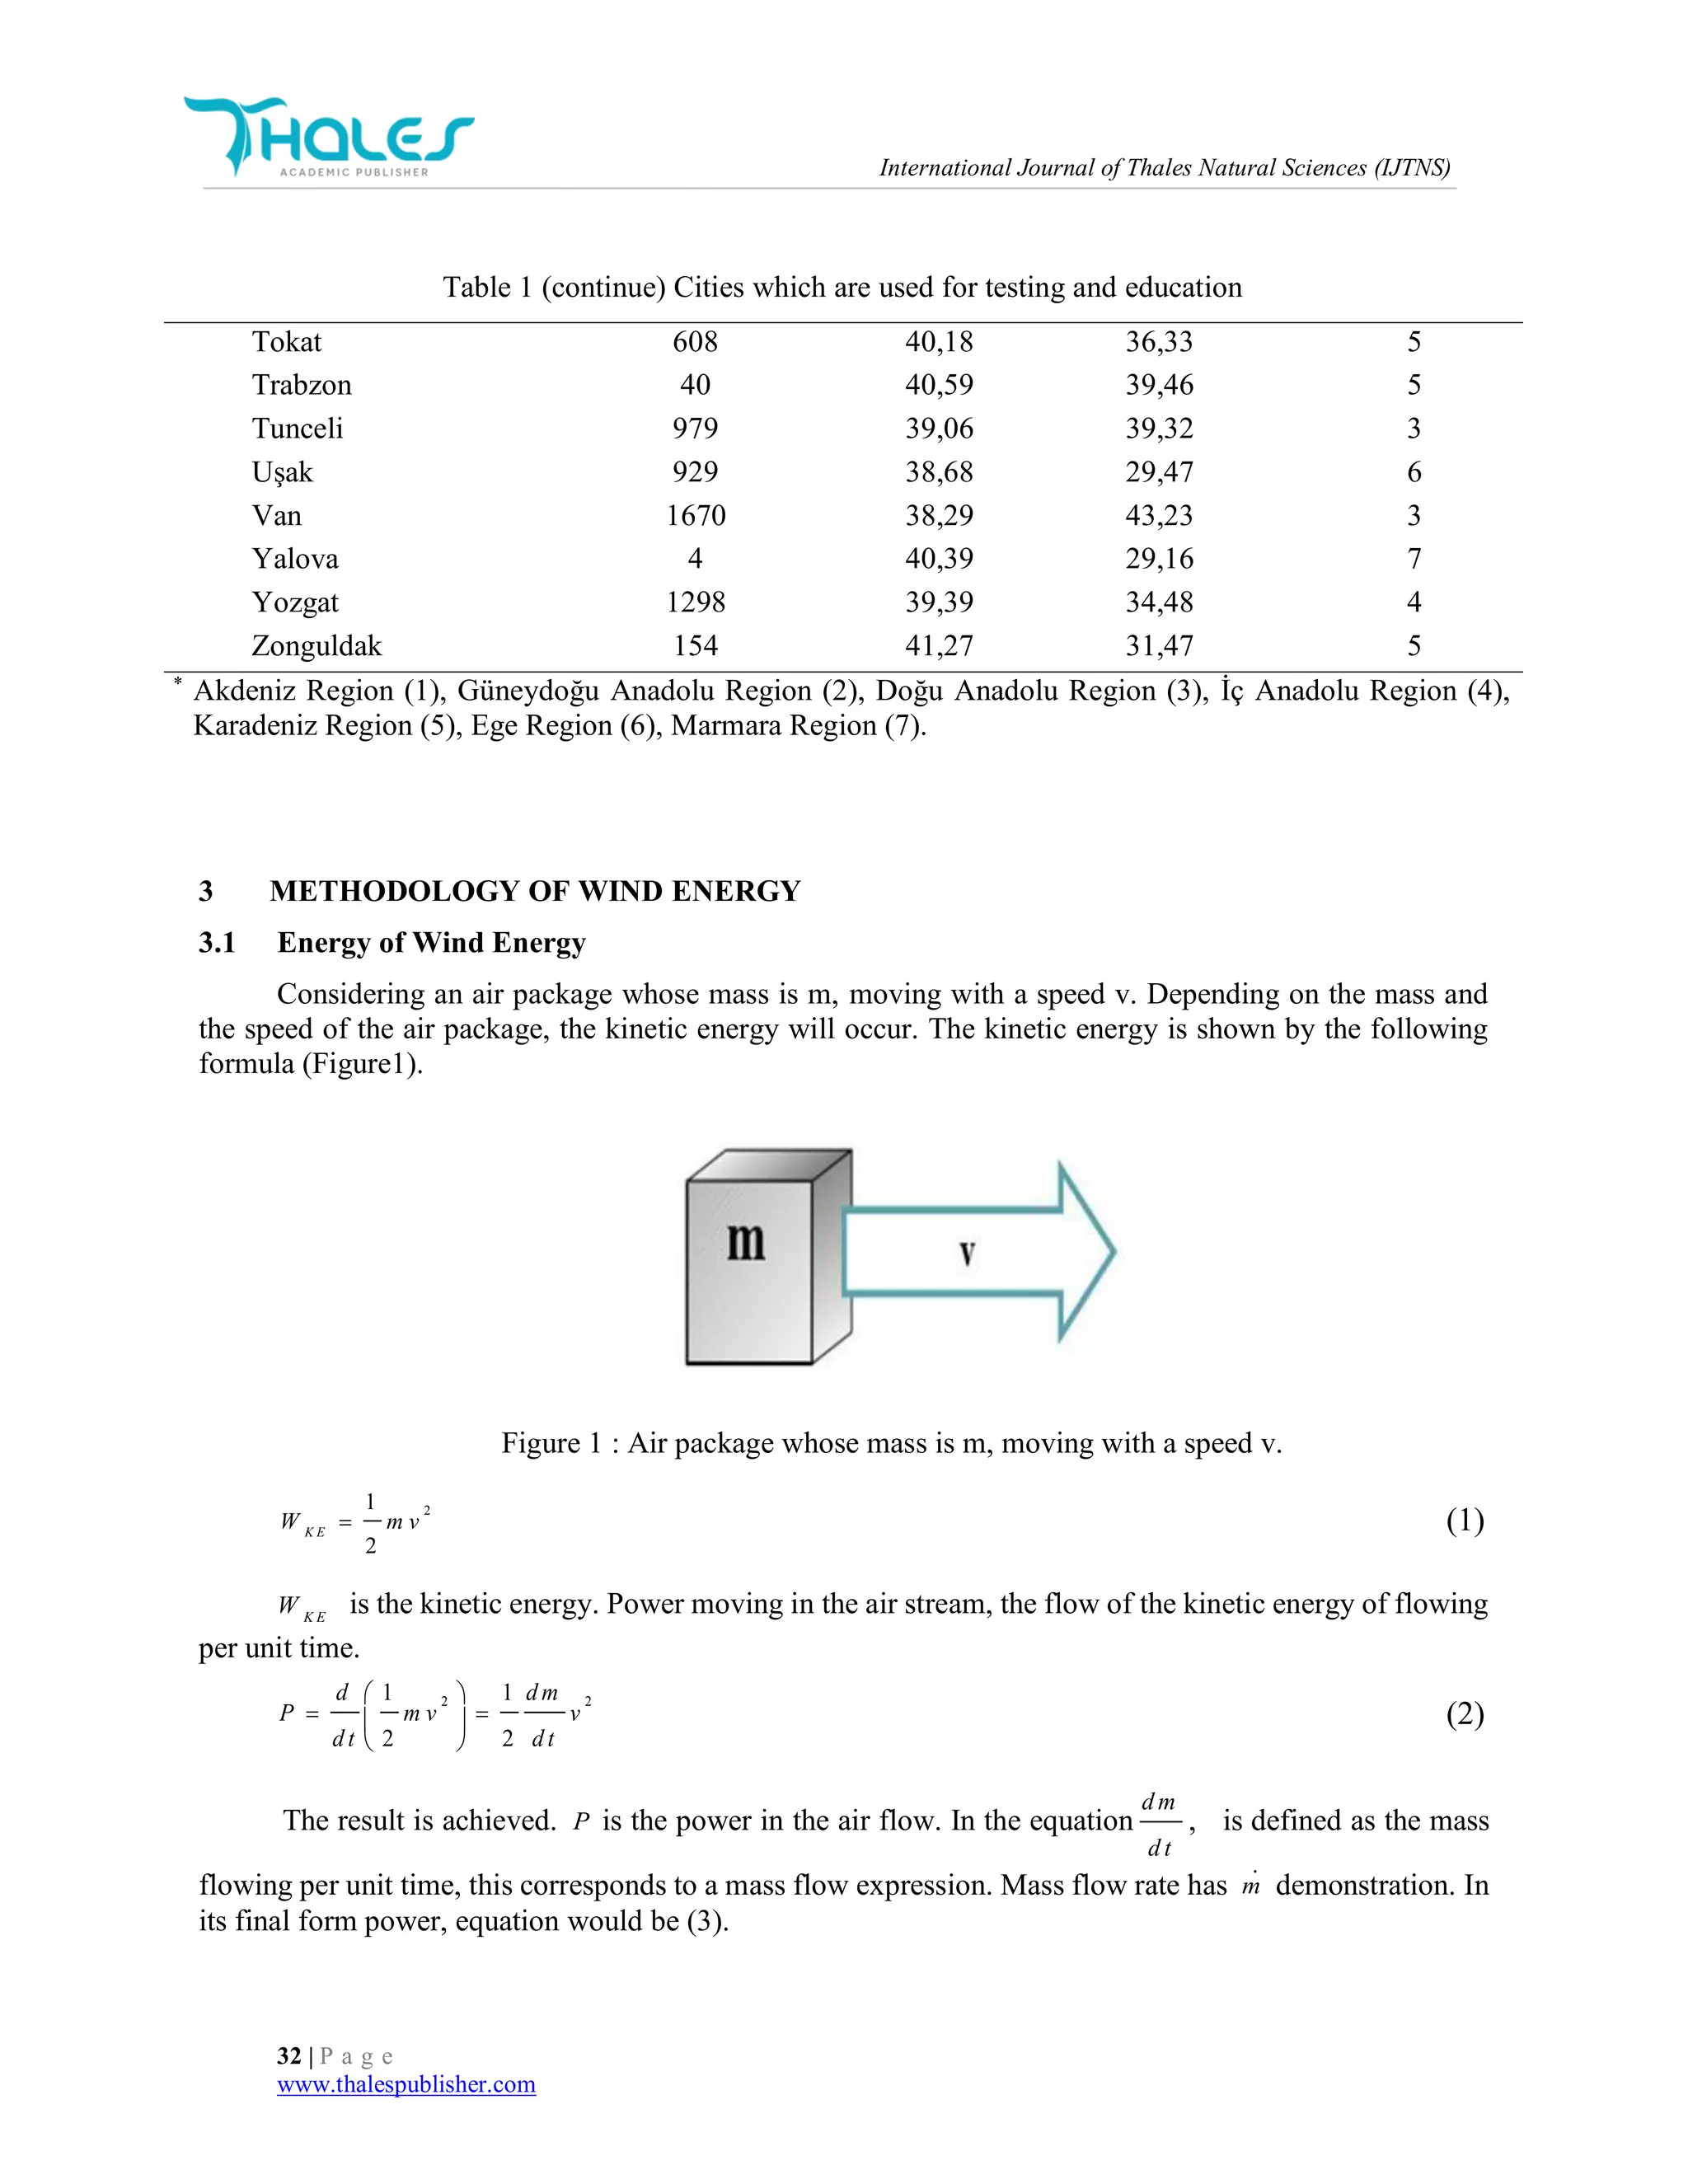
2 METHODOLOGY AND DATA SOURCES
Depending on the climatic conditions Turkey is divided into seven geographical regions. These are;
Ege, Marmara, Karadeniz, İç Anadolu, Doğu Anadolu and Güneydoğu Anadolu regions. Each area has a
unique climate. Fifty-eight selected in the study as a control point locations, with 7 smooth distributions by
geographic region is provided.
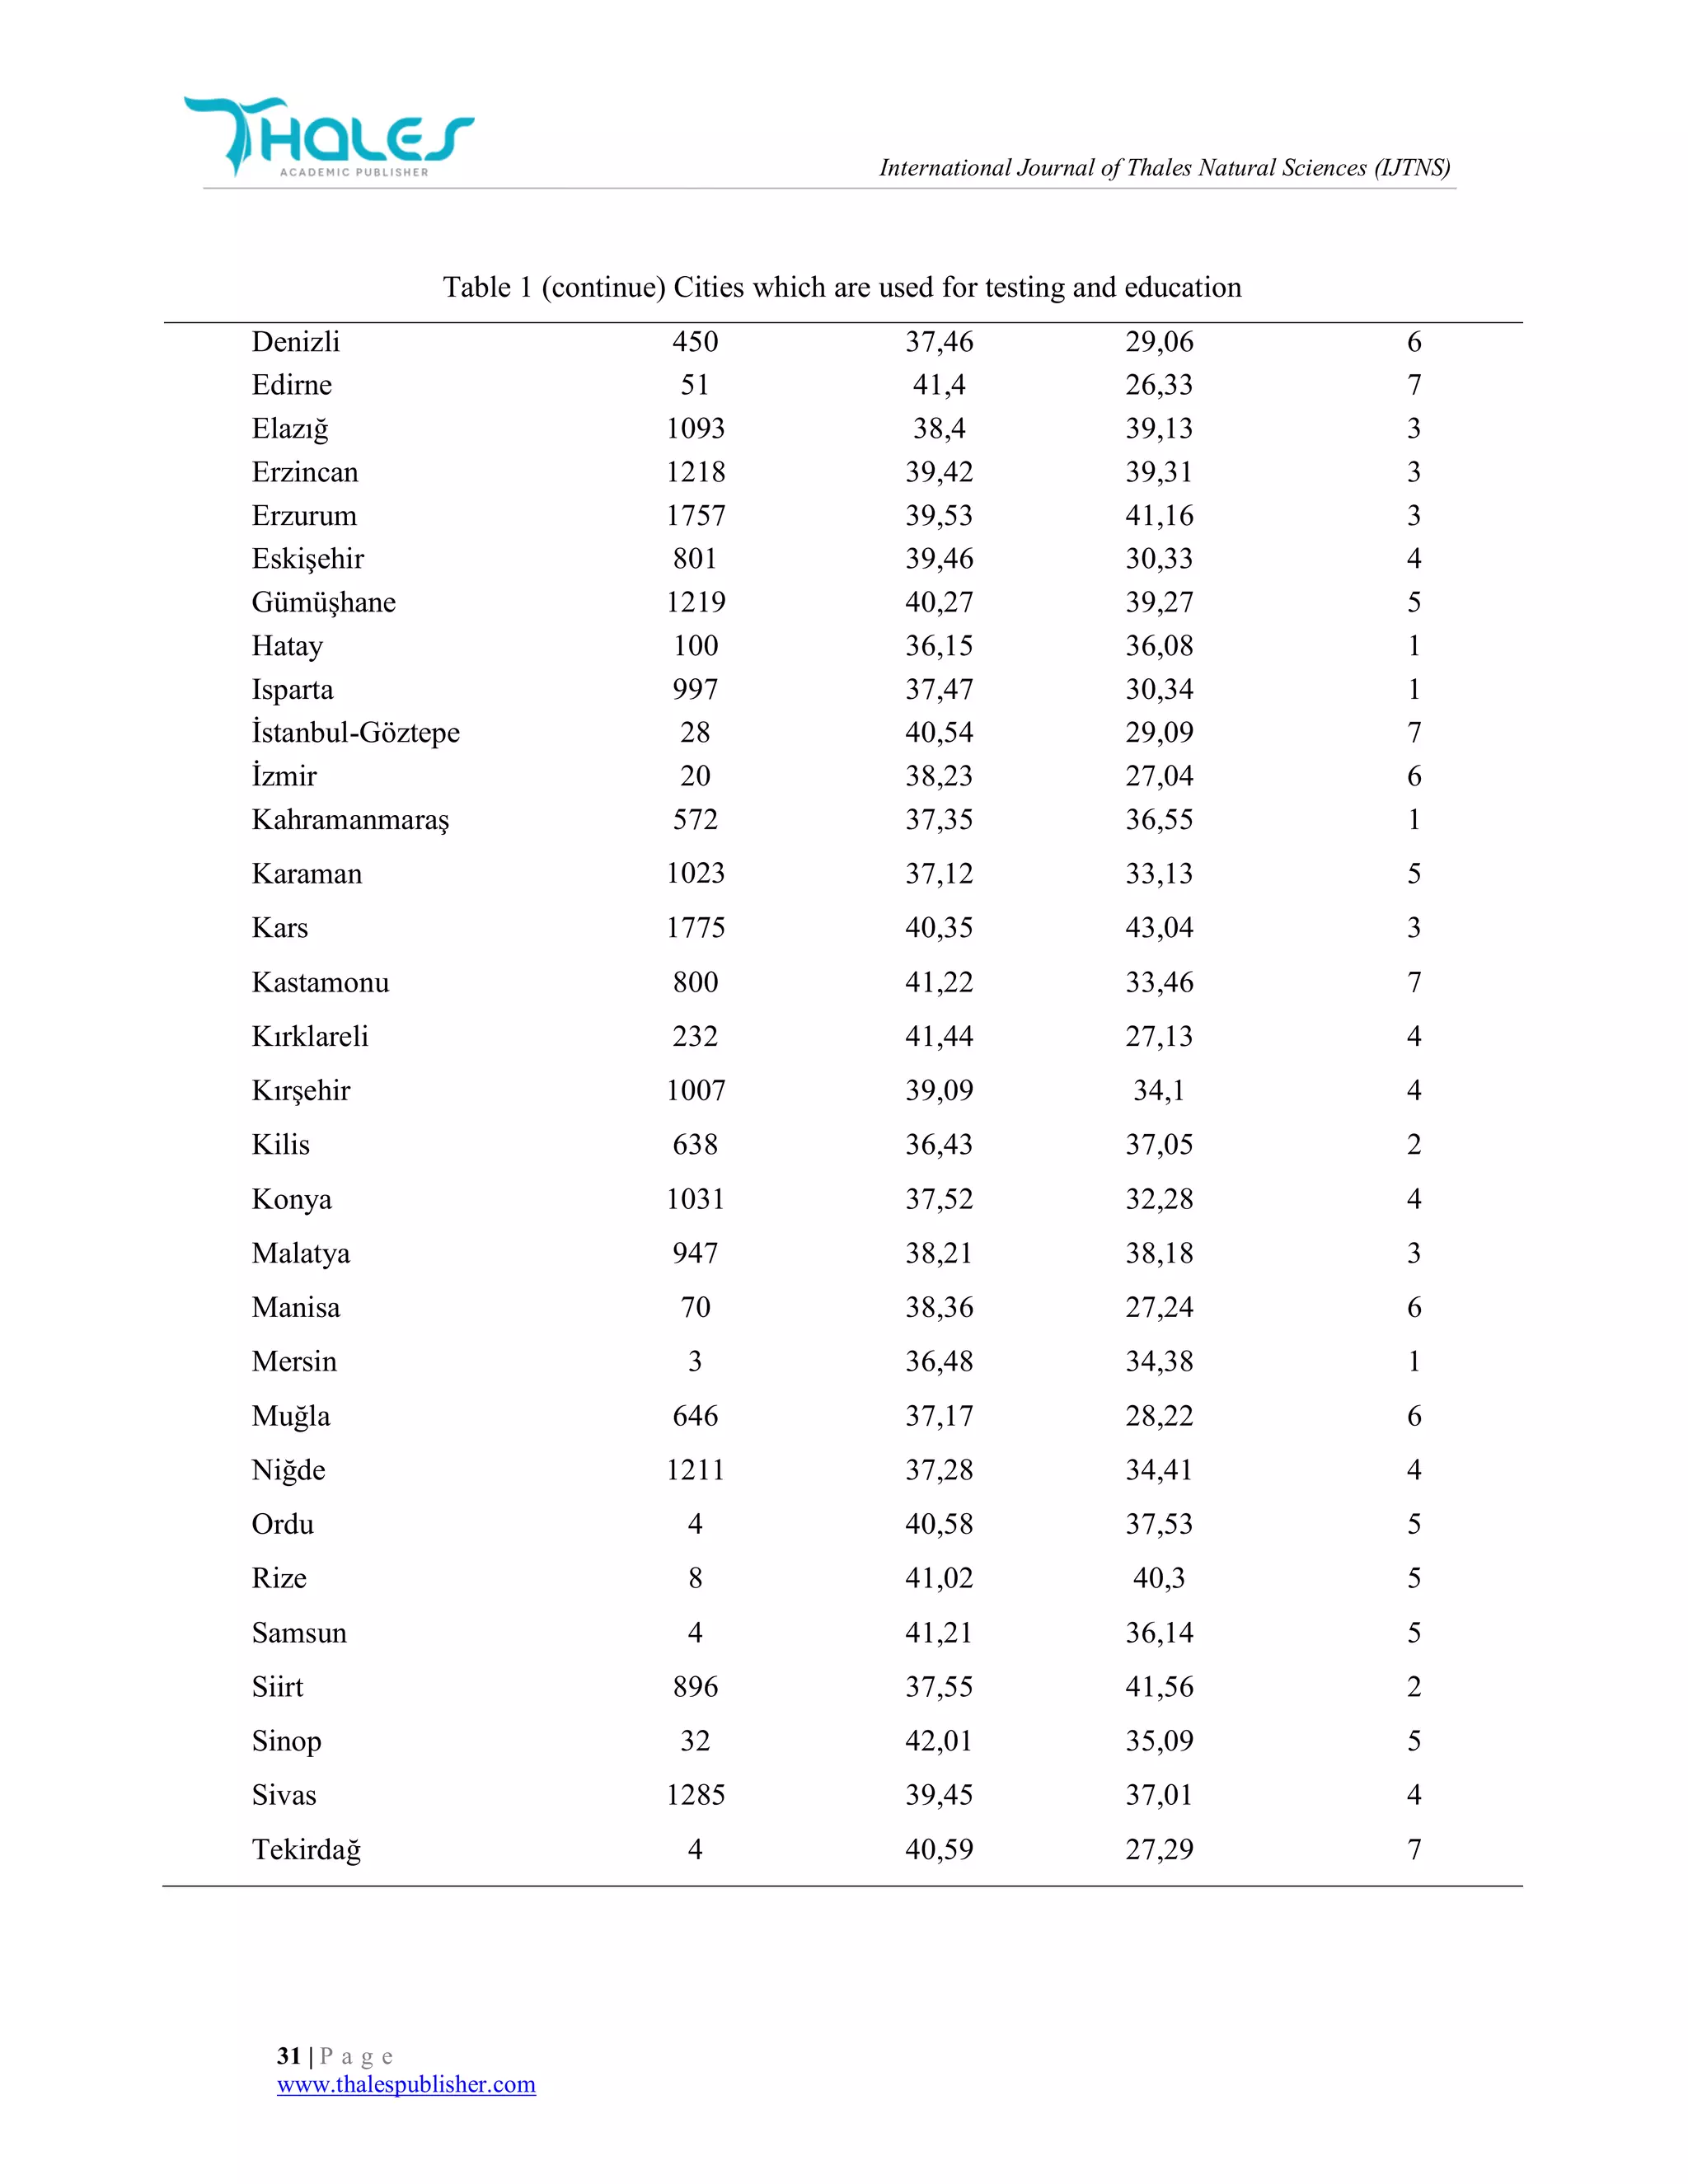
Table 1 Cities which are used for testing and education
City Height (m) Latitude(°N) Longitude(°E) Geographic Region*
Adana 27 37 35,19 1
Adıyaman 679 37,45 38,16 2
Afyonkarahisar 1034 38,44 30,34 6
Aksaray 961 38,22 34 4
Amasya 412 40,39 35,5 5
Ankara 891 40,04 32,34 4
Antalya 47 36,53 30,4 1
Artvin 615 41,1 41,49 5
Aydın 58 37,5 27,5 6
Balıkesir 100 39,36 27,55 7
Bartın 23 41,38 32,2 5
Batman 610 37,53 41,07 2
Bilecik 539 40,09 29,58 7
Bitlis 1794 38,28 42,09 3
Bolu 737 40,44 31,36 5
Burdur 957 37,43 30,17 1
Bursa 100 40,13 29 7
Çanakkale 5 40,08 26,33 7
Çorum 776 40,32 34,56 5](https://image.slidesharecdn.com/estimationofwindpowerdensitywithartificialneuralnetwork-170612080824/75/Estimation-of-wind-power-density-with-artificial-neural-network-2-2048.jpg)
![International Journal of Thales Natural Sciences (IJTNS)
34 | P a g e
www.thalespublisher.com
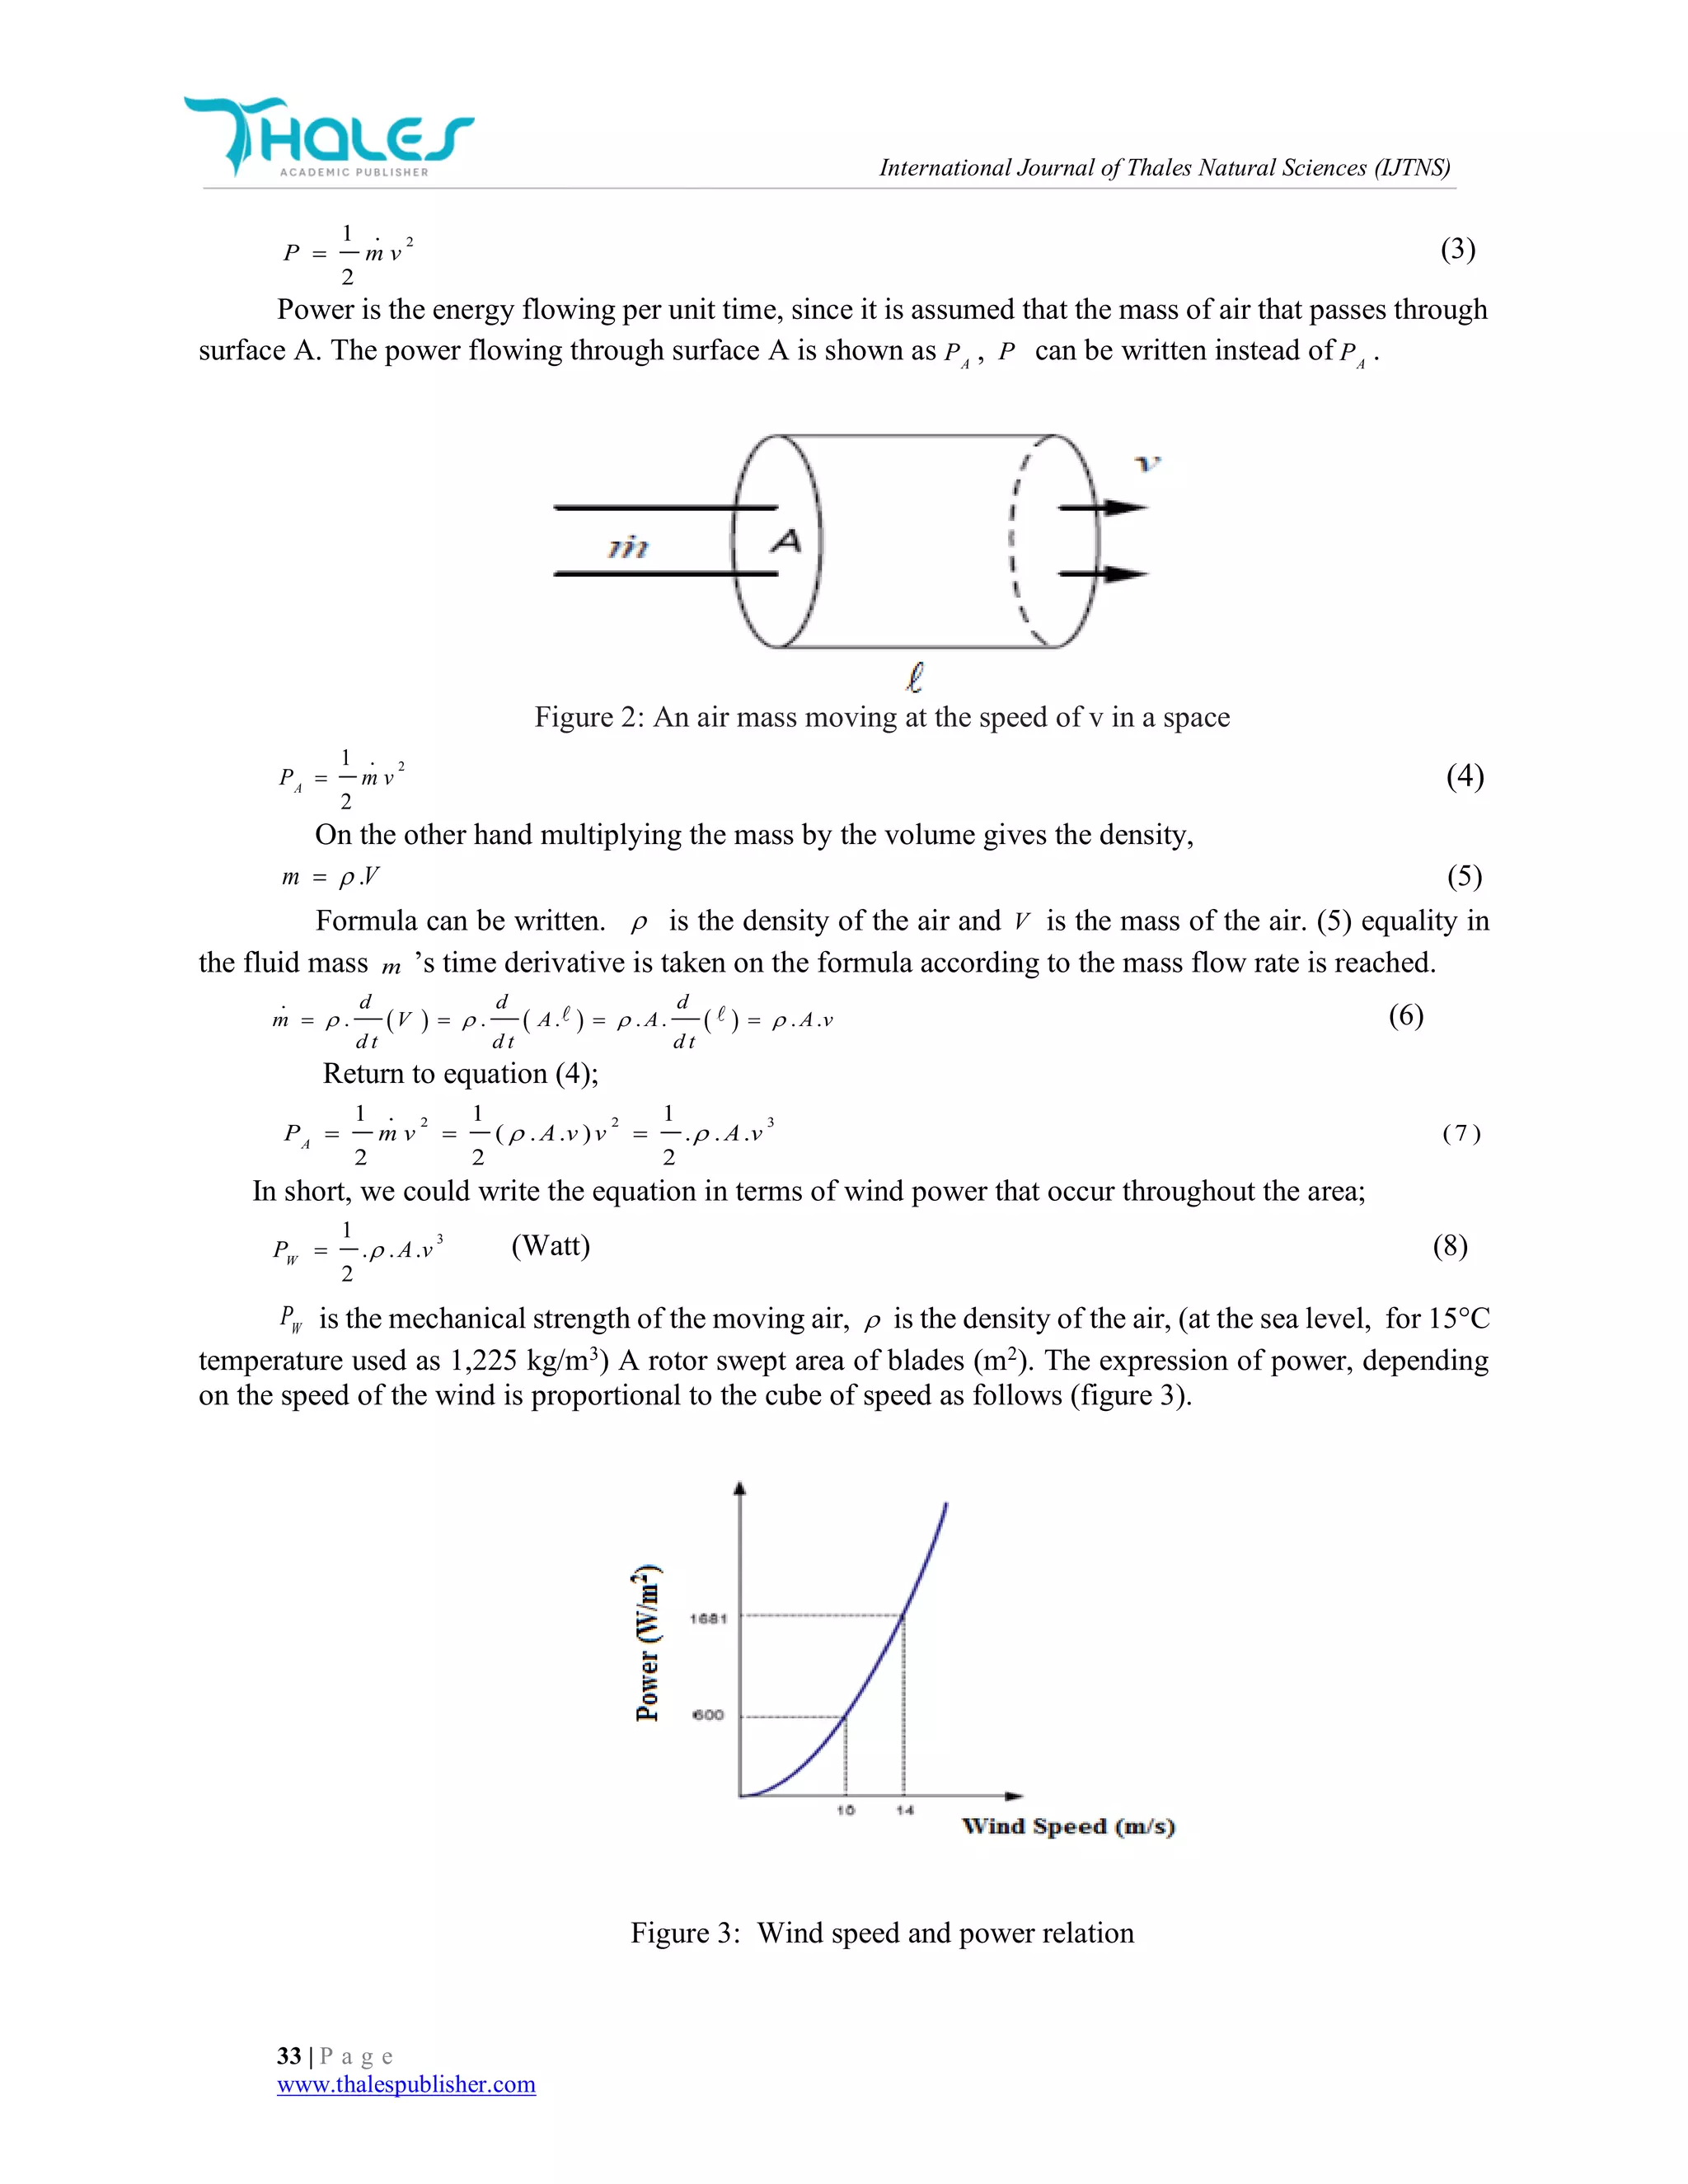
Here is the corresponding power unit is the power per m2
, and these are specific to a region of this
specific magnitude (custom) is referred to as power or power density. The power density of a region is
calculated by the following formula.
31
2
W
P
v
A
(9)
W
P
A
is the density of power and the unit’s is W/m2
[8].
3.2 The Effect Of The Temperature On The Air Density
Wind energy data is presented, air density is usually assumed that 1,225 kg/m3
. In other words,
temperature 15◦
C, pressure is 1 atmospheric pressure. Using the ideal gas law, air density can be calculated
easily under other conditions [8].
P.V=n.R.T (10)
In equation (10) P(atm) is pressure, V(m3
) is volume, n is number of moles, T (K) is absolute
temperature and R(K-1
. mol-1
.8,2056.10-5
m3
. atm) is the ideal gas constant.
Molecular weight of the gas (g/mol) is shown MA, air density is; (kg/m3
)
3
. .10n M A
V
(11)
Is calculated.
If V volume in equation (10) taking back, equation (11) is used, equation (12) expression is obtained.
3
. . 10P M A
R T
(12)
The molecular weight of air for the presence of the power density should be calculated. This is
performed by using this latest (12) of equality. A mixture of air molecules is composed of nitrogen
(78,08%), oxygen (20,95%), argon (% 0,93), carbon dioxide (% 0,035), neon (0,0018%) and similar
components. Equivalent molecular weight of air can be calculated by using the molecular weights of the
components (N2= 28,02 g/mol; O2= 32,00 g/mol; Ar =39,95 g/mol; CO2= 44,01 g/mol; Ne=20,18 g/mol).
Equivalent molecular weight of air have been obtained as (0,7808.28,02 + 0,2095. 32,00 + 0,0093. 39,95
+ 0,00035. 44,01 + 0,000018. 20,18 = 28,97 g/mol) [8]. This result is written in equation (12) instead of
MA. The measurement is made at the point wind speed, air pressure and temperature of the location using
the same equation is also related to the density of the air is calculated.
At 0°C the density of air is approximately %5 more than the density of air at 15°C and 1 atm (1,225
kg/m3
). PW 5 percent of the power will be greater because wind power is directly proportional to the air
density. Under the pressure of 1 atm, the density of air at various temperatures is shown in table 2.](https://image.slidesharecdn.com/estimationofwindpowerdensitywithartificialneuralnetwork-170612080824/75/Estimation-of-wind-power-density-with-artificial-neural-network-6-2048.jpg)
![International Journal of Thales Natural Sciences (IJTNS)
35 | P a g e
www.thalespublisher.com
Table 2 Air temperatures under 1 atm pressure the density of air change [8].
Temperature
(o
C)
Density (kg/m3
)
Density ratio for
temperature change
(KT)
-15 1,368 1,12
-10 1,342 1,10
-5 1,317 1,07
0 1,293 1,05
5 1,269 1,04
10 1,247 1,02
15 1,225 1
20 1,204 0,98
25 1,184 0,97
30 1,165 0,95
35 1,146 0,94
40 1,127 0,92
3.3 Wind Speed Power Equation
Depending on the height of the wind speed equation is given in the following figure.
(
𝑣
𝑣0
) = (
𝐻
𝐻0
)
𝛼
(13)
𝑣 is wind speed at H height, 𝑣0 is the wind speed at the 𝐻0 reference height. a is the coefficient of
friction. The coefficient of friction α, the topology of the surface of the ground exposed to the wind is a
coefficient. α refers to Hellman coefficient. This coefficient is given for different earth topologies in table
3 [8, 9, 10].
Because wind power varies with the cube of wind speed relative wind using equation (13) in the
height of power, the power at the 𝐻0 reference height as a function of can be found.
Wind speed varies depending on the geographical conditions and altitude of the measurement point.
A wind turbine is defined as the wind speed at the height of the desired tower;
𝑃
𝑃0
= (
𝑉
𝑉0
)
3
= [(
𝐻
𝐻0
)
𝛼
]
3
→
P
P0
= (
V
V0
)
3
= (
𝐻
𝐻0
)
3α
(14)
Table 3 The wind shear exponent α values of different surfaces [9].](https://image.slidesharecdn.com/estimationofwindpowerdensitywithartificialneuralnetwork-170612080824/75/Estimation-of-wind-power-density-with-artificial-neural-network-7-2048.jpg)
![International Journal of Thales Natural Sciences (IJTNS)
36 | P a g e
www.thalespublisher.com
Description of land The wind shear exponent values
Smooth, firm ground, lake, or ocean surface 0,10
Short grass on undeveloped land 0,14
The foot at the level of the floor covered with
grass
0,16
Shrubs, shrubbery, floor covered with trees 0,20
Floor covered with many trees and buildings 0,22 – 0,24
The edge of the small town of woodland and
neighbourhood
0,28 – 0,30
Tall buildings in urban centres 0,4
3.4 Cell Of ANN
The basic biological neuron that has much complex structure compared to cell of Ann information
processing systems. The basic elements of artificial neural networks in biological neural networks, neural
cell. Artificial neural cells are the basic information processing unit in ANN process. All neurons within
the network receive one or more input and they give a single output. This output may be given as the output
of the neural network can be used as input to other neurons. An artificial cell model consists of 5
components. These are; inputs, weights, function of combination, activation function and output [11].
Data that is received from the external environment connects to neuron by the weights. These weights
determine the impact of the corresponding entry. The total function calculates the net input. The net input,
inputs, and these inputs are result of multiplying the corresponding weights. The activation function
calculates the net output during the process and this process at the same time, the output of the neuron. The
bias with a constant b can be expressed. Concept of bias is referred as the activation function of the threshold
value. In figure 4 simple structure of artificial neural cells (neurons) is shown.
Figure 4: A simple artificial neuron structure [12].](https://image.slidesharecdn.com/estimationofwindpowerdensitywithartificialneuralnetwork-170612080824/75/Estimation-of-wind-power-density-with-artificial-neural-network-8-2048.jpg)
![International Journal of Thales Natural Sciences (IJTNS)
37 | P a g e
www.thalespublisher.com
3.5 Analyses Of The Data
Calculated all scale takes the numeric property based on each numeric feature expressed by a volume.
The calculated values are done according to the standard criteria of the reviews by the critics. The results
of the evaluation of the measurement according to the calculated values according to the nature of the
discipline had reached the decision that the desired goal is reached. The values estimated in the studies for
checking and verification purposes, compared with the actual values. Various statistical rules have been
developed for comparison. These rules can be written as following;
1. , i
v is the cluster of the real values, i
e is the cluster of predicted values, v is the
average of the actual values and e is the average of the predicted values, v
standart deviation of
the real values and e
standard deviation of the predicted values. The difference between v and
e is called ‘trend’ (slip). Briefly, the estimated value is the difference between the actual value
[13].
2. Linear correlation coefficient R , is given as equation (15) [14].
1
( )( )
n
i i
i
v e
v v e e
R
n
(15)
R shows that the relation of the predicted value the actual value. New formulas can be produced
according to this relationship. However, in these calculations is not sufficient for the evaluation of the
success. Obtained in the first calculation of the error rate is quite high because although the rate of
encountering a similar error in other calculations, the correlation coefficient can be quite successful [15].
The root mean square error (RMSE), equality is calculated with a mathematical formula given in (16)
RMSE is the differentiate between the real value and the predicted value is considered to be a precise
measurement. The accuracy of the value obtained in the following formula and values are evidence of the
success predicted to be small.
1
2 2
1
1
( )
n
i i
i
R M S E e v
n
(16)
3. In comparison of the actual values with predicted values average bias error (MBE) is expected low
value. Ideal MBE would be expected to close to zero. The MBE value may be positive or negative.
This doesn't matter. MBE value is calculated by the equality (17) [16].
MBE
1
1
n
i i
i
e v
n
(17)
4 RESULTS AND DISCUSSIONS
In this study, artificial neural network method has been used to estimate the wind power density.
First of all, retrieved wind speeds from a height of 2 m from Turkish State Meteorological Service and
Hellman coefficient values in table 3. The wind speed at a height of 50 m has been calculated by using (13)
equation. The air density at the corresponding location has been obtained using equation (12). The wind
power density values are calculated by using wind speed and air density in (9). The wind power density
datas which obtained fifty-eight city centers in Turkey between 1980-2013 years are calculated for ANN
studies. The data in 1980-2010 were used for training models. The accuracy of models generated with the
data 2011-2013 has been tested. The ANN models used in the study consist of input layer, hidden layer and
output layer. In this study, wind power density (W/m2
) obtained as output parameter while the month,
ni ..............1](https://image.slidesharecdn.com/estimationofwindpowerdensitywithartificialneuralnetwork-170612080824/75/Estimation-of-wind-power-density-with-artificial-neural-network-9-2048.jpg)
![International Journal of Thales Natural Sciences (IJTNS)
43 | P a g e
www.thalespublisher.com
REFERENCES
[1] Yıldız T, 2011 Energy and Natural Resources Ministry Turkey Energy Policies Ankara,
Turkey November 1.
[2] Kjærland F, 2007 A real option analysis of investments in hydropower the case of Norway,
Energy Policy 35 pp 5901-5908.
[3] Lee S C, 2011 Using real option analysis for highly uncertain technology investments: The case
of wind energy technology Renewable and Sustainable Energy Reviews,
doi:10.1016/j.rser.2011.07.107 London-UK.
[4] Ilkılıç C, 2012 Wind energy and assessment of wind energy potential in Turkey Renewable and
Sustainable Energy Reviews, 16 pp 1165– 1173.
[5] Köse R Özgür M Arif E O and Tugcu A, 2004 The analysis of wind data and wind energy
potential in Kutahya, Turkey Renewable and Sustainable Energy Reviews 8 pp.: 277– 288.
[6] Bayraç H N, 2011 Global Wind Energy Policies and Practices, Uludağ University Economics
and Administrative Sciences Magazine pp 37-57.
[7] Öner Y Özçira S Bekiroglu and N Senol I, 2013 A comparative analysis of wind power
density prediction methods for Çanakkale, Intepe region, Turkey Renewable Sustainable Energy
Reviews 23 pp 491-502.
[8] Masters G M, 2004 Renewable and efficient electric power systems John Wiley and Sons,
ISBN 0471280607 pp 312-319.
[9] Bansal R Bati T S and Kothari D P, 2002 On Some of the Design Aspects of Wind Energy
Conversion Systems Energy Conversion and Management 43 pp. November, 2175–2187.
[10] Patel M R, 2006 Wind and solar power systems: design analysis, and operation 2nd ed. CRCPress
ISBN 0849315700.
[11] Boztepe M, 2009 The Captured Power From The Wind (Mechanical Power), Wind and Solar
Power Systems pp 9-19.
[12] Saraç T, 2004 Neural Networks, Gazi University Industrial Engineering Department Seminar
Project.
[13] Chand S and Lan M, 1990 Neural Network Augmented Control for Nonlinear Systems Proc. of
the 29th Conf. CDC pp 1732-1734.
[14] Laurent H Jobard I Toma A, 1998 Validation of satellite and ground based estimates of
precipitation over the Sahel Atmospheric Research pp 47-48,651-670.
[15] Kendall M G and Stuart A, 1963 The Advanced Theory of Statistics Griffin Pres.
[16] Katiyar K Kumar A Pandey C K and Das B, 2010 A comparative study of monthly mean
daily clear sky radiation over India International Journal of Energy and Environment 1
pp 177–182.](https://image.slidesharecdn.com/estimationofwindpowerdensitywithartificialneuralnetwork-170612080824/75/Estimation-of-wind-power-density-with-artificial-neural-network-15-2048.jpg)


![Wind Energy in Turkey_ Potential and Development[#496377]-595454 (1).pdf](https://cdn.slidesharecdn.com/ss_thumbnails/windenergyinturkeypotentialanddevelopment496377-5954541-241009123908-7e82f64c-thumbnail.jpg?width=640&height=640&fit=bounds)


