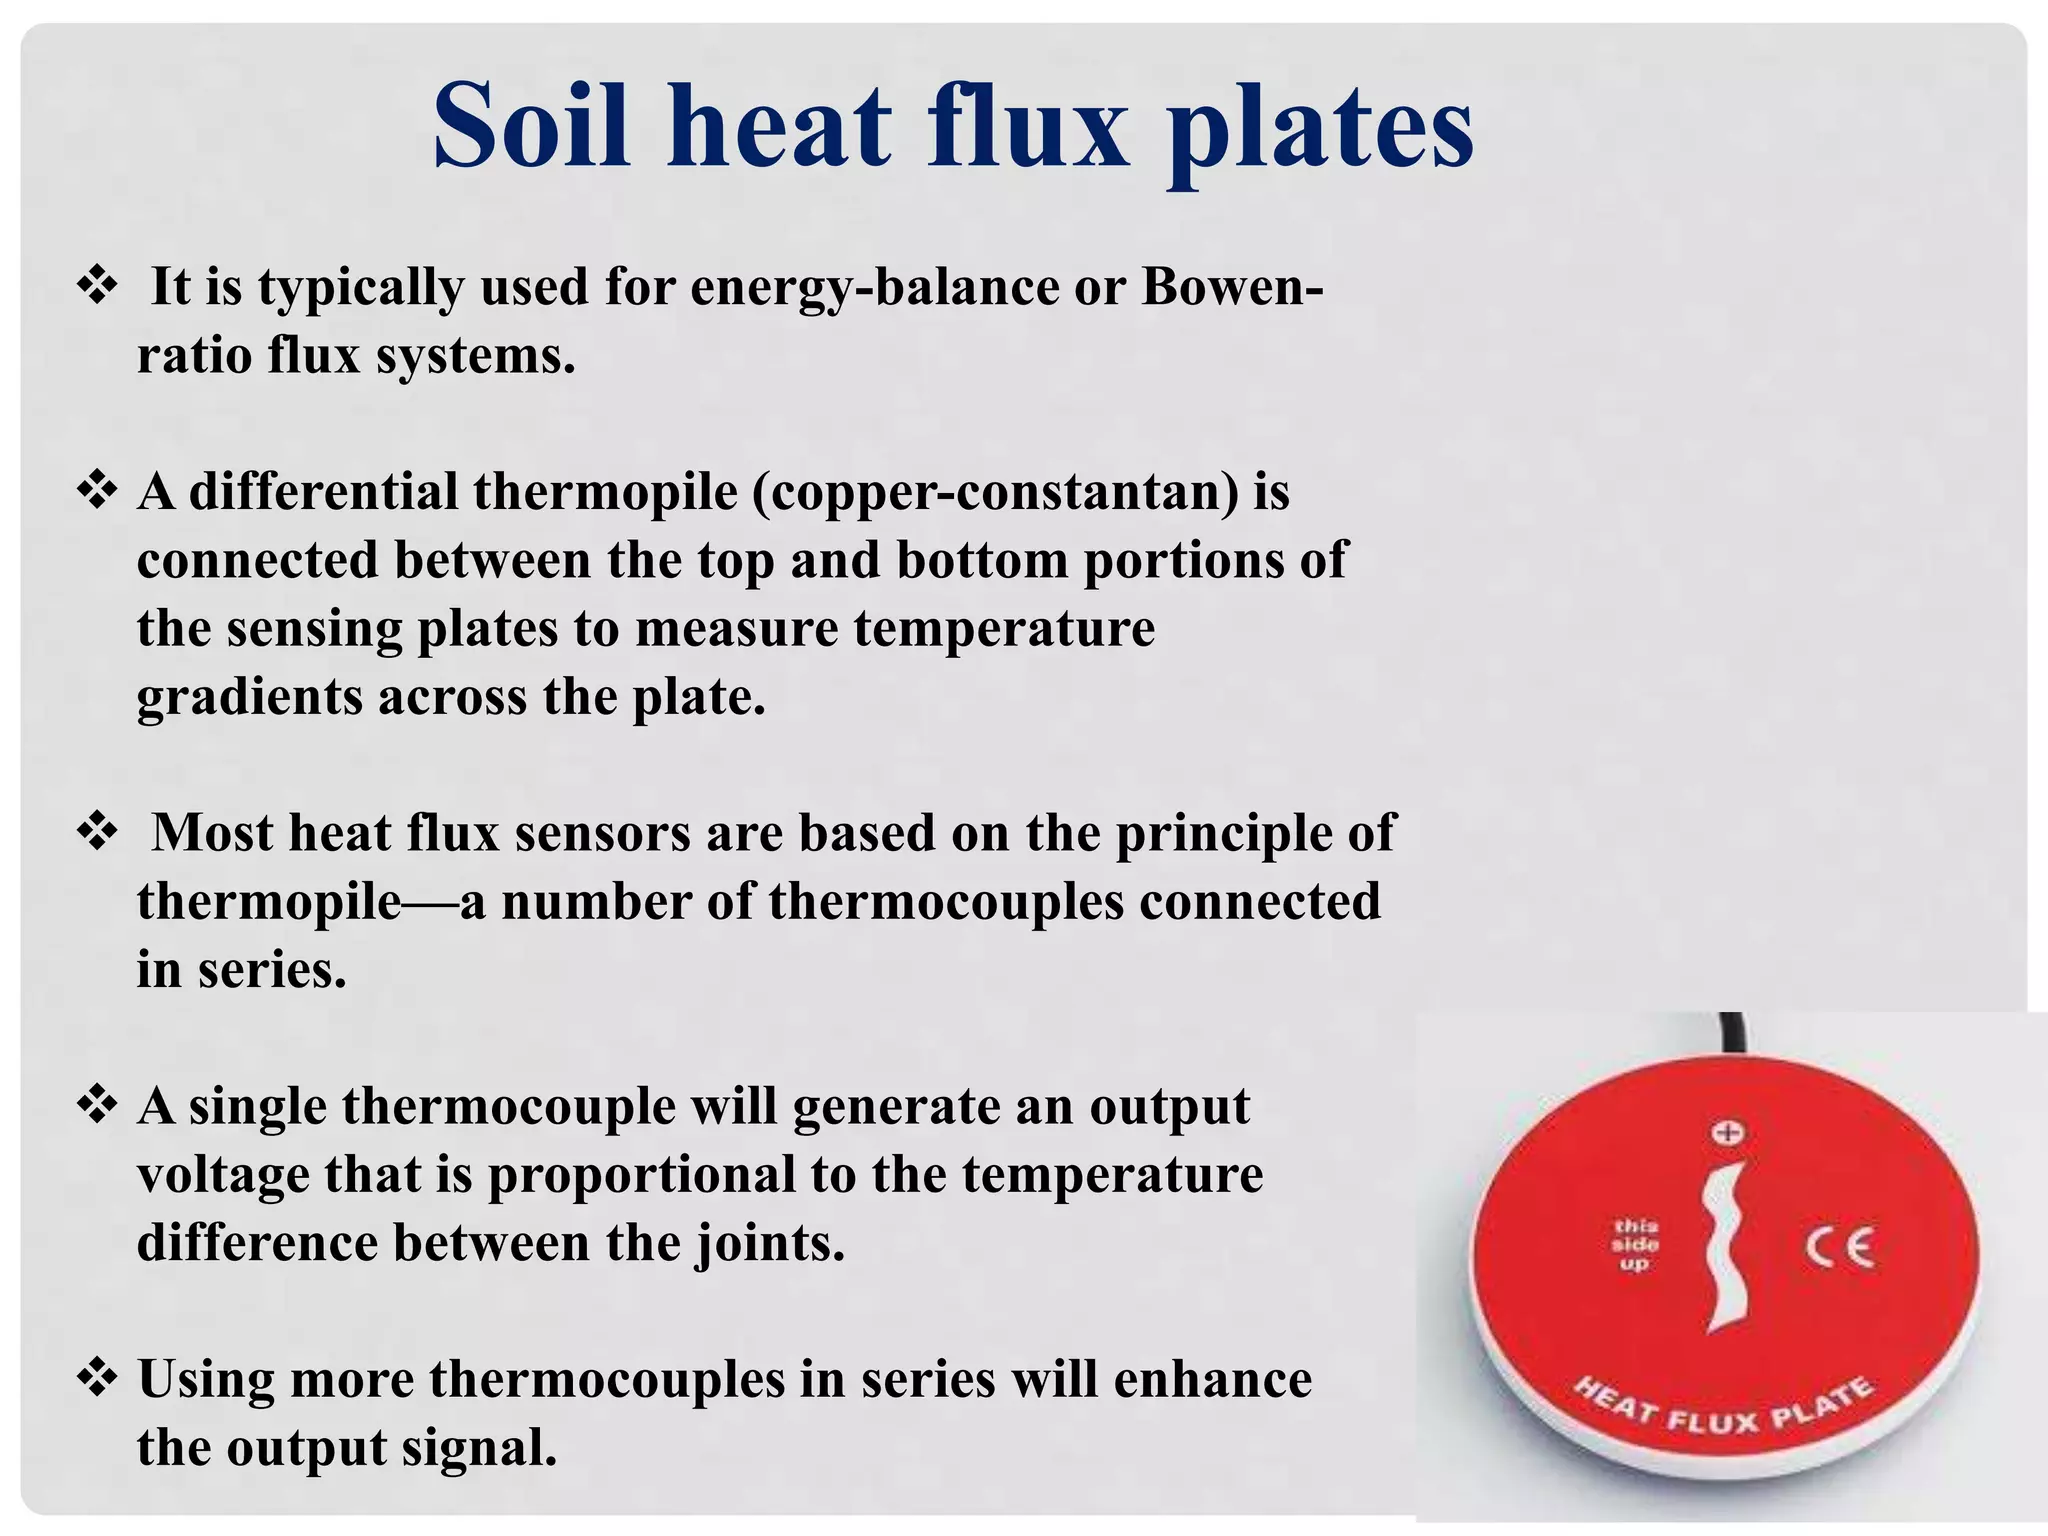
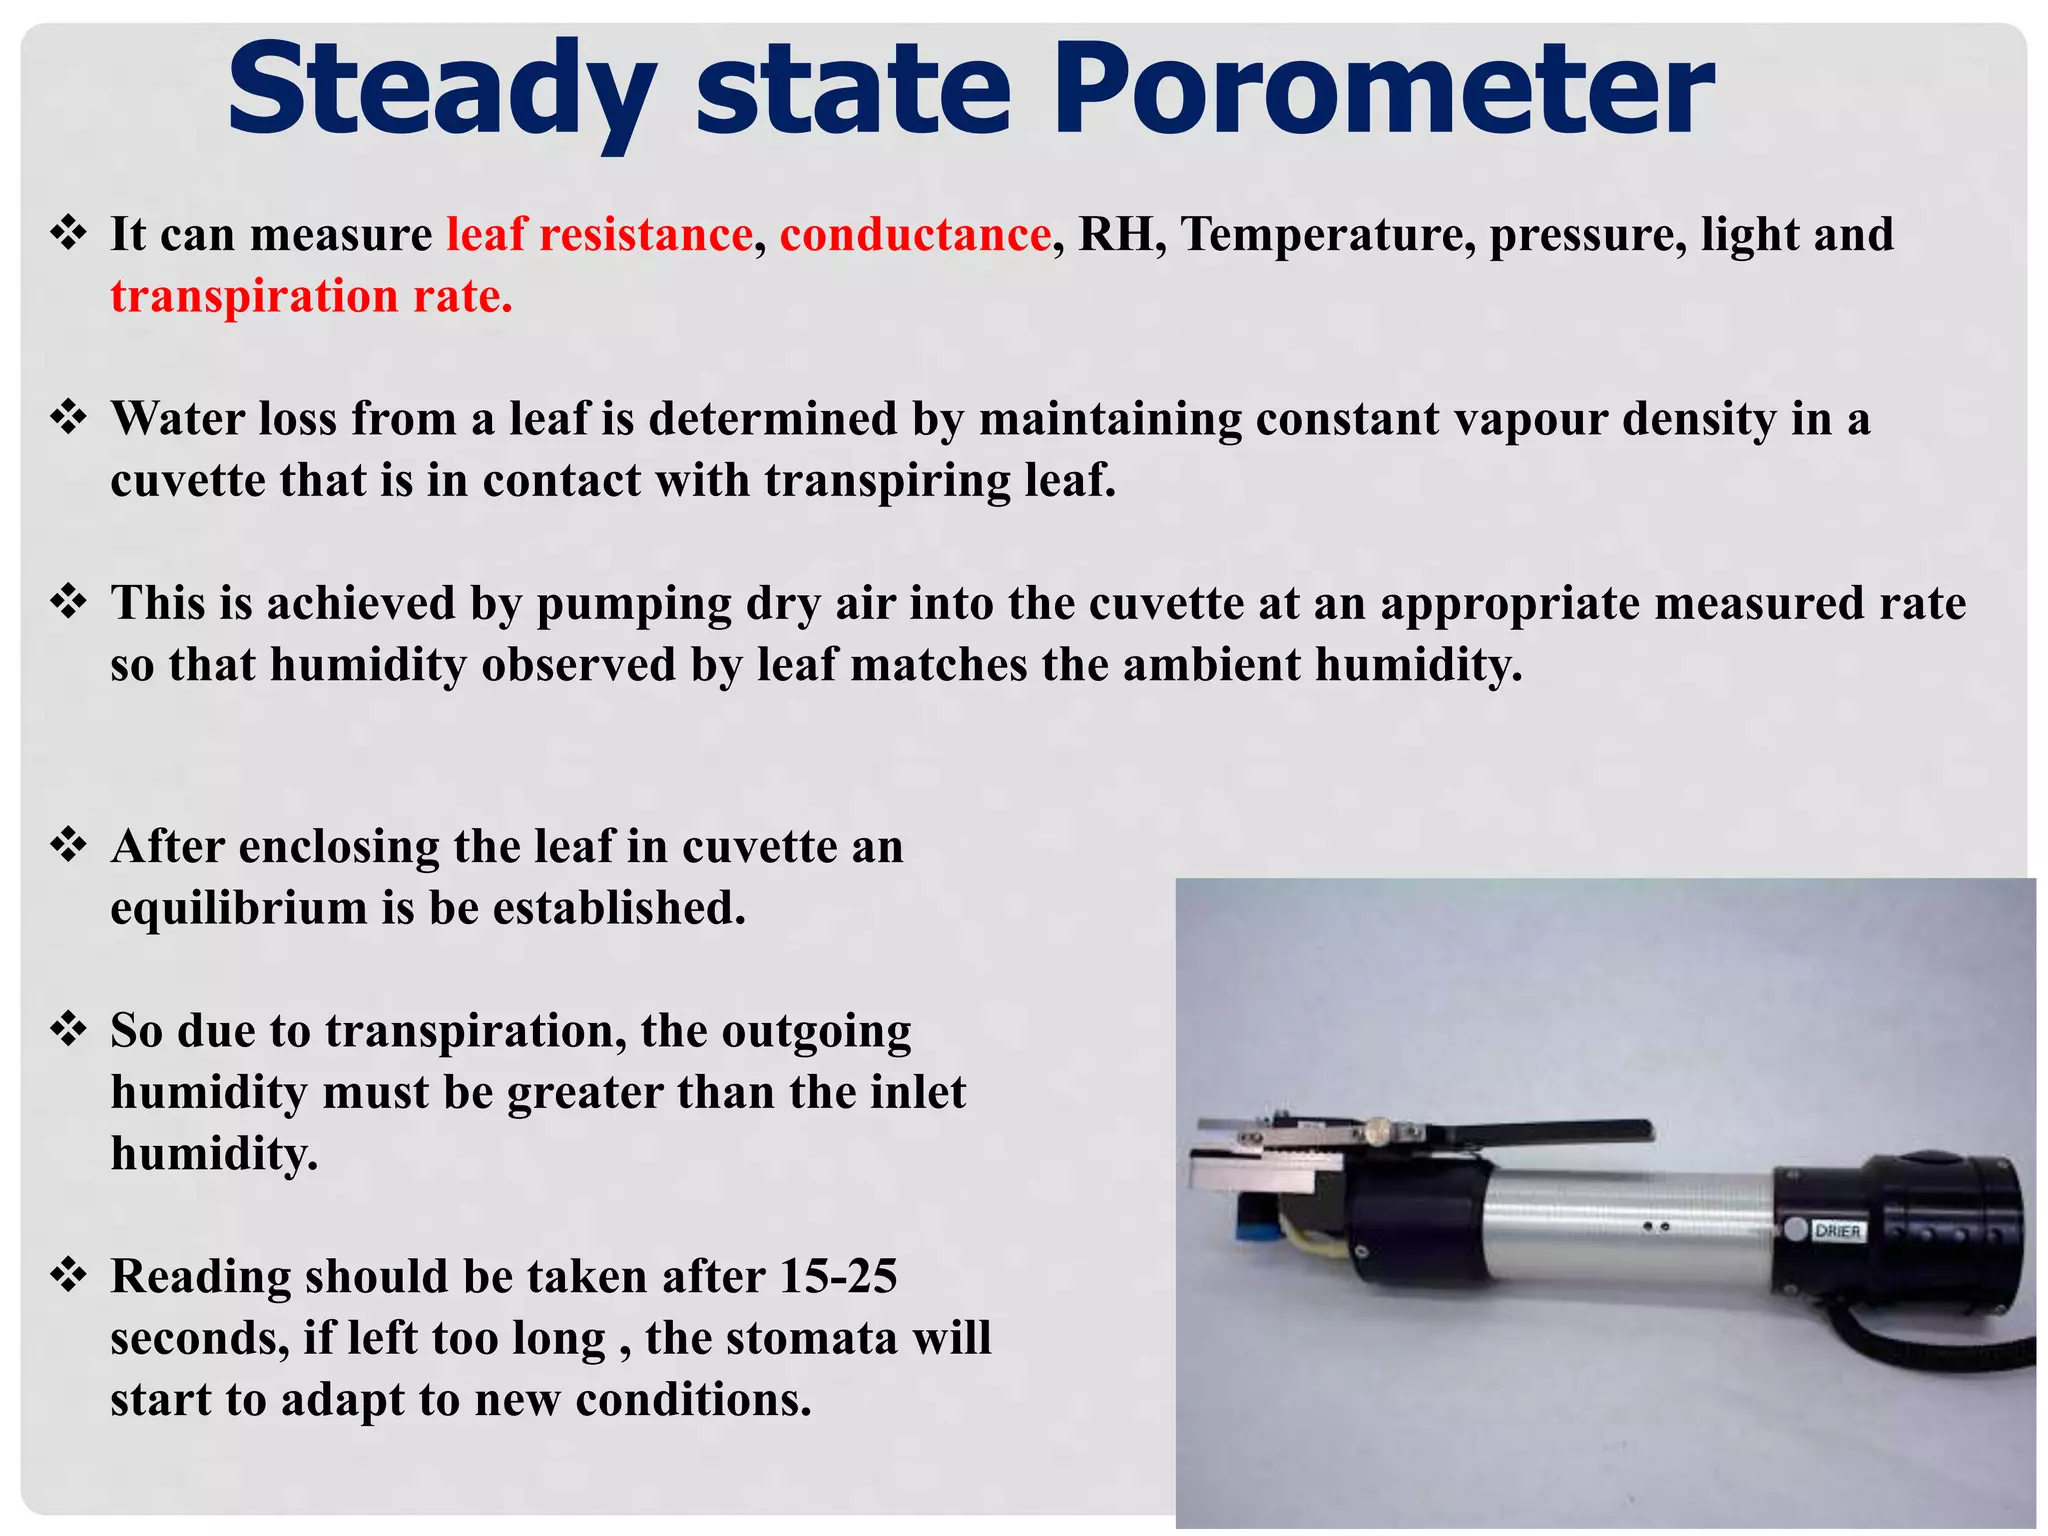
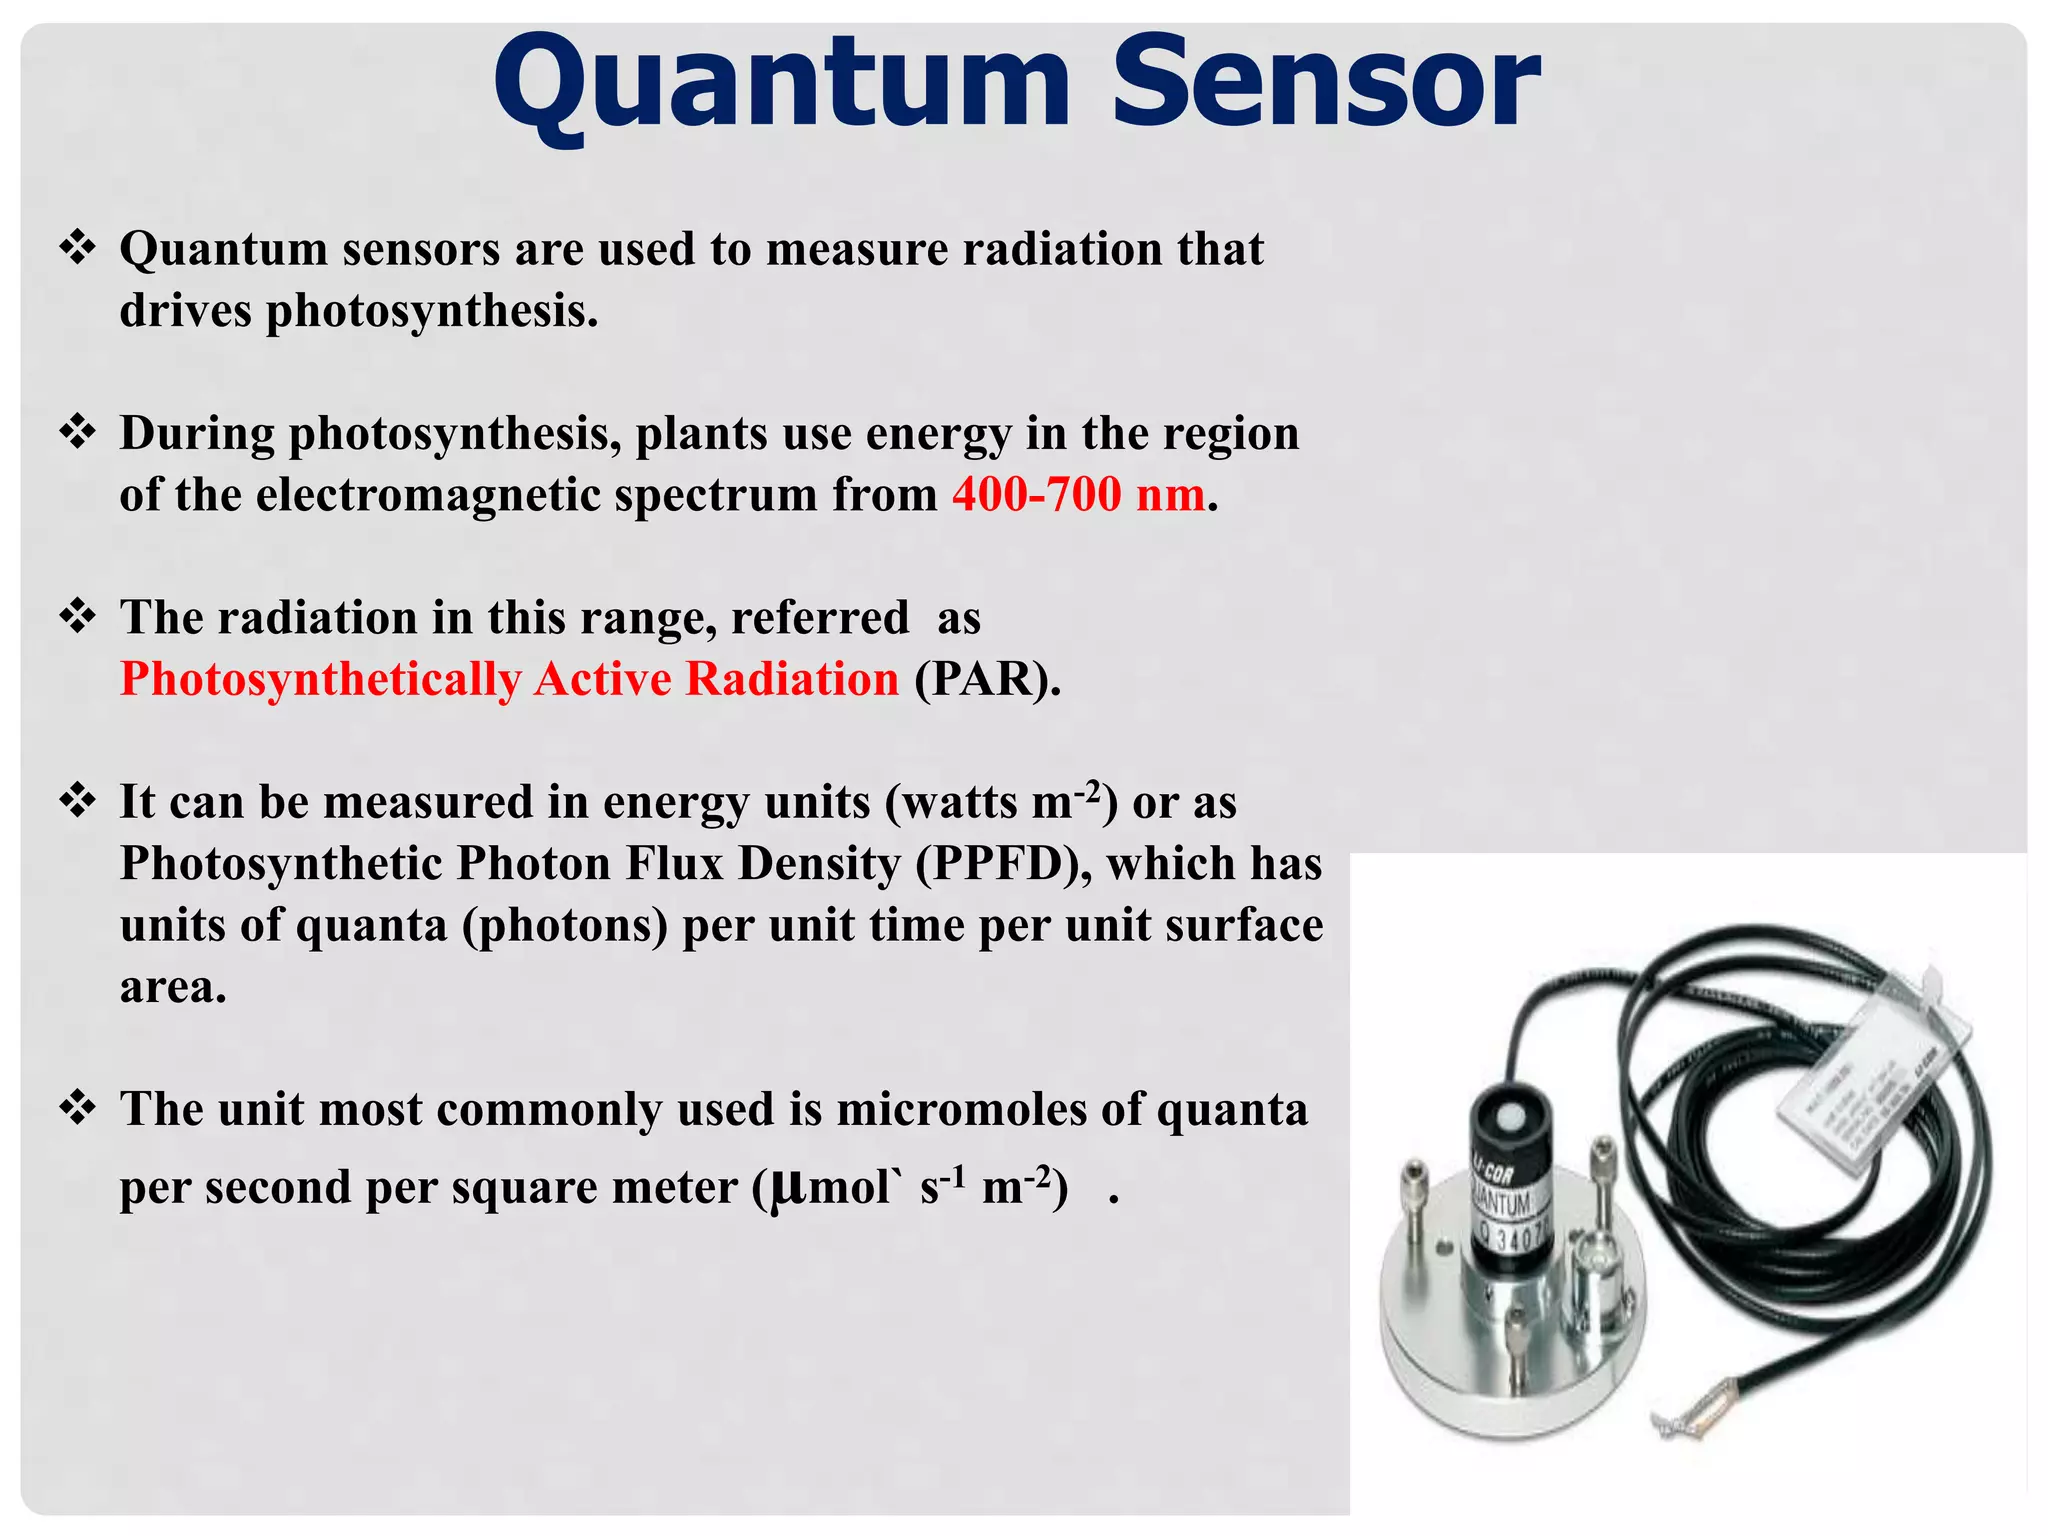
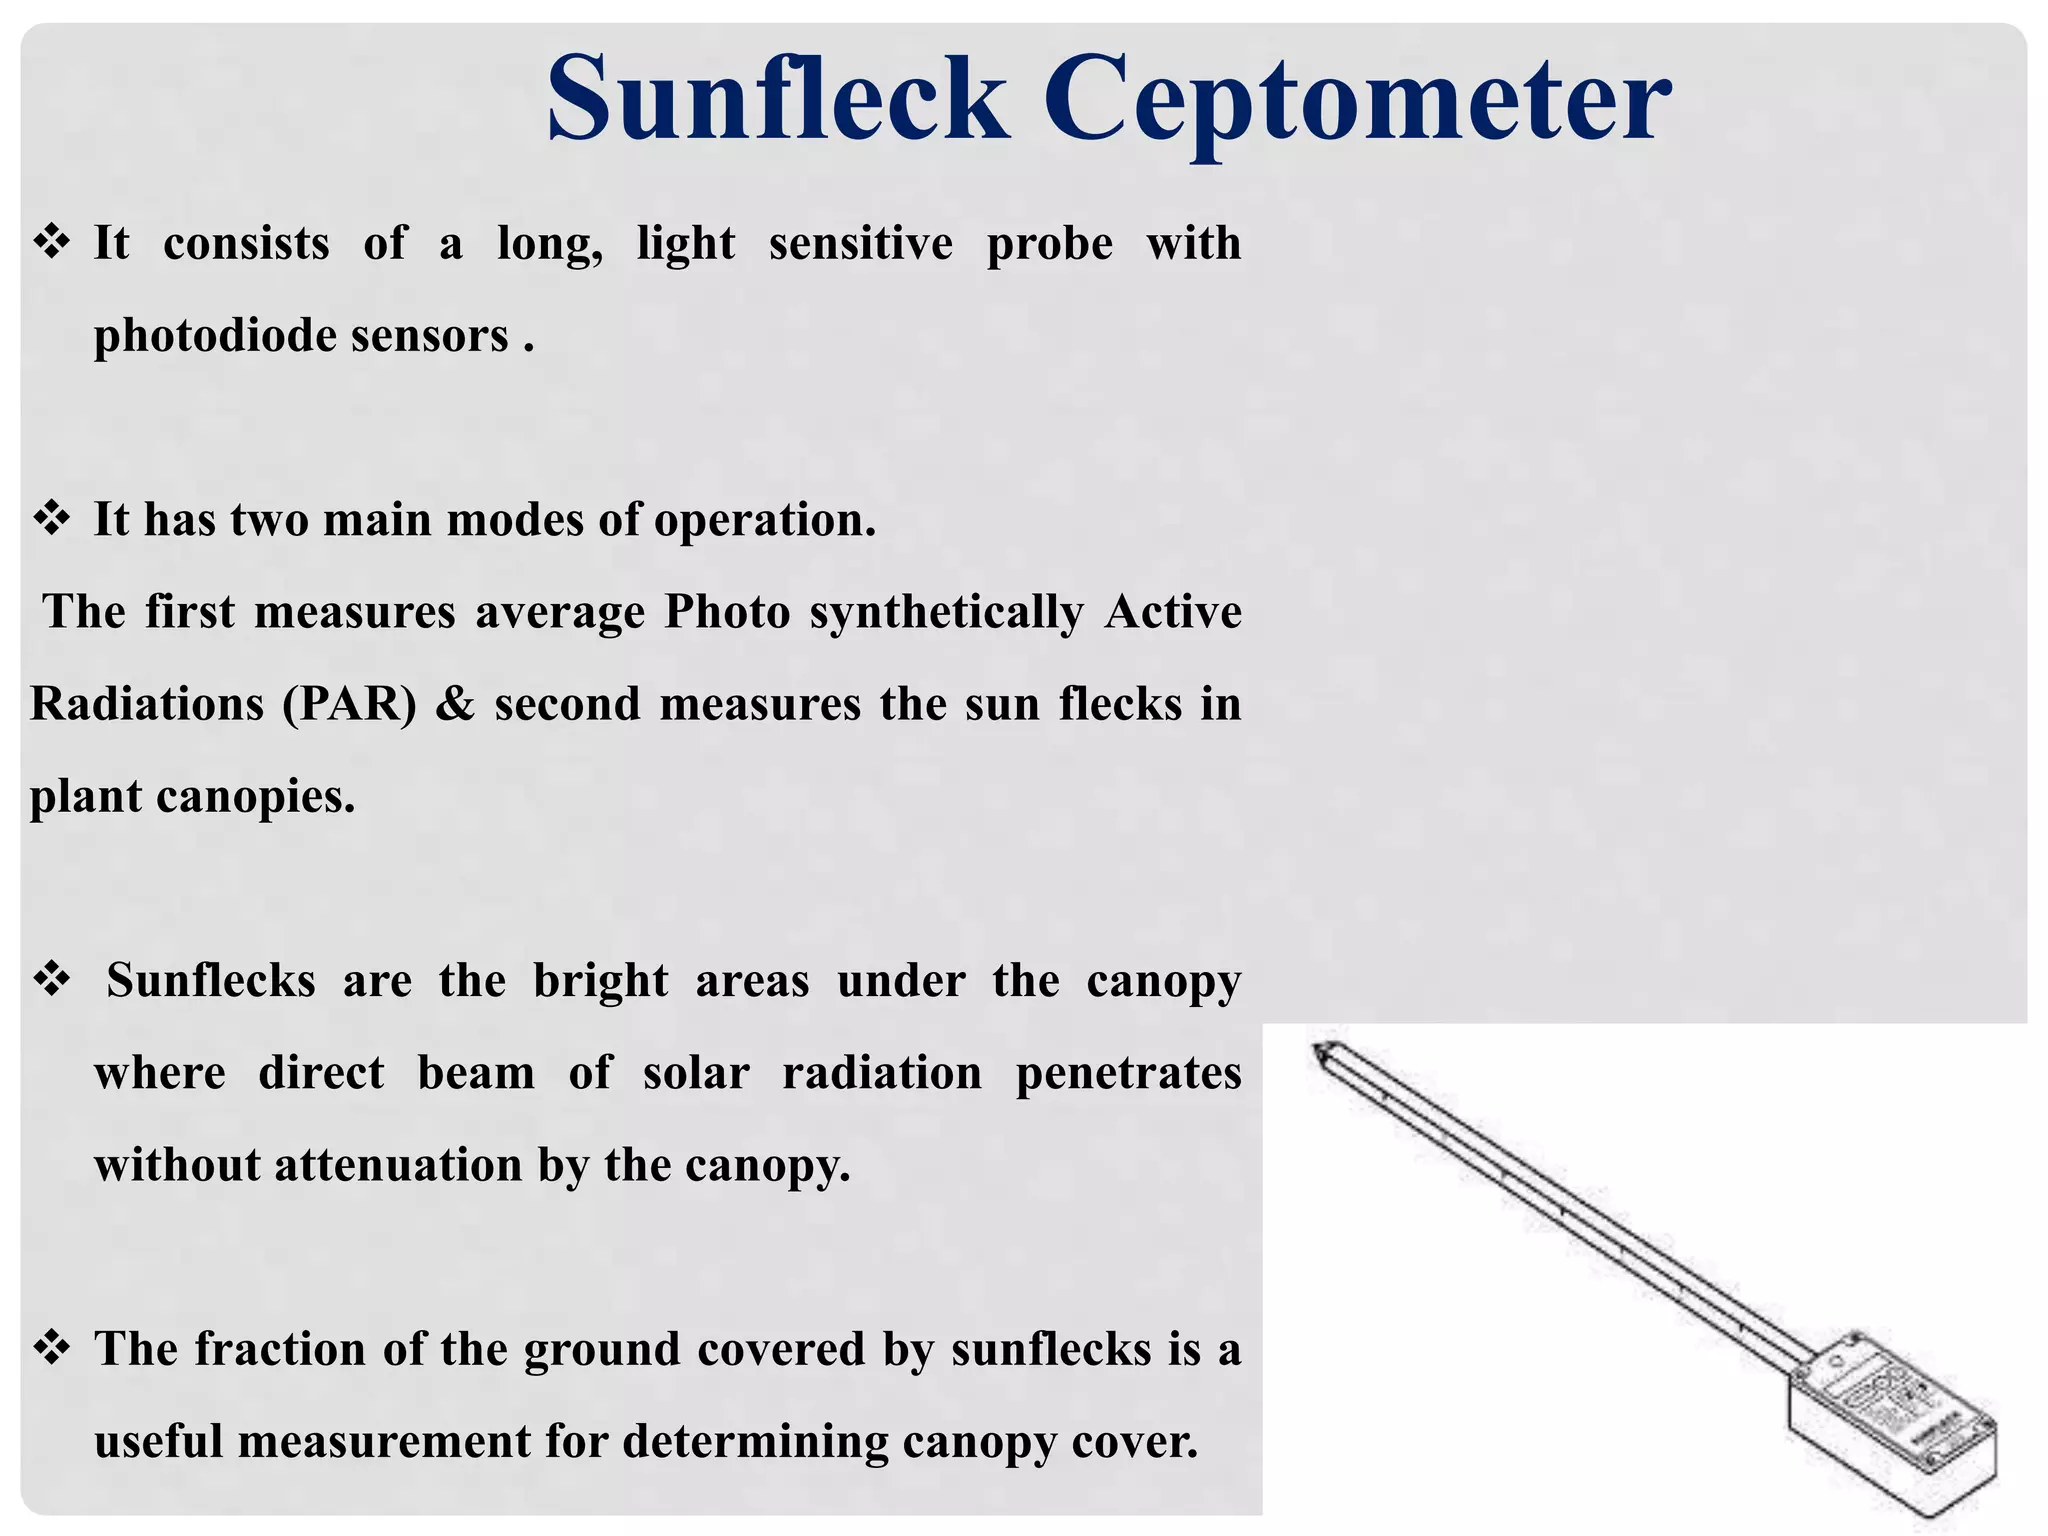
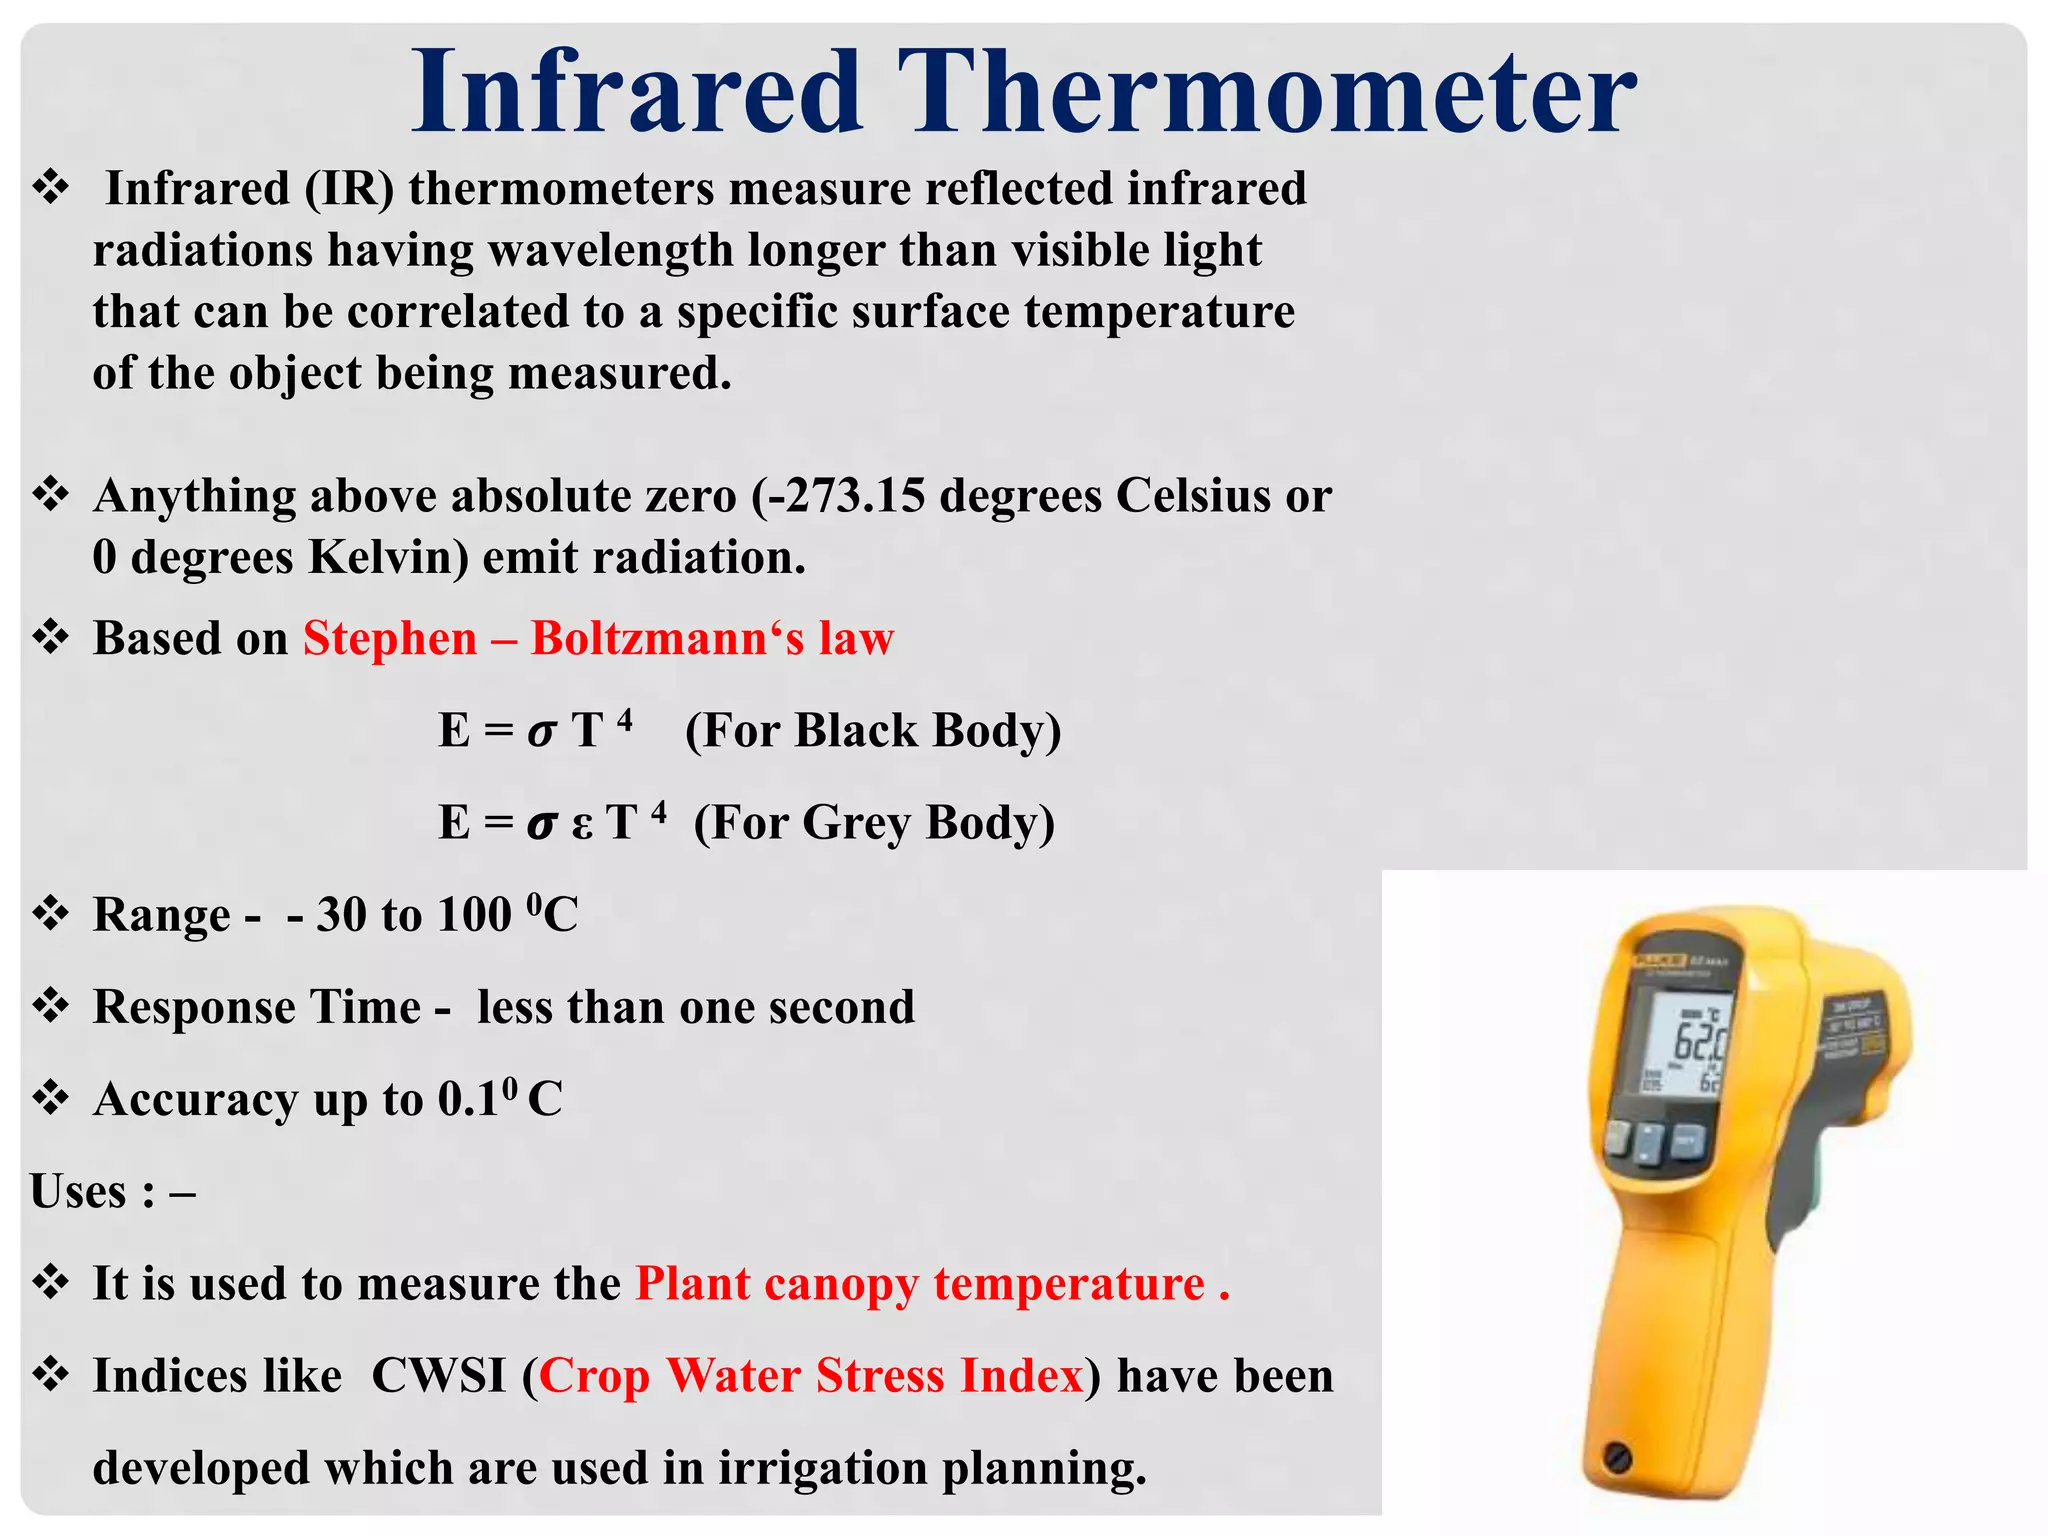
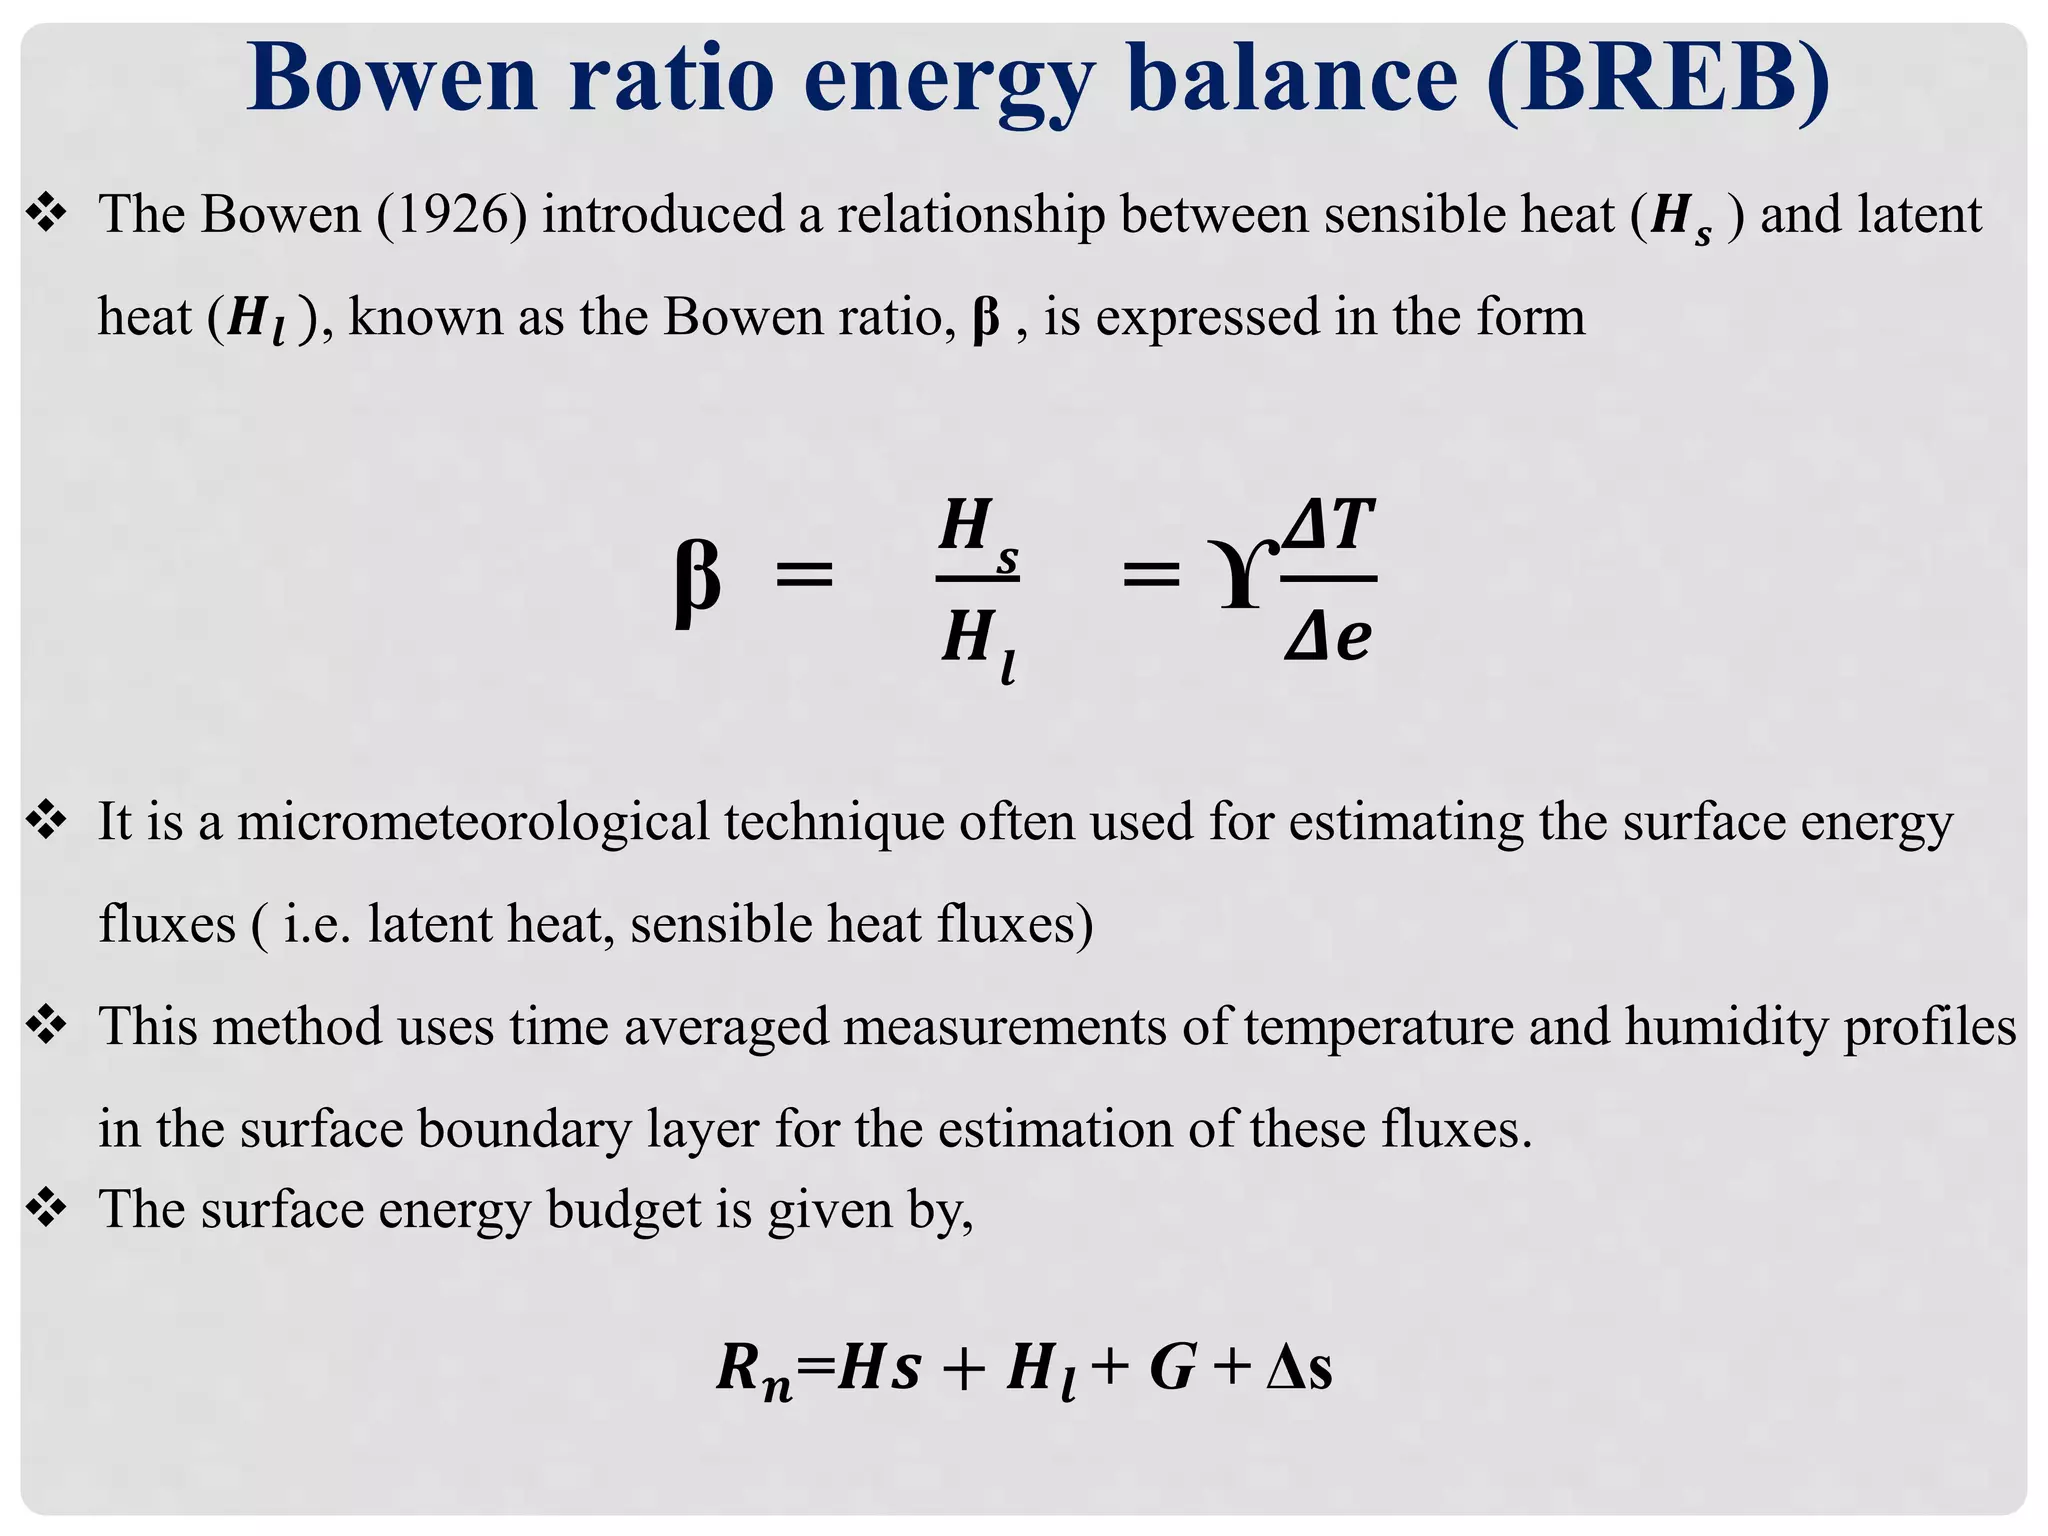
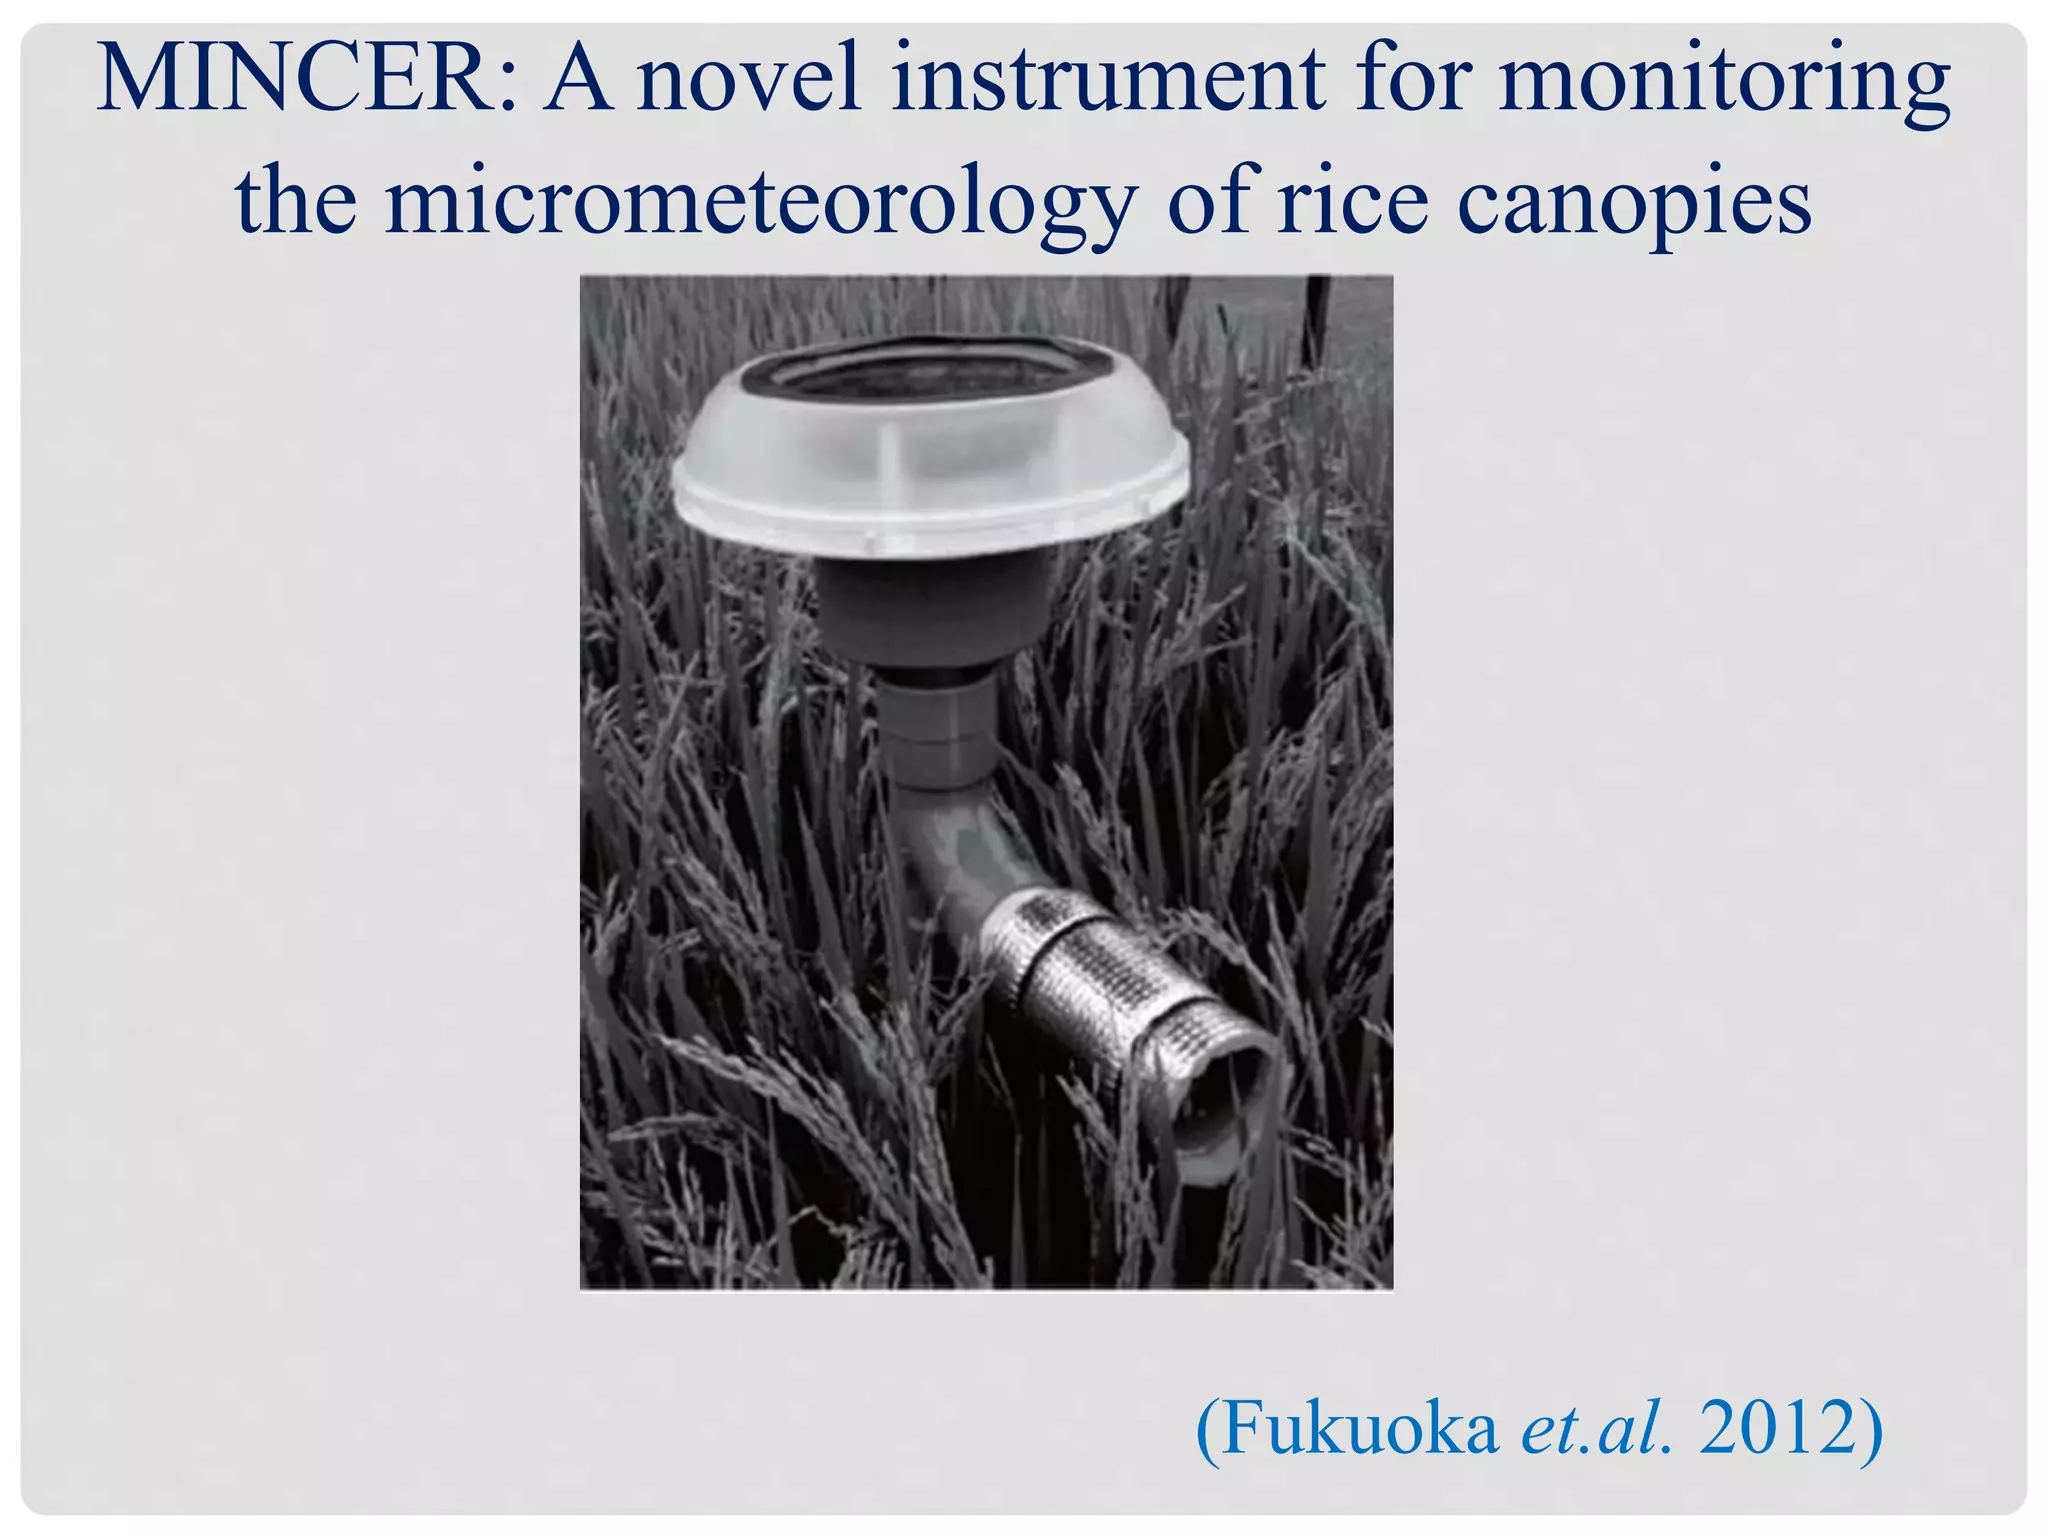
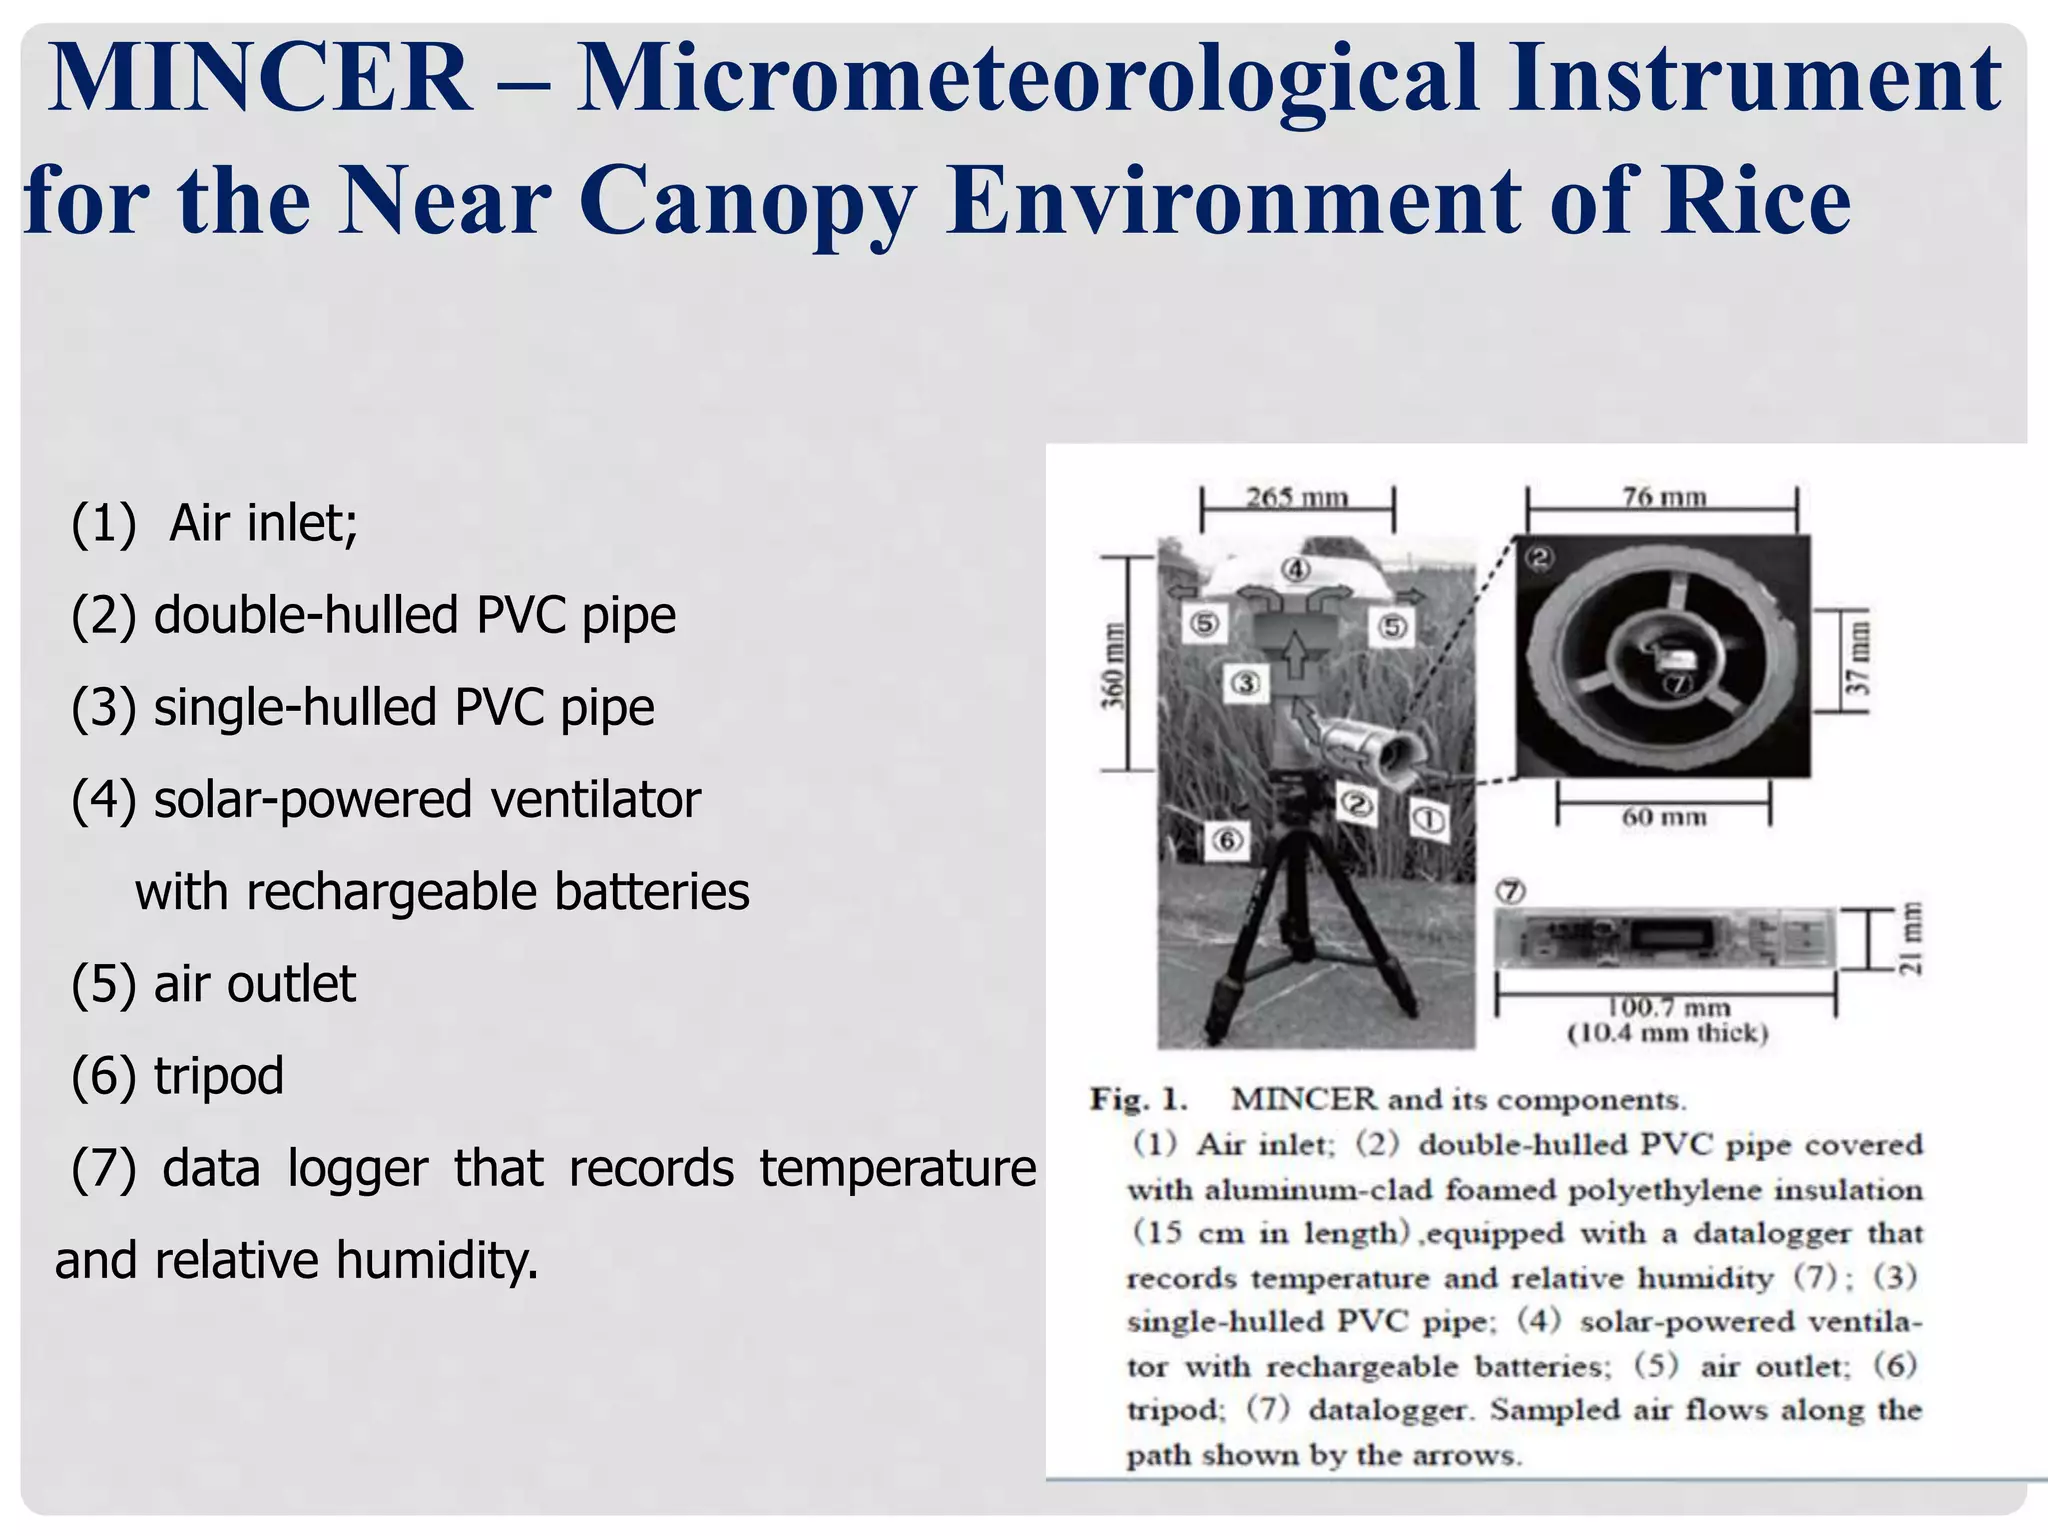
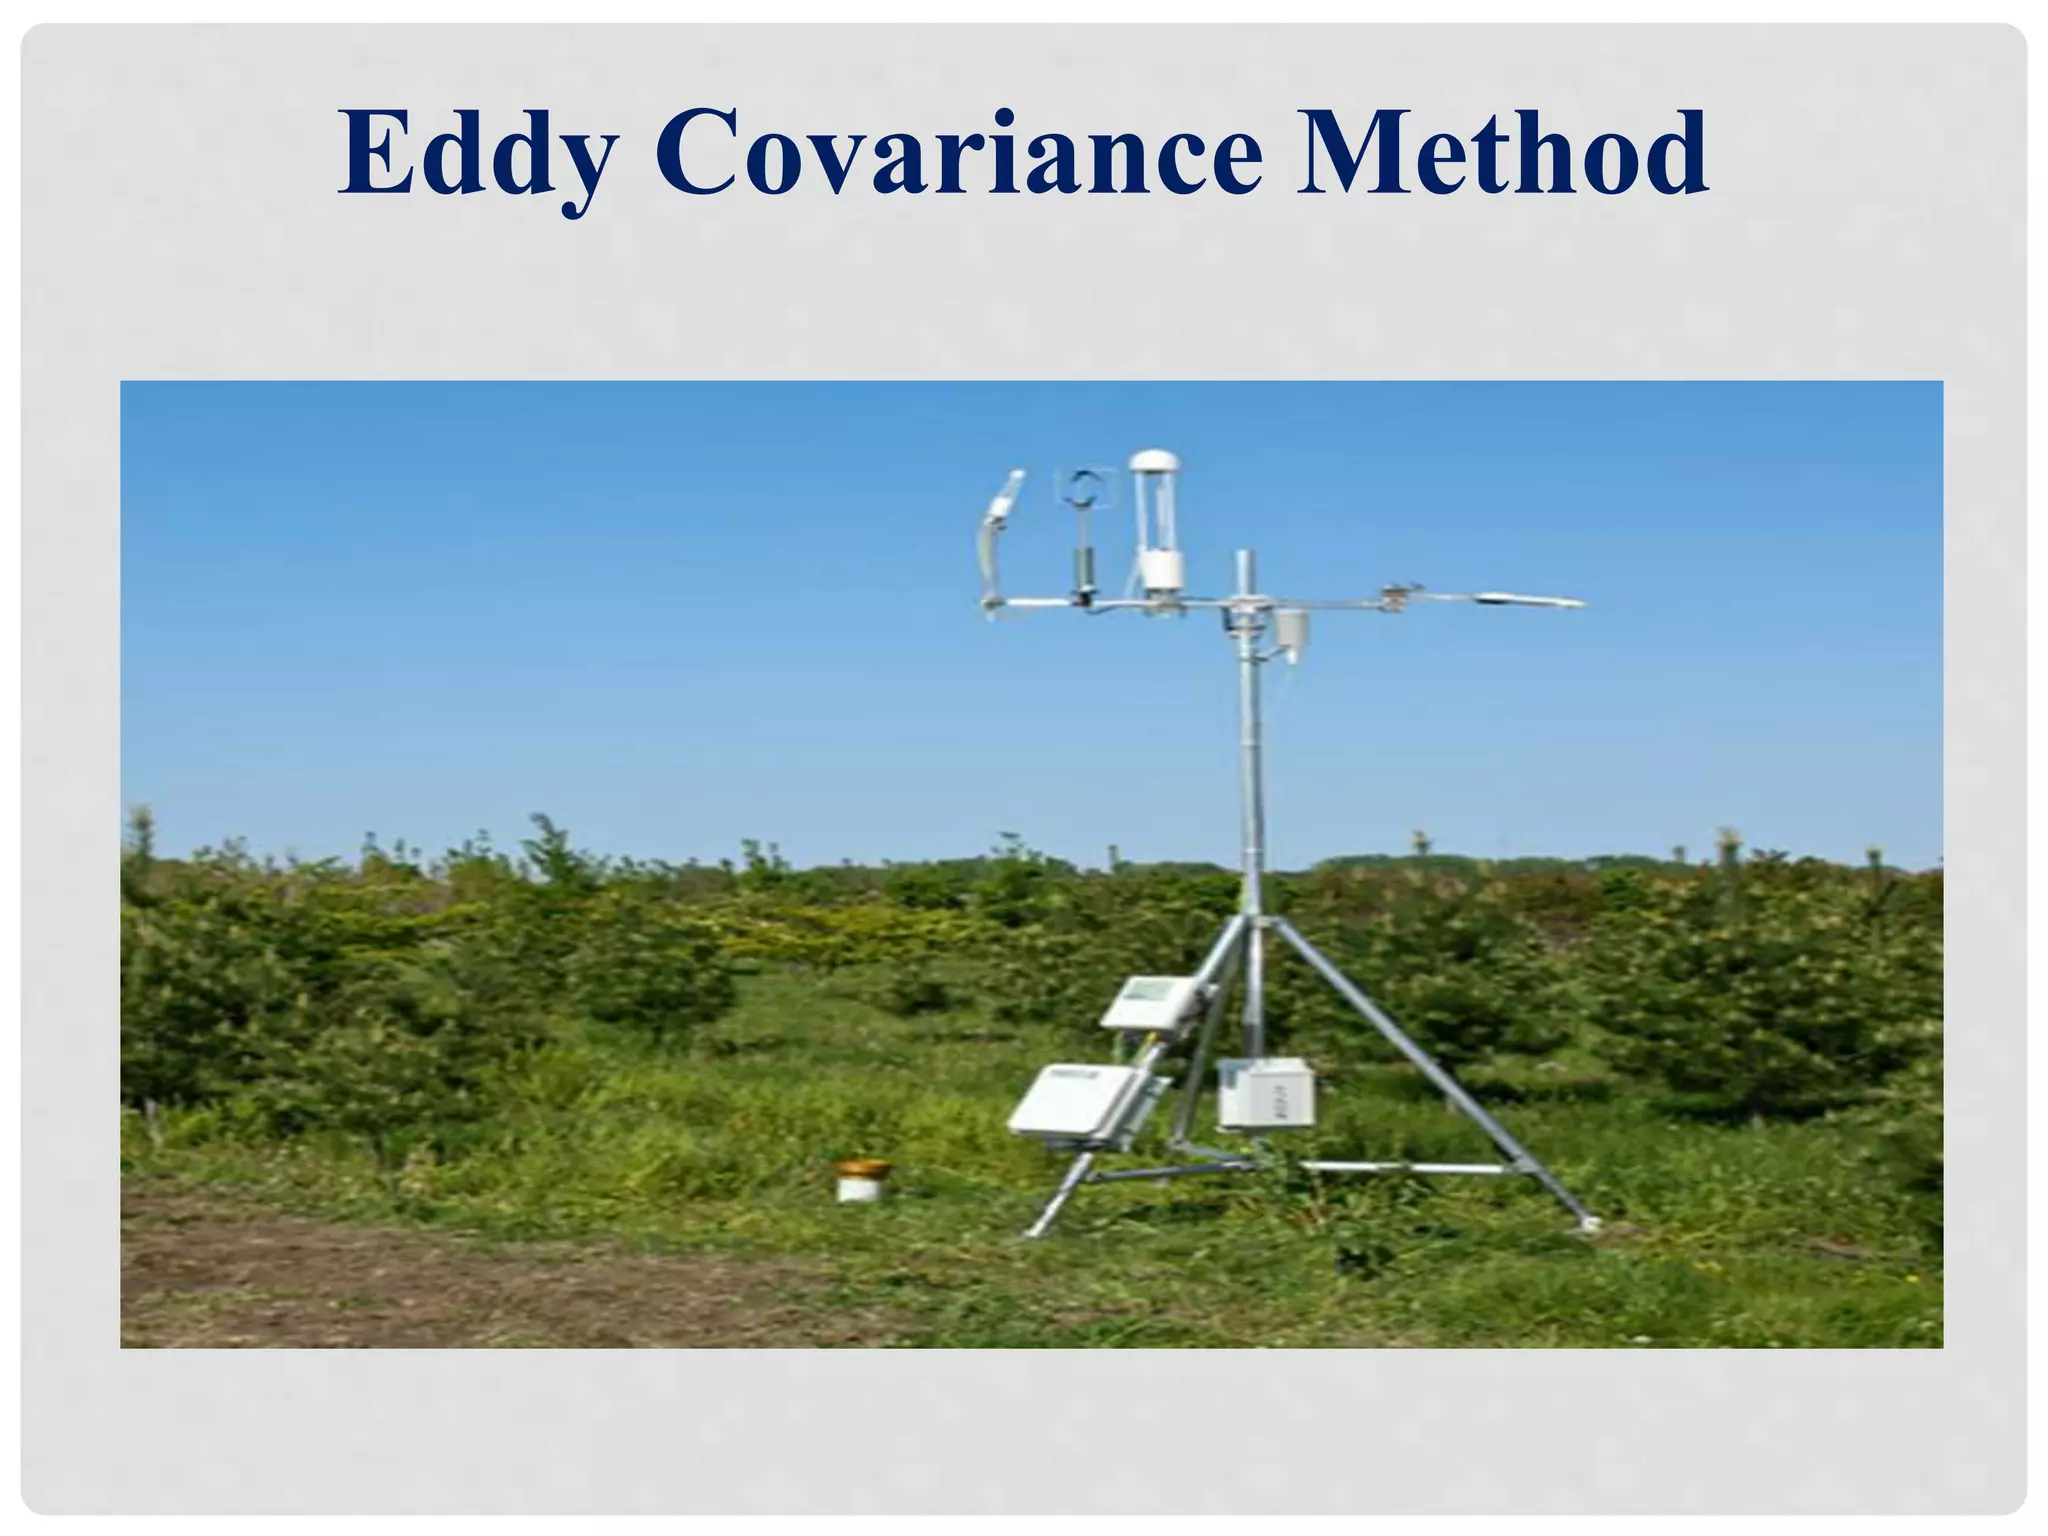
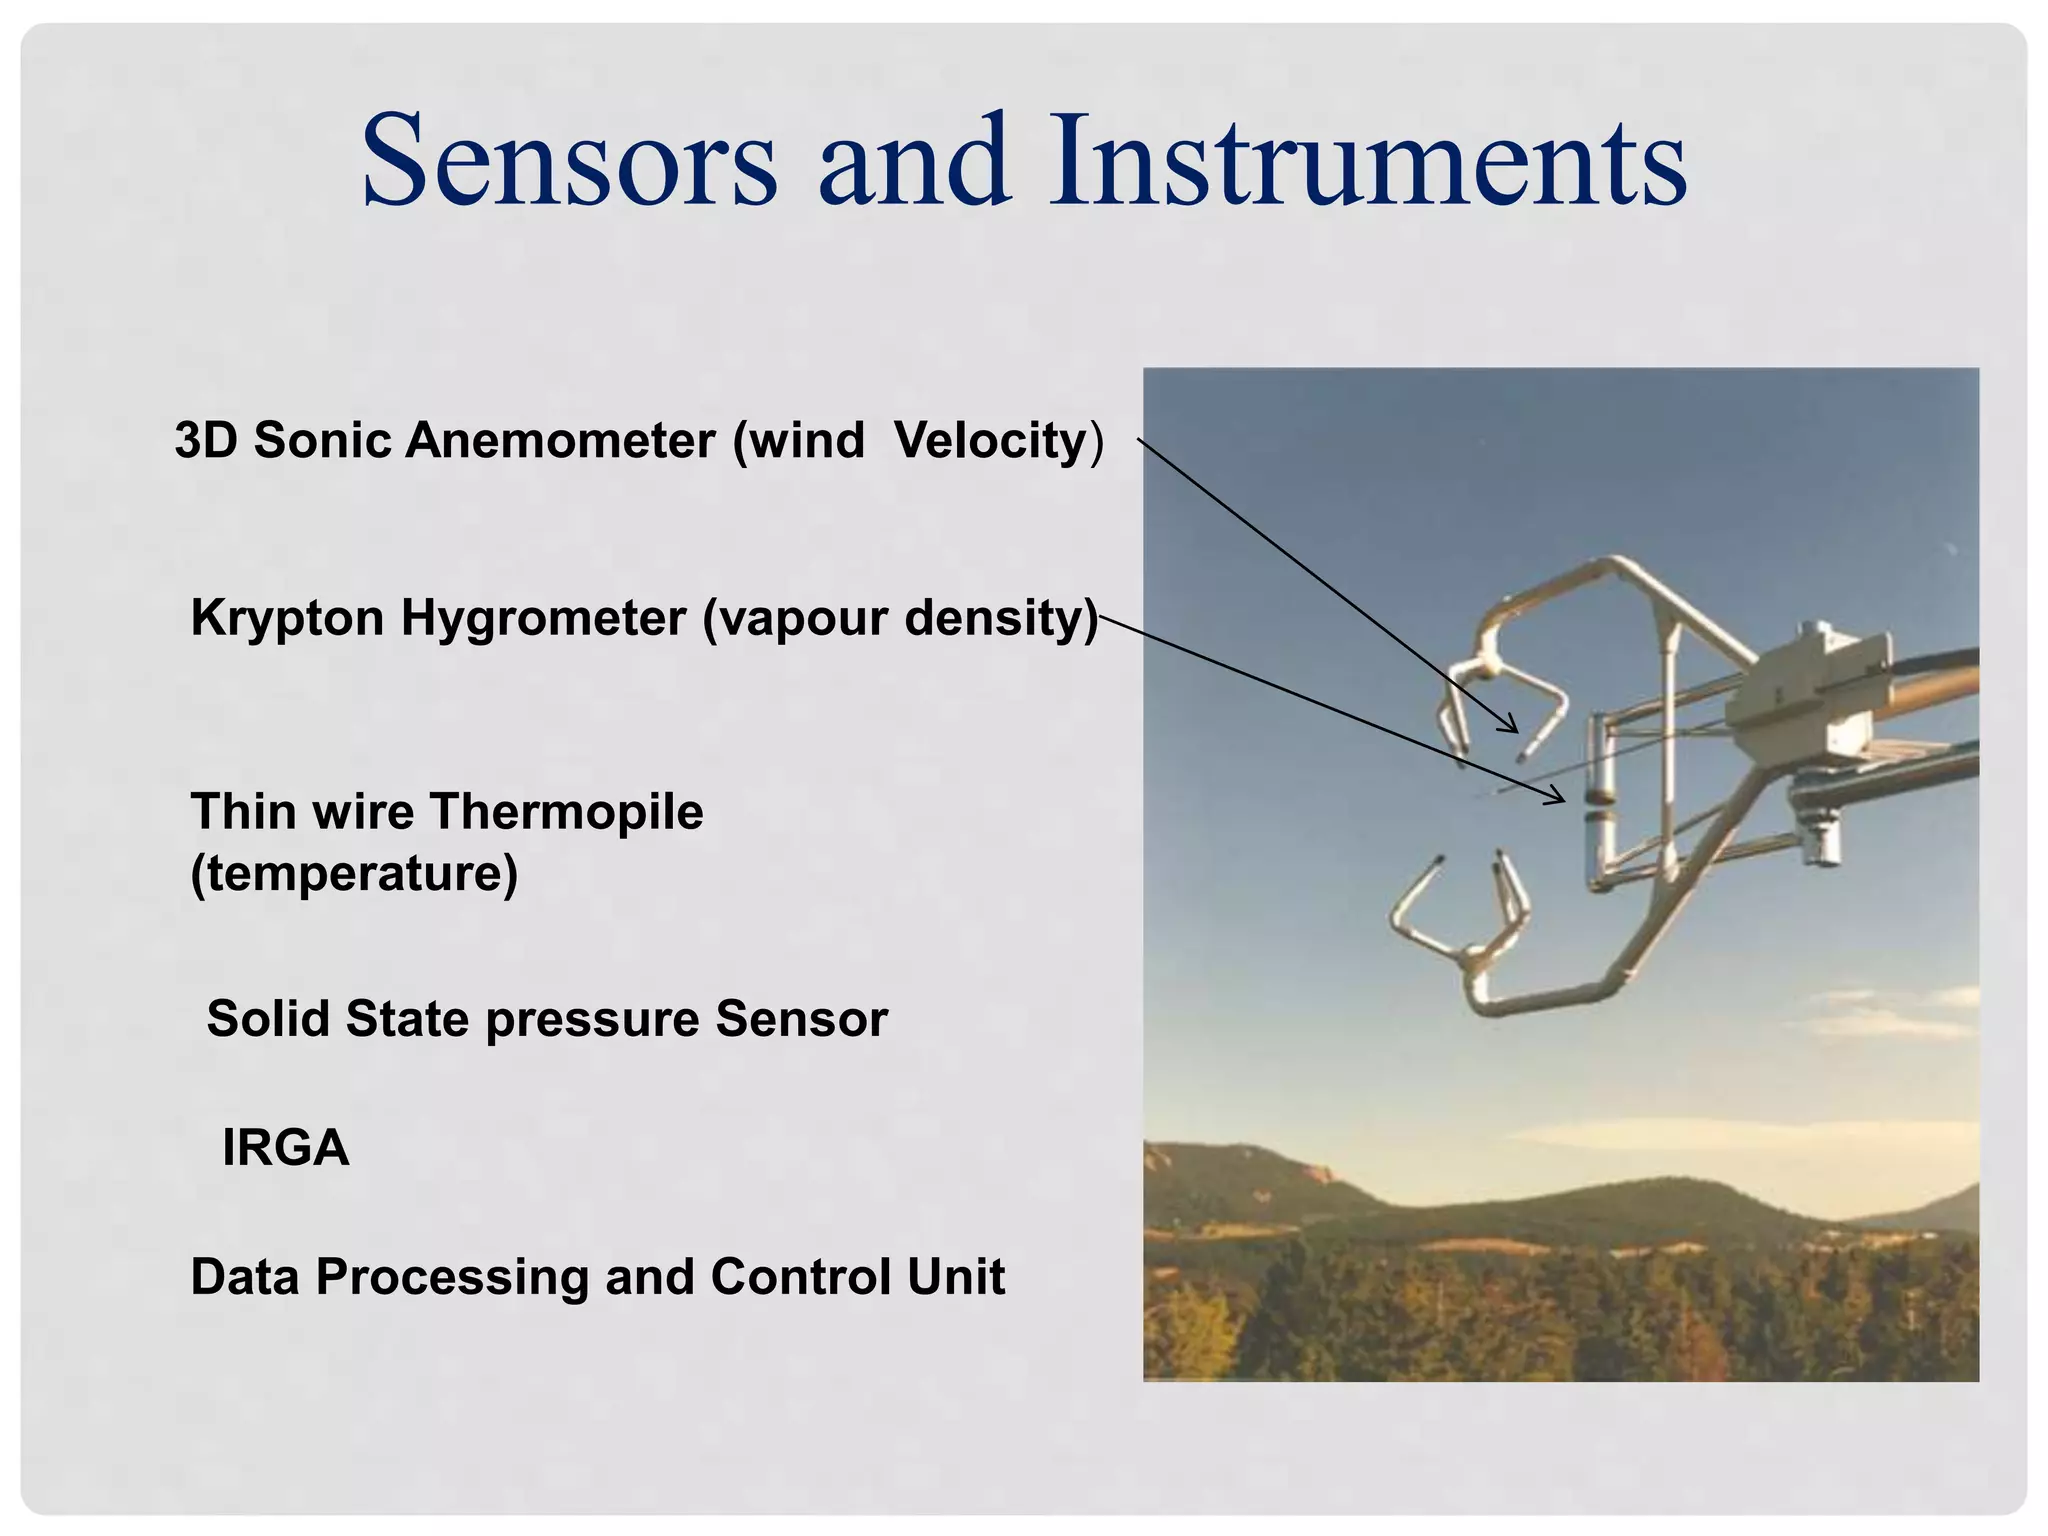
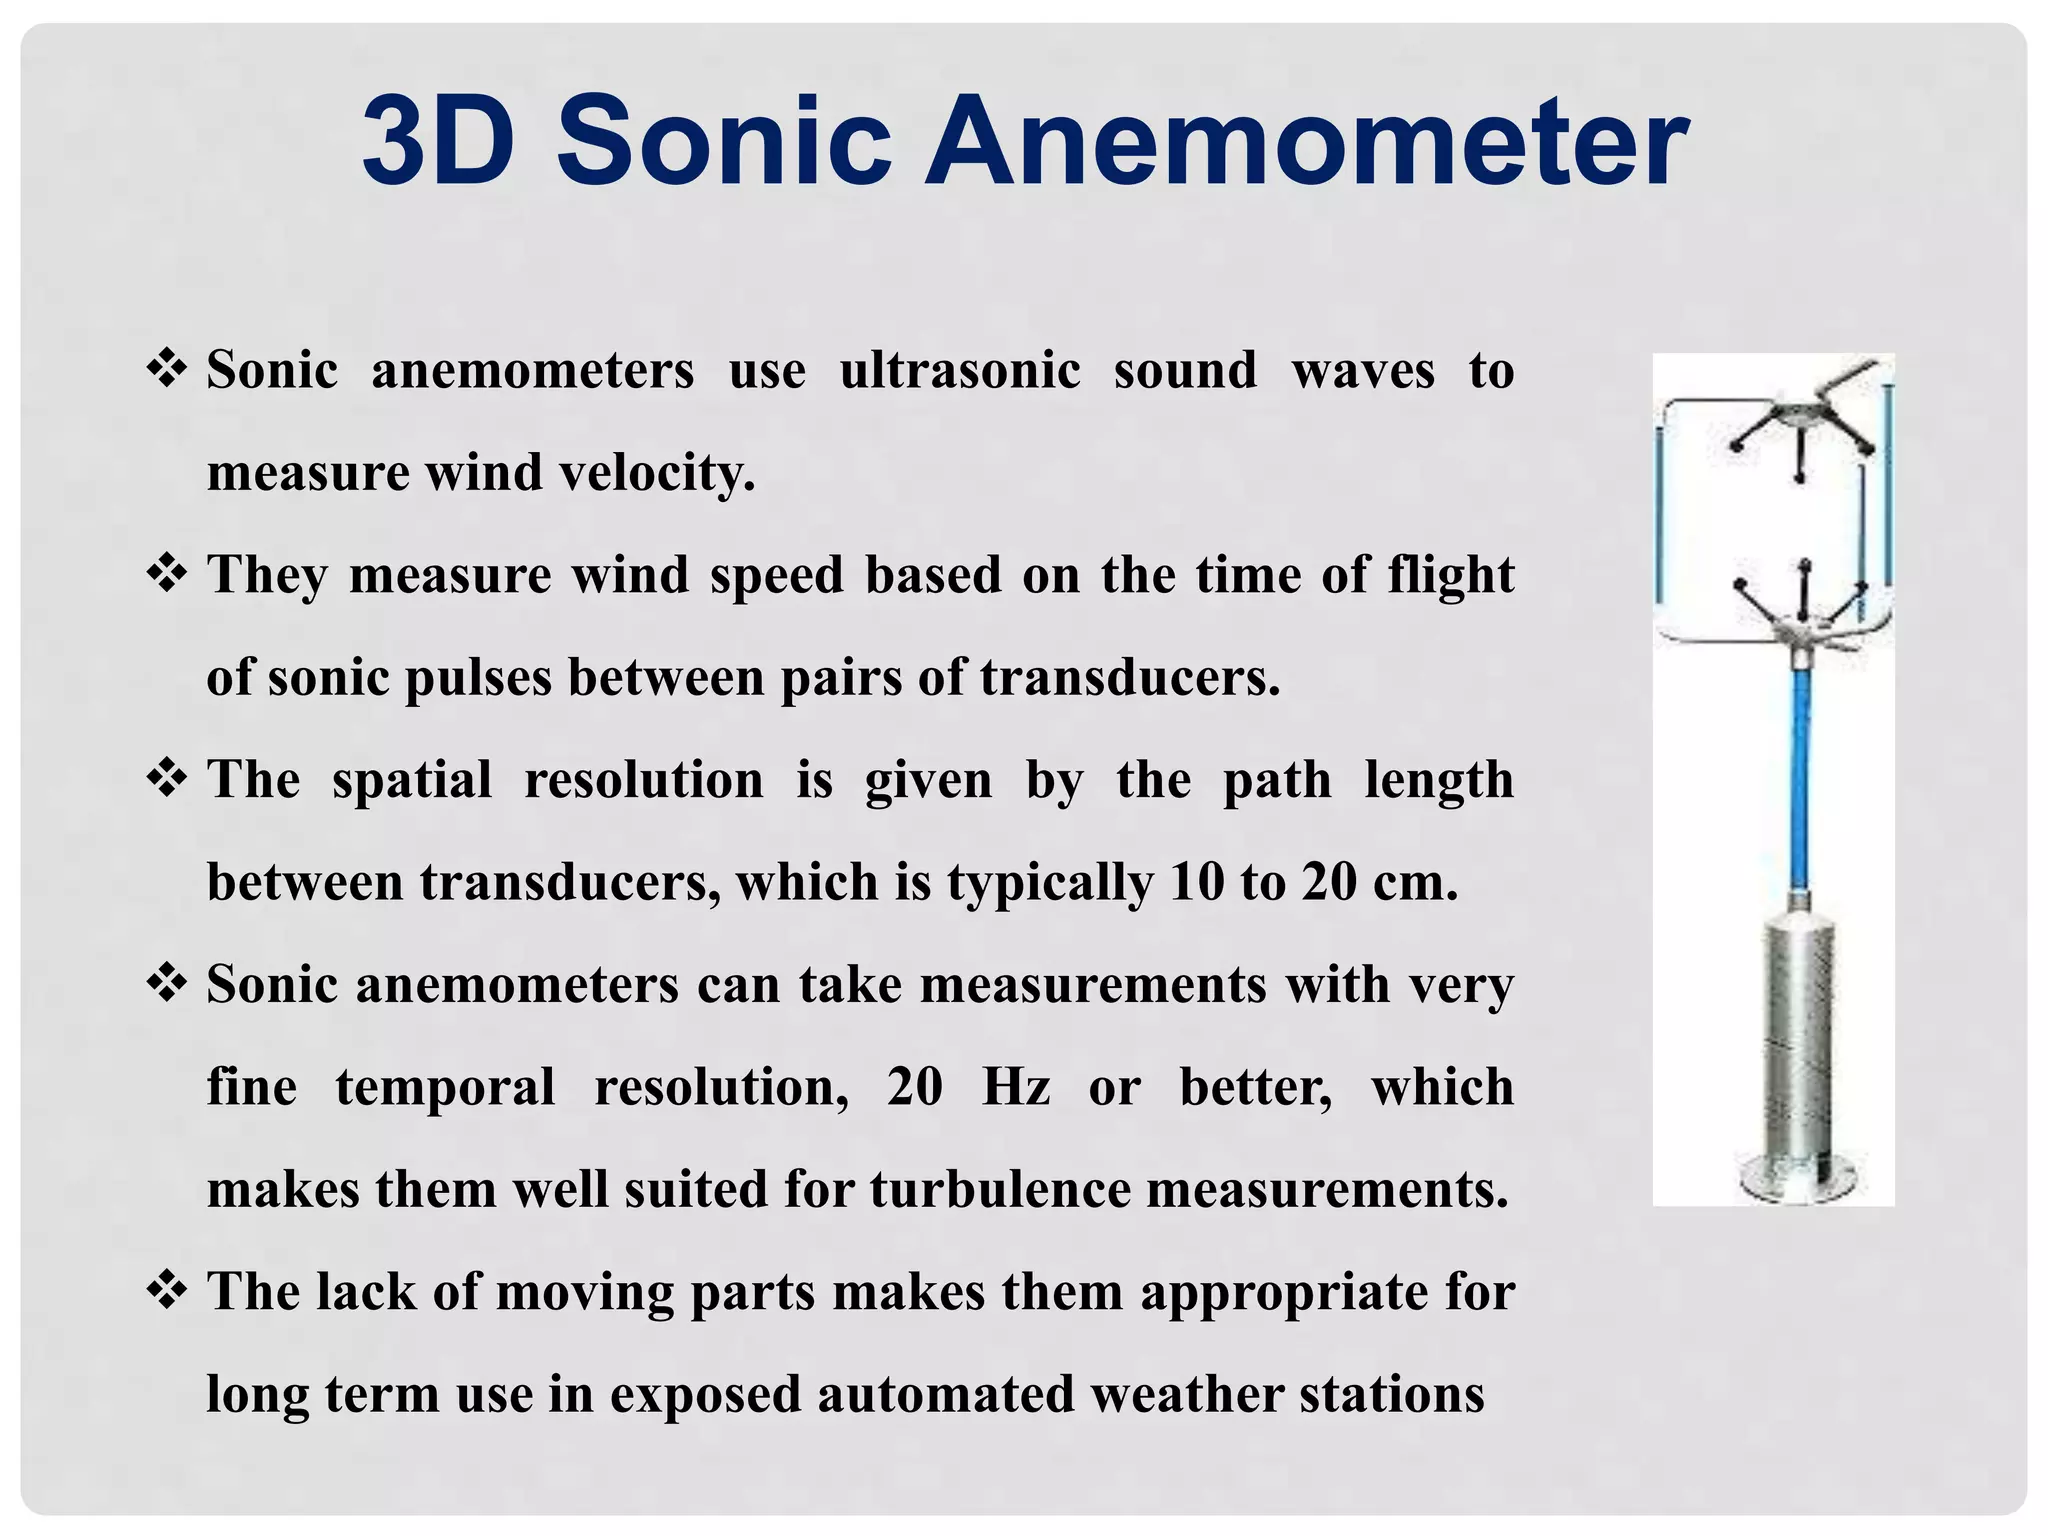
This document discusses various instruments used for micrometeorological studies. It begins by defining micrometeorology and its importance. It then describes different scales in meteorology from macro to micro. Various instrumentation approaches like flux gradient, Bowen ratio energy balance, and eddy covariance methods are mentioned. Specific instruments are then discussed in detail including ventilated psychrometer, soil heat flux plates, porometer, quantum sensor, sunfleck ceptometer, leaf area meter, infrared thermometer, and photosynthesis system. Case studies on their applications in India and Nigeria are provided. The document concludes by discussing the global FLUXNET network for measuring ecosystem carbon, water, and energy fluxes using the eddy covariance method.
Sub: Rainfed Agriculture and Watershed Management.
Topic: Drought: types, effect of water deficit on physio-morphological characteristics of the plants, Crop adaptation and mitigation to drought
Crop Microclimate Modification to Address Climate ChangeUditDebangshi
Climate-related agricultural vulnerabilities, as
well as their implications for food security and
farm livelihoods, have been extensively
documented. Extreme weather events such as
floods, droughts, heat and cold waves,
hailstorms, strong winds, cyclones, and other
weather events have increased the exposures of
agriculture to climate risk. These processes are
hampered by a lack of appropriate climatic
elements, resulting in an unfavourable drop in
crop productivity. Increased frequency and
intensity of droughts and floods, as well as
erratic precipitation patterns are predicted to
increase year-to-year yield variability in crop
production. Microclimate, which refers to the
climatic elements in the immediate vicinity of
the plants, is critical because it regulates and
affects the physiological reactions of the plants
as well as the energy exchange activities
between the plant and its surroundings.
Implementation of such microclimatic
modifications in crop production are required to
manage extreme weather risks and boost crop
output in order to increase food security and
agricultural sustainability in this changing
climate. The goal of this paper is to improve
crop production and land productivity by
modifying microclimate as a manifestation of
the efficiency and effectiveness of growth factor
utilisation.
In India, agriculture is one of the major application areas of the remote sensing technology. Various national level agricultural applications have been developed which showcases the use of remote sensing data provided by the sensors/satellites launched by the country’s space agency, Indian Space Research Organisation (ISRO)
Application of Remote Sensing in AgricultureUTTAM KUMAR
Remote sensing has been found to be a valuable tool in evaluation, monitoring and management of land, water and crop resources. The launching of the Indian remote sensing satellite (IRS) has enhanced the capabilities for better utilization of this technology and significant progress has been made in soil and land cover mapping, land degradation studies, monitoring of waste land, assessment of crop conditions crop acreage and production estimates
QUALITY OF IRRIGATION WATER AND MANAGEMENT OF SALINE WATER FOR IRRIGATION
GOVARDHAN LODHA
Enroll. No. (160111017)
Department of Agronomy
M.Sc. (Ag) Agronomy 2nd semester
The Contingency plans cover contingency strategies to be taken up by farmers in response to major weather related aberrations such as delay in onset and breaks in monsoon causing early, mid and late season droughts, floods, unusual rains, extreme weather events such as heat wave, cold wave, frost, hailstorm and cyclone.
This presentation covers direct and indirect methods of moisture measurement with clear descriptions of installation, principle, interpretation of readings, advantages and disadvantages of each method.
Meteorological observations are made for a variety of reasons. They are used for the real-time preparation of weather charts and maps, for weather forecasts and severe weather warnings, for the study of climate, and for local weather-dependent operations. This module highlights all related details.
DRONE TO MONITOR THE PLANT HEALTH ON A LARGE SCALE (ESPECIALLY COMMERCIAL OR PLANTATION CROPS) WITH PROPER ELECTRONICS.
AS 20 - 40 % OF MAJOR CROPS ARE WASTED GLOBALLY EVERY YEAR, HERE WE CAME UP WITH THE SOLUTION.
Concentration measurements of bubbles in a water column using an optical tomo...ISA Interchange
Optical tomography provides a means for the determination of the spatial distribution of materials with different optical density in a volume by non-intrusive means. This paper presents results of concentration measurements of gas bubbles in a water column using an optical tomography system. A hydraulic flow rig is used to generate vertical air–water two-phase flows with controllable bubble flow rate. Two approaches are investigated. The first aims to obtain an average gas concentration at the measurement section, the second aims to obtain a gas distribution profile by using tomographic imaging. A hybrid back-projection algorithm is used to calculate concentration profiles from measured sensor values to provide a tomographic image of the measurement cross-section. The algorithm combines the characteristic of an optical sensor as a hard field sensor and the linear back projection algorithm.
A COMPARATIVE ANALYSIS OF THERMAL FLOW SENSING IN BIOMEDICAL APPLICATIONSijbesjournal
Flow sensors have diverse applications in the field of biomedical engineering and also in industries.
Micromachining of flow sensors has accomplished a new goal when it comes to miniaturization. Due to the
scaling in dimensions, power consumption, mass cost, sensitivity and integration with other modules such
as wireless telemetry has improvised to a great extent. Thermal flow sensors find wide applications in
biomedical such as in hydrocephalus shunts and drug delivery systems. Infrared thermal sensing is used for
preclinical diagnosis of breast cancer, for identifying various neurological disorders and for monitoring
various muscular movements. In this paper, various modes of thermal flow sensing and transduction
methods with respect to different biomedical applications are discussed. Thermal flow sensing is given
prime focus because of the simplicity in the design. Finally, a comparison of flow sensing technologies is
also presented.
Influence of microclimate, plant, soil and cultural factors on ET; techniques...Abhilash Singh Chauhan
INTRODUCTION
The deficiencies and surpluses of water are often the most important of the various factors influencing plant growth.
They are, at the same time, the most difficult to control.
At present adequate theory and measuring techniques for predicting the rate of soil water loss by evapotranspiration exist for only a few special combinations of plant and climatic conditions.
A better understanding of the factors influencing this process is necessary to help pave the way for the development of methods for increasing the efficiency of water utilization by crops.
The rate of water loss by the processes of evaporation and transpiration is the resultant of five controlling factors, viz:
Climate
Soil Moisture
Plant Cover
Soil Texture and Structure
Soil and Crop Management
Modification of weather hazards: weather modification for agriculture; scient...Abhilash Singh Chauhan
Modification of weather hazards: weather modification for agriculture; scientific
advances in artificial rain making, hail suppression, dissipation of fog and stratus clouds,
modification of severe storms and electric behavior of clouds.
The French Revolution, which began in 1789, was a period of radical social and political upheaval in France. It marked the decline of absolute monarchies, the rise of secular and democratic republics, and the eventual rise of Napoleon Bonaparte. This revolutionary period is crucial in understanding the transition from feudalism to modernity in Europe.
For more information, visit-www.vavaclasses.com
Instructions for Submissions thorugh G- Classroom.pptxJheel Barad
This presentation provides a briefing on how to upload submissions and documents in Google Classroom. It was prepared as part of an orientation for new Sainik School in-service teacher trainees. As a training officer, my goal is to ensure that you are comfortable and proficient with this essential tool for managing assignments and fostering student engagement.
This is a presentation by Dada Robert in a Your Skill Boost masterclass organised by the Excellence Foundation for South Sudan (EFSS) on Saturday, the 25th and Sunday, the 26th of May 2024.
He discussed the concept of quality improvement, emphasizing its applicability to various aspects of life, including personal, project, and program improvements. He defined quality as doing the right thing at the right time in the right way to achieve the best possible results and discussed the concept of the "gap" between what we know and what we do, and how this gap represents the areas we need to improve. He explained the scientific approach to quality improvement, which involves systematic performance analysis, testing and learning, and implementing change ideas. He also highlighted the importance of client focus and a team approach to quality improvement.
Model Attribute Check Company Auto PropertyCeline George
In Odoo, the multi-company feature allows you to manage multiple companies within a single Odoo database instance. Each company can have its own configurations while still sharing common resources such as products, customers, and suppliers.
The Indian economy is classified into different sectors to simplify the analysis and understanding of economic activities. For Class 10, it's essential to grasp the sectors of the Indian economy, understand their characteristics, and recognize their importance. This guide will provide detailed notes on the Sectors of the Indian Economy Class 10, using specific long-tail keywords to enhance comprehension.
For more information, visit-www.vavaclasses.com
Unit 8 - Information and Communication Technology (Paper I).pdfThiyagu K
This slides describes the basic concepts of ICT, basics of Email, Emerging Technology and Digital Initiatives in Education. This presentations aligns with the UGC Paper I syllabus.
The Art Pastor's Guide to Sabbath | Steve ThomasonSteve Thomason
What is the purpose of the Sabbath Law in the Torah. It is interesting to compare how the context of the law shifts from Exodus to Deuteronomy. Who gets to rest, and why?
Advances in Instrumentation for Micrometeorological Studies
1. Abhilash Singh
Dept. of Agricultural Meteorology
CCSHAU, Hisar
Advances in Instrumentation for
Micrometeorological Studies
2. Introduction :-
micrometeorology deals with atmospheric processes near the
earth's surface providing increased knowledge of the mechanisms
controlling our environment.
It has increased our understanding of the response of crop plants
to their physical environment permitting us to develop improved
agronomic practices aimed at achieving more efficient use of water
and more economical production of crops.
Rather than absolute values, fast fluctuations are to be measured.
Therefore fast response and more accurate instruments are
required.
3. Name of the
Scale
Time Span
Horizontal
spread (km)
Vertical
Height (km)
Examples
A. Macroscale
(i) Planetary
Scale
Weeks or
Years
5000 - 10000 More than 1
Westerlies , Trade
winds
(ii) Synoptic
Scale
Days to
weeks
100- 5000
More than 1 Cyclone, Anti
cyclones
B. Mesoscale
Minutes to
days
1-100
Up to 1 Thunderstorm , land
breeze
C. Microscale
Seconds to
minutes
1
Up to 10
meters
Turbulance, Eddies
5. Ventilated Psychrometer
It is used to measure temperature and humidity
profiles in crop.
Delta T psychrometer –uses thermocouple sensors
one acting as dry bulb and other wet bulb
thermometer .
Sensors are ventilated by a miniature fan and
shielded from solar radiations, rains etc. by brass
coating.
The wet bulb is provided with a wick wetted in
distilled water.
Fan evaporates water and wet bulb depression is
produced.
Output is connected to data-logger.
6. Soil heat flux plates
It is typically used for energy-balance or Bowen-
ratio flux systems.
A differential thermopile (copper-constantan) is
connected between the top and bottom portions of
the sensing plates to measure temperature
gradients across the plate.
Most heat flux sensors are based on the principle of
thermopile—a number of thermocouples connected
in series.
A single thermocouple will generate an output
voltage that is proportional to the temperature
difference between the joints.
Using more thermocouples in series will enhance
the output signal.
7. Steady state Porometer
It can measure leaf resistance, conductance, RH, Temperature, pressure, light and
transpiration rate.
Water loss from a leaf is determined by maintaining constant vapour density in a
cuvette that is in contact with transpiring leaf.
This is achieved by pumping dry air into the cuvette at an appropriate measured rate
so that humidity observed by leaf matches the ambient humidity.
After enclosing the leaf in cuvette an
equilibrium is be established.
So due to transpiration, the outgoing
humidity must be greater than the inlet
humidity.
Reading should be taken after 15-25
seconds, if left too long , the stomata will
start to adapt to new conditions.
8. Quantum Sensor
Quantum sensors are used to measure radiation that
drives photosynthesis.
During photosynthesis, plants use energy in the region
of the electromagnetic spectrum from 400-700 nm.
The radiation in this range, referred as
Photosynthetically Active Radiation (PAR).
It can be measured in energy units (watts m-2) or as
Photosynthetic Photon Flux Density (PPFD), which has
units of quanta (photons) per unit time per unit surface
area.
The unit most commonly used is micromoles of quanta
per second per square meter (µmol` s-1 m-2) .
9. Sunfleck Ceptometer
It consists of a long, light sensitive probe with
photodiode sensors .
It has two main modes of operation.
The first measures average Photo synthetically Active
Radiations (PAR) & second measures the sun flecks in
plant canopies.
Sunflecks are the bright areas under the canopy
where direct beam of solar radiation penetrates
without attenuation by the canopy.
The fraction of the ground covered by sunflecks is a
useful measurement for determining canopy cover.
10. Portable Leaf Area Meter
Non-destructive leaf area measurement
in the field can be done so that leaf area
can be monitored without damaging the
plants.
It allows precise evaluation of plant
canopy development throughout the
growing season.
It displays and stores individual leaf area,
accumulated area, leaf length, average
width, maximum width.
It has resolution of 1 mm 2 .
The major components are the scanning
head and the readout console.
Area data are recorded by the readout
console as the scanning head is passed
over the leaf.
11. Infrared Thermometer
Infrared (IR) thermometers measure reflected infrared
radiations having wavelength longer than visible light
that can be correlated to a specific surface temperature
of the object being measured.
Anything above absolute zero (-273.15 degrees Celsius or
0 degrees Kelvin) emit radiation.
Based on Stephen – Boltzmann‘s law
E = 𝝈 T 4 (For Black Body)
E = 𝝈 ε T 4 (For Grey Body)
Range - - 30 to 100 0C
Response Time - less than one second
Accuracy up to 0.10 C
Uses : –
It is used to measure the Plant canopy temperature .
Indices like CWSI (Crop Water Stress Index) have been
developed which are used in irrigation planning.
12. Parameter Industrial Quality Consumer Quality
Operating range -18 to 100 0c -10 to 50 0c
Measurement Range 0 to 50 0c -33 to 220 0c
The I-Q IRT sensors used in the study have a cost of∼$300 USD and the C-Q IRT
sensors used were purchased for ∼$30 USD.
13. Portable Photosynthesis System
The instrument makes rapid, simultaneous measurements of photosynthesis rates and
stomatal conductance.
It is based on the principle of Infra red gas analysis.
During photosynthesis CO2 is consumed while in respiration it is released.
Reference tube contains a known concentration of CO2
and a sample tube contains air of which CO2
concentration is to be measured.
In the reference tube known amount of IR is depleted due
to absorption by CO2 while in sample tube depletion is
corresponding to CO2 concentration to be measured.
On the basis of difference in concentration of CO2
between the two samples, the rate of photosynthesis is
measured.
15. Effect of cultivation practices and N levels on photosynthetic rate of flag and fourth leaf,
measured at milk grain (MG) and late ripening (LR) stage of rice crop.
Treatments
Flag leaf Fourth leaf
Photosynthetic rate
(µmol m-2 s-1)
Photosynthetic rate
(µmol m-2 s-1)
MG LR MG LR
Cultivation
practices
System of rice
intensification
(SRI)
17.4 13.5 11.9 10.0
Transplanted
flooded rice
(TFR)
12.0 8.6 9.3 6.0
Nitrogen levels
N0 11.0 7.5 9.3 6.2
N60 14.0 10.7 10.5 7.8
N90 16.4 12.6 10.9 8.7
N120 17.5 13.3 11.7 9.3
16. The Bowen (1926) introduced a relationship between sensible heat (𝑯 𝒔 ) and latent
heat (𝑯𝒍 ), known as the Bowen ratio, β , is expressed in the form
β =
𝑯 𝒔
𝑯𝒍
= ϒ
𝜟𝑻
𝜟𝒆
It is a micrometeorological technique often used for estimating the surface energy
fluxes ( i.e. latent heat, sensible heat fluxes)
This method uses time averaged measurements of temperature and humidity profiles
in the surface boundary layer for the estimation of these fluxes.
The surface energy budget is given by,
𝑹 𝒏=𝑯𝒔 + 𝑯𝒍 + G + Δs
Bowen ratio energy balance (BREB)
17. Bowen Ratio System
Air temperature is measured at two heights
with chromel–constantan thermocouples
wire.
Soil heat flux is measured by heat flux plates
which are buried in the soil at a fixed depth
of between 5 to 10 cm to reduce errors due to
vapour transport of heat.
Vapour concentration is measured with a
krypton hygrometer.
18. Bowen ratio estimation of surface energy fluxes in a humid tropical
agricultural site, Ile-Ife, Nigeria
(Oladosu et al. 2007)
19. Date
and day
no
Air
temp
0C
Rainfall Rn
( Wm-2 )
Hs
( Wm-2 )
HL
( Wm-2 )
G
( Wm-2 ) Observation
25/2/04
(56) 32-48
Heavy
short
lived
420
3 times
of HL
100
26/2/04
57
30-46
In
evening
600 200 300
50-80 &
-120
evening
27/2/04
58
450 180 400
Clear sky
more
evaporation
28/2/04
59
150 250
Intense solar
heating
29/2/04
60
35 220 280
Surface was
dry
20. MINCER: A novel instrument for monitoring
the micrometeorology of rice canopies
(Fukuoka et.al. 2012)
21. MINCER – Micrometeorological Instrument
for the Near Canopy Environment of Rice
(1) Air inlet;
(2) double-hulled PVC pipe
(3) single-hulled PVC pipe
(4) solar-powered ventilator
with rechargeable batteries
(5) air outlet
(6) tripod
(7) data logger that records temperature
and relative humidity.
23. Sensors and Instruments
3D Sonic Anemometer (wind Velocity)
Krypton Hygrometer (vapour density)
Thin wire Thermopile
(temperature)
Solid State pressure Sensor
IRGA
Data Processing and Control Unit
24. Sonic anemometers use ultrasonic sound waves to
measure wind velocity.
They measure wind speed based on the time of flight
of sonic pulses between pairs of transducers.
The spatial resolution is given by the path length
between transducers, which is typically 10 to 20 cm.
Sonic anemometers can take measurements with very
fine temporal resolution, 20 Hz or better, which
makes them well suited for turbulence measurements.
The lack of moving parts makes them appropriate for
long term use in exposed automated weather stations
3D Sonic Anemometer
25. Gas Analyzer
The LI-820 CO2 Analyser is a low maintenance,
economical gas analyser designed for continuous
monitoring applications.
Wide CO2 Measurement Range : 0-20,000 ppm
Wide Operating Temperature: -20° to +45°C
Low Noise
Compact, lightweight design with low power
consumption
26. Krypton Hygrometer
krypton hygrometer is used for measuring
water vapour fluctuations in the air.
The KH20 sensor uses a krypton lamp that emits
two absorption lines : major line at 123.58 nm
and minor line at 116.49 nm.
Both of these lines are absorbed by water vapour,
and a small amount of the minor line is absorbed
by oxygen.
27. Thin wire Thermopile
Thermocouple wire products are used for
precise temperature measurement in
temperature ranges from 200°C to 1300°C.
28. Differential Pressure Sensor
Differential pressure sensors
measurements are reliably, fast and
stable.
The digital and analog sensors offer
highest accuracy and resolution,
especially at very low differential
pressures.
29. Data Logger
Data collection Systems which
compiles and stores the data and
transfers the data files wirelessly
or over the Internet.
The device have the ability to
collect and store data from
various instruments, such as in
automatic weather station.
30. Data Processing
• EddyPro® is a widely used eddy covariance data processing
application that computes gas and energy fluxes and many
useful parameters.
31. FLUXNET: A New Tool to Study the Temporal and
Spatial Variability of Ecosystem-Scale Carbon
Dioxide, Water Vapour, and Energy Flux Densities
Fluxnet is a global network of
micrometeorological tower sites that use
eddy covariance methods to measure the
exchanges of carbon dioxide, water
vapor, and energy between the biosphere
and atmosphere.
It serves to provide an infrastructure
to compile, archive and distribute data
for the scientific community.
(Baldochchi et al.,2001)
32. As of April 2014, there were about 683 tower sites
globally in continuous long-term operation.
33. Application in meteorology
FLUXNET can provide new information on how the
biosphere affects the partitioning of net radiation into sensible
and latent heat exchange, as quantified by the Bowen ratio.
34. Advantages of micrometeorological
instruments
These instruments have higher accuracy.
They give the instant results.
We get the continuous time series of data and this data can be
stored in these instruments for future purpose.
Most of these instruments are automatic, so less labour is
required.
35. Limitations of micrometeorological instruments
The pace of modernization has been slow due to economic constrains
being experienced by the developing countries as the cost of these
instruments is very high.
Maintenance of the existing meteorological instruments has also been
affected by lack of adequate funding and lack of spare parts from
manufacturers who no longer produce the same instruments.
Due to lack of regular maintenance of these instruments and
equipment, there is lack of continuity in data sets resulting in difficulties
in analysis and accuracy of the end agro-meteorological products
intended for the conservation and management of natural and
environmental resources.
The various exchange processes of different fluxes such as mass, momentum, energy and evapotranspiration across the boundary between Soil-plant-atmosphere continuum are measured using these approaches.
A field comparison of industrial-quality and consumer-quality infrared thermocouple sensors monitoring a grass canopy and a cotton canopy indicated that these two types of sensors were similar over a 13–35◦C range.
The measurement of temperature made with two types of sensors would not differ significantly.
Based on these results we conclude that the lower cost consumer-quality infrared thermometers are suitable for use in production agricultural applications.
In order to assess N utilization in relation to photosynthetic activity, three hills with an average number of panicles were selected from each
sub-plot. For each hill, 3 flag leaves and 3 fourth-leaves were selected at the milk-grain stage (111 days after germination; 22–26 April) and late-ripening stage (123 days after germination; 4–6 May) to measure the photosynthetic rate by using a portable photosynthesis system (CIRAS-2; PP Systems Ltd., Hertfordshire, UK). Measurements were taken on a clear sunny day (solar radiation>1,200μmol m−2s−1) between 10:30 and 11:00 a.m. before the mid
day reduction in photosynthesis.
Conclusions- Any day that follows a previous night precipitation, the latent heat flux during the daytime was found to be greater by a factor of two or more than the sensible heat flux.
For the relatively dry days however, the sensible heat flux is of the same magnitude or slightly higher when compared with the latent heat flux.
Generally, for the tropical zones, during the dry seasons the sensible heat flux is larger than latent heat, but during wet seasons the reverse is the true.
as rice panicles are the organs most susceptible to heat stress
it is necessary to measure the panicle temperature to understand the impairment caused by heat stress
which require elaborate measurement system and time consuming work making it difficult for the researcher to obtain necessary data.
as a practical alternative
The air temperature around the panicle is easier to measure than the panicle temperature
which is closer to the panicle temperature than the air temperature observed at weather stations
which are usually distant from study sites.
another problem is difficulty in supplying power to equipment because electricity is rarely available in a paddy field
so to overcome these difficulties these scientists develop the MINCER which is a radiation shielded ,solar powered, force ventilated system
which can provide the data of air temp and relative humidity at an affordable cost.
as a result of ease of use and use and cost effectiveness of MINCER ,more than 100 units are already in operation in eight countries that are
participating in MINCERnet monitoring network (Yoshimito et. al. 2012)
Very useful technique to measure and calculate turbulent fluxes in atmospheric boundary layer. This method was developed by swinbank in1951.
To compute turbulent fluxes, measured scalar variables (e.g., temperature from a sonic anemometer, density of water vapour, CO2, and CH4 from gas analysers) and 3-dimensional wind components (u, v, and w, from a sonic anemometer) are recorded in a data acquisition system. These data are subsequently processed using flux computation software. Eddy Covariance Systems provides an accurate way to measure surface-atmosphere fluxes of energy and trace gas fluxes over a variety of ecosystems, including agricultural and urban landscapes, landfills, and various water surfaces. Fluxes can be measured by instrumentation mounted on a stationary or mobile tower, floating vessel (such as a ship or buoy), or an aircraft
Measurements from pairs of transducers can be combined to yield a measurement of velocity in 1-, 2-, or 3-dimensional flow.
It is an absolute, non-dispersive infrared (NDIR) gas analyzer based upon a single path, dual wavelength infrared detection system. It can be used in a wide range of demanding environmental conditions. The optical bench can be easily cleaned by the user; which reduces down-time due to contamination, and eliminates the need for factory recalibration.
The outstanding performance of differential pressure sensors is based on the dynamic measuring principle, in which the differential pressure is determined using intrinsic flow measurement.
For example, a raw data file collected over a period of 24 hours can be as large as 200 MBEddy covariance instruments generate large amounts of data.. A system that can compress and store large data files can be very helpful in remote areas, making it possible to store several months of raw data. The central data collection hub have the ability to log the CO2 and H2O data with synchronized anemometer data.
Occurrences of negative Bowen ratios are recorded as well and are attributed to radiative cooling and the presence of water on the surface. In both instances, stable thermal stratification is associated with the downward transfer of sensible heat. The timing of leaf-out also has a distinct impact on the humidity and temperature of the planetary boundary layer and the seasonal pattern of its maximum height During the winter, the Bowen ratio is variable, and in many instances large, with H being up to 6 times greater than λE.