Download as PDF, PPTX
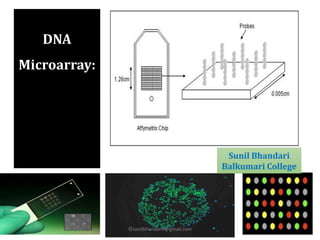
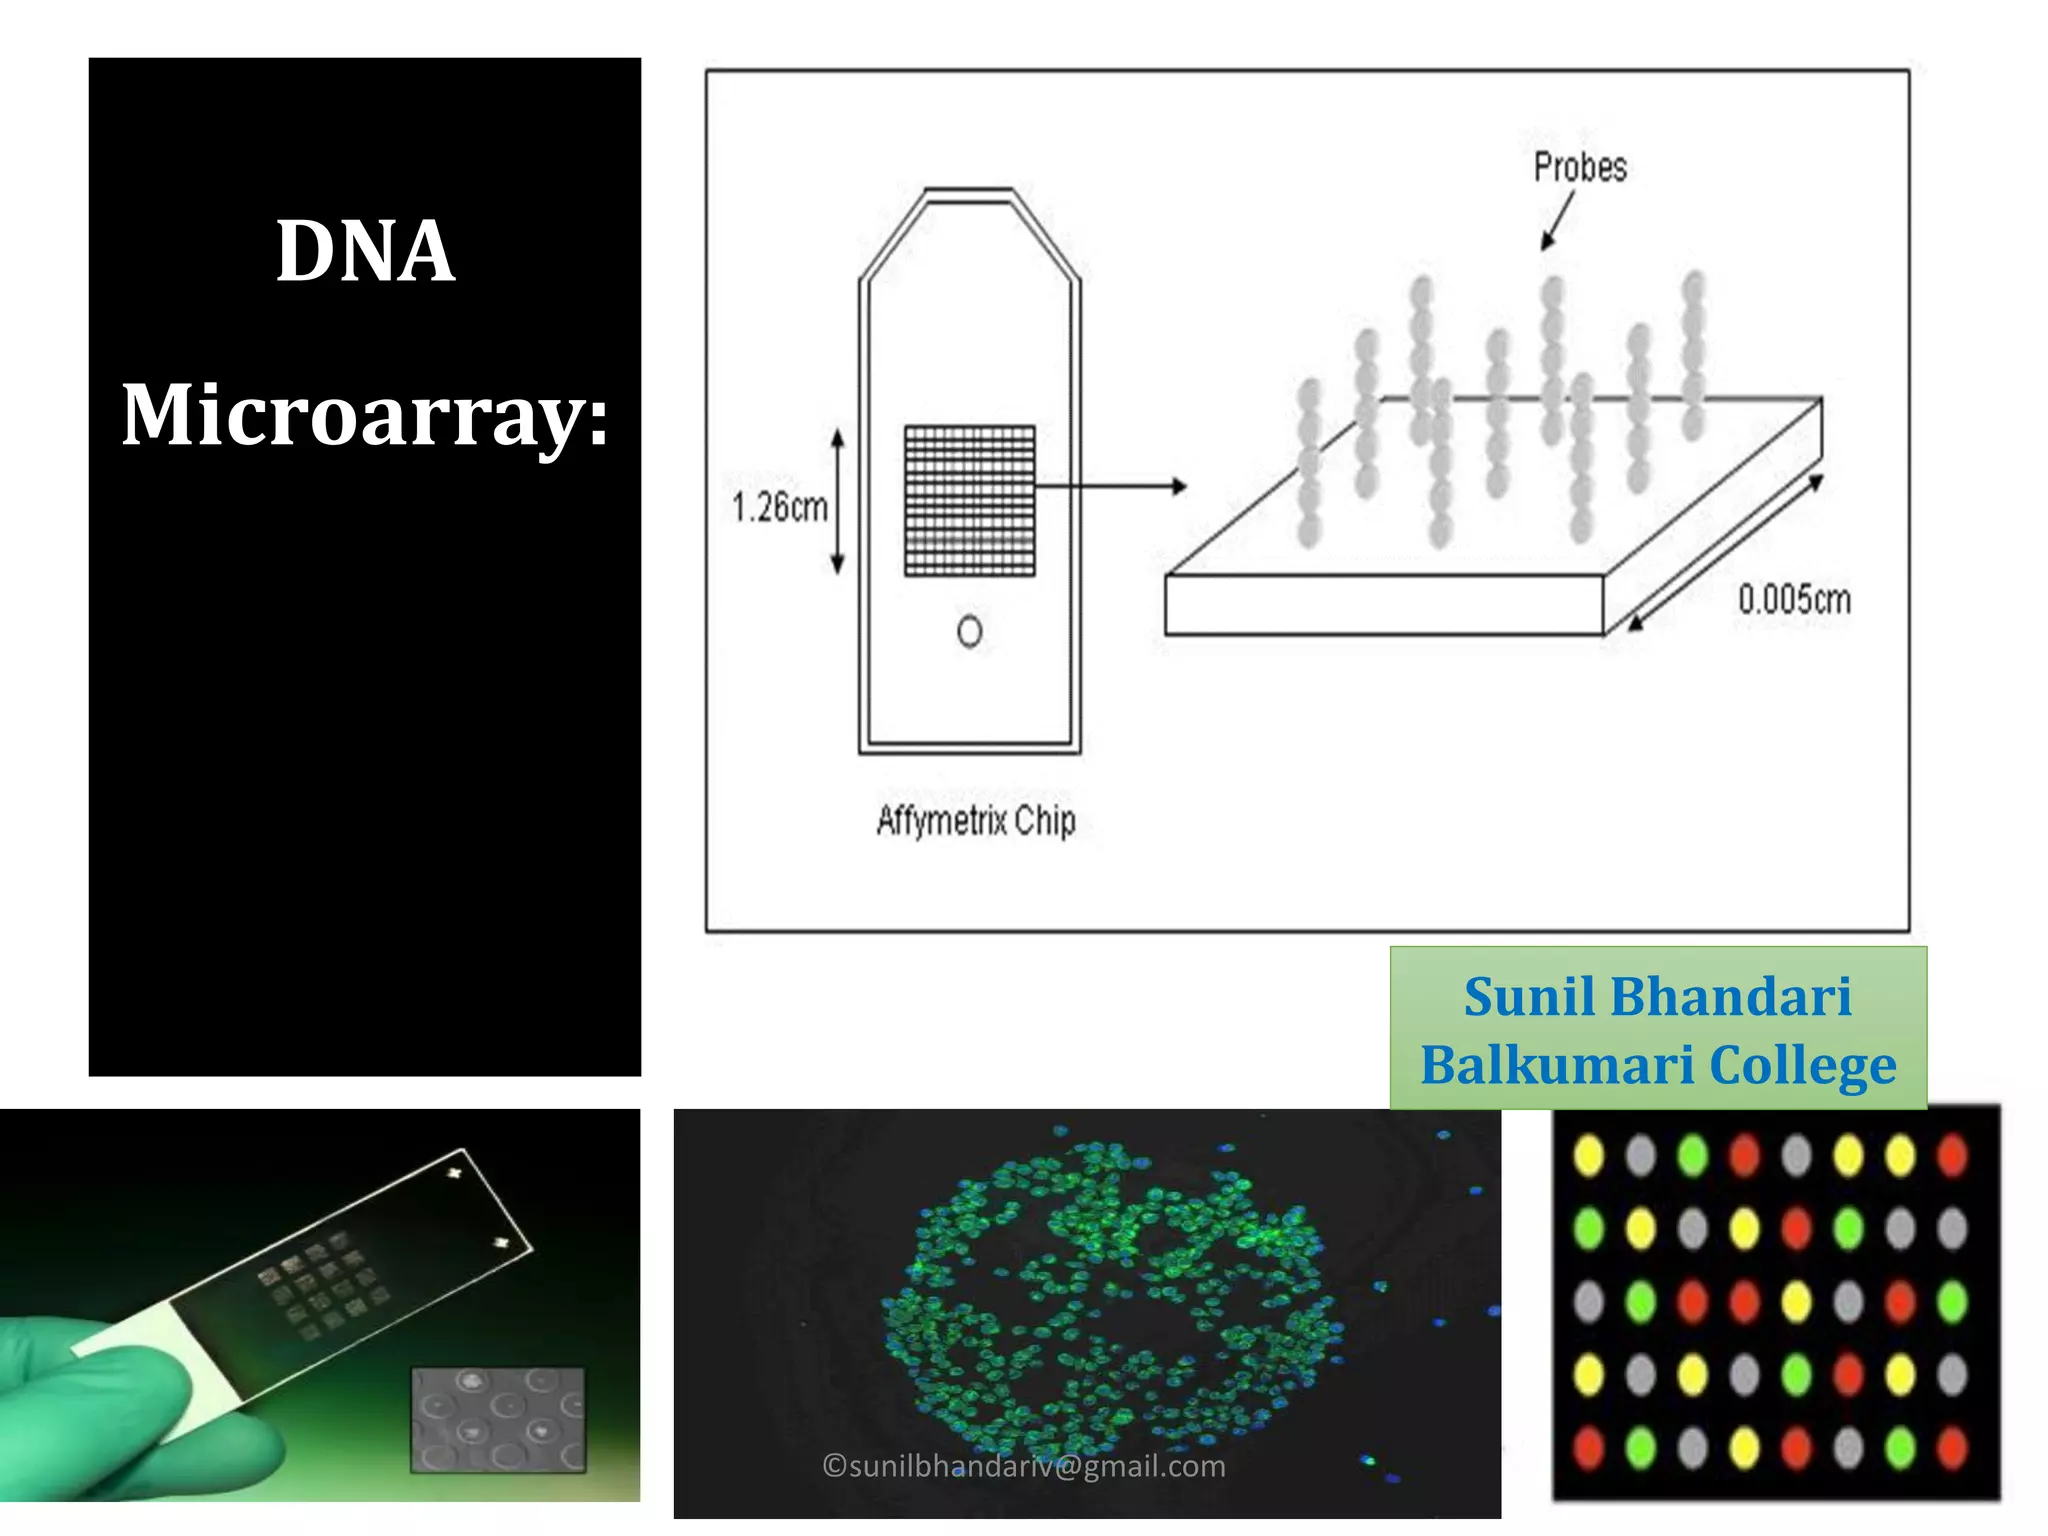
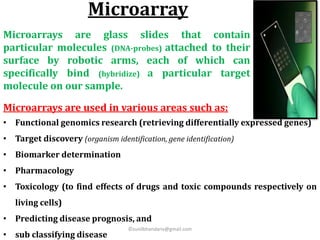
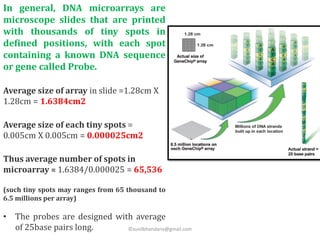
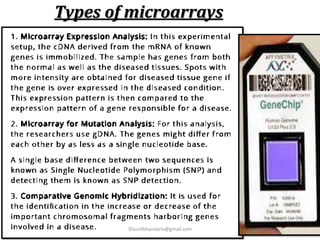

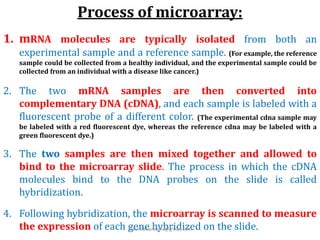
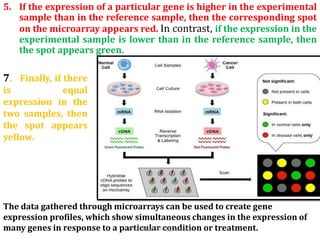
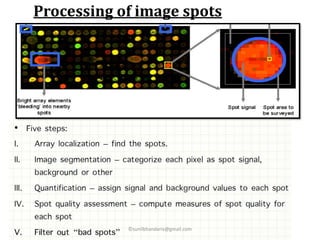

DNA microarrays are microscope slides containing thousands of tiny DNA spots, with each spot containing a known DNA sequence or gene called a probe. Microarrays are used in various areas such as functional genomics research, target discovery, biomarker determination, pharmacology, and toxicology. The microarray process involves isolating mRNA from experimental and reference samples, converting the mRNA to cDNA and labeling each with a fluorescent dye, hybridizing the samples on the microarray slide, scanning the slide to measure gene expression, and analyzing the intensity data.


![Polymer [ बहुलक ] Chemistry Notes PDF - Irfanullah Mehar - JJ Sir Chemistry.pdf](https://cdn.slidesharecdn.com/ss_thumbnails/polymerchemistrynotespdf-irfanullahmehar-jjsirchemistry-260210172118-3f9b37f7-thumbnail.jpg?width=640&height=640&fit=bounds)


