This document provides information on method validation. It begins with definitions of method validation and discusses why method validation is important. It states that method validation is required for non-standard methods, laboratory-designed methods, standard methods used outside their intended scope, and when modifications have been made to standard methods. The document discusses who is responsible for carrying out method validation and the extent of validation studies required for different types of analytical applications and circumstances. It provides information on various method performance characteristics that are evaluated during validation including accuracy, precision, sensitivity, selectivity, limits of detection and determination, linearity, specificity, repeatability, reproducibility, and robustness. The document concludes with sections that should be included in a validation plan and report.
Definitions
6/24/2021 K.K. Nayak3
Method validation is basically the process of defining
an analytical requirement, and confirming that the
method under consideration has capabilities consistent
with what the application requires.
confirmation, through the provision of objective
evidence, that the requirements for a specific
intended use are fulfilled [ISO/IEC 17025]
confirmation by examination and provision of
objective evidence that the particular
requirements for a specific intended use or
application have been fulfilled [ISO 9000]
3.
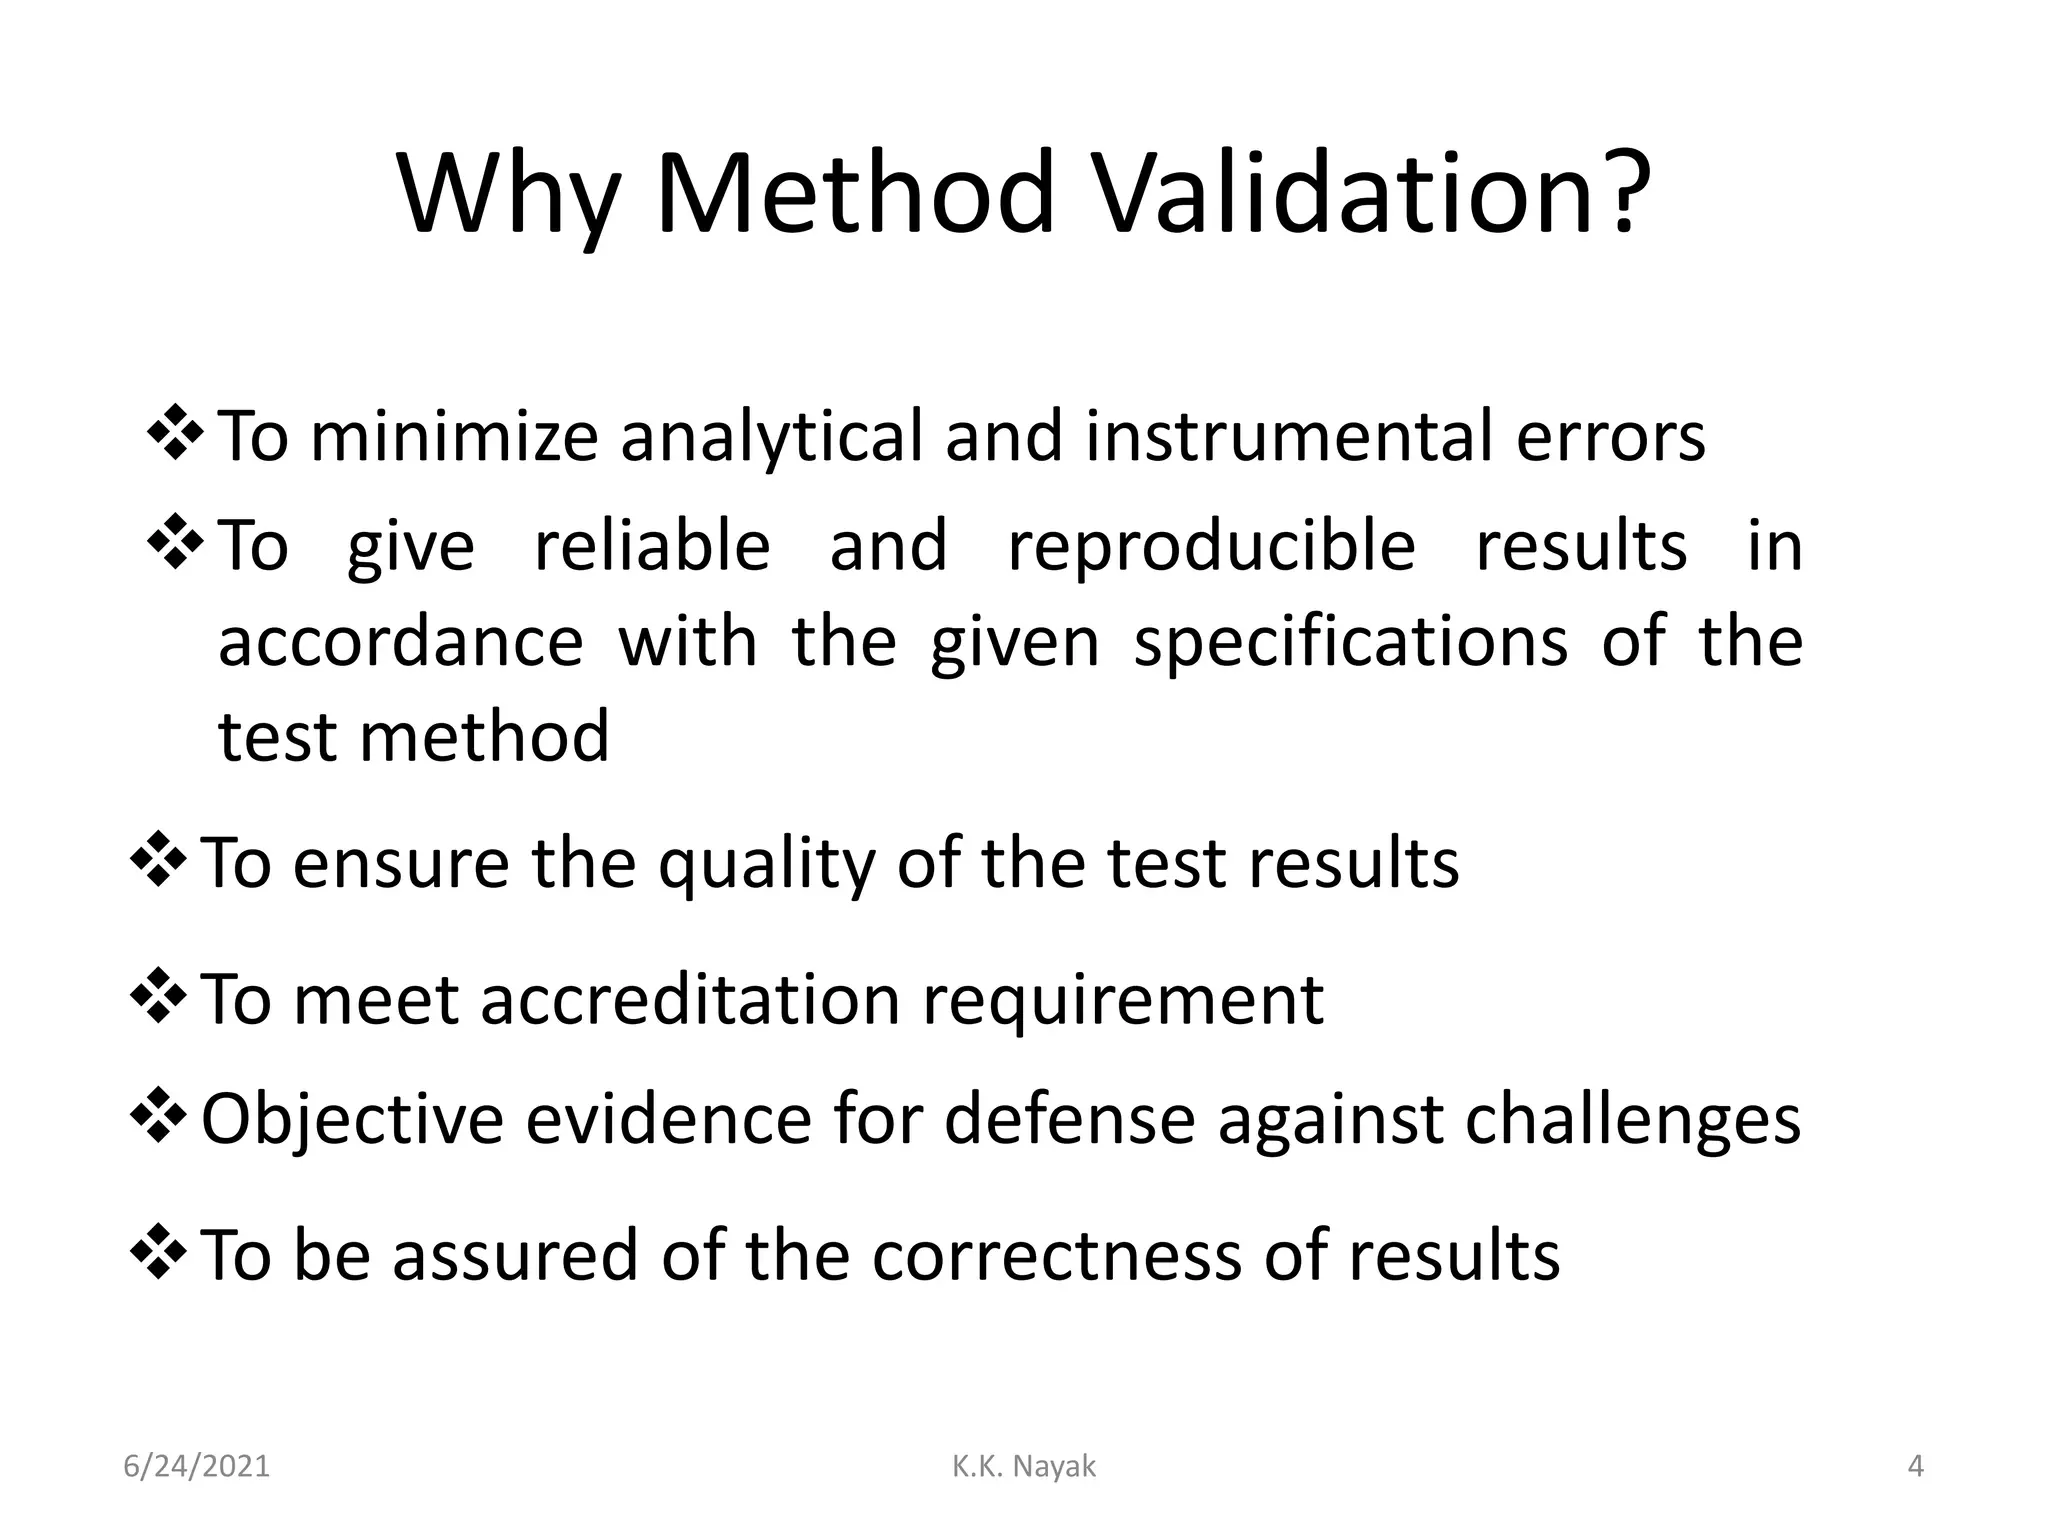
Why Method Validation?
6/24/2021K.K. Nayak 4
To minimize analytical and instrumental errors
To give reliable and reproducible results in
accordance with the given specifications of the
test method
To ensure the quality of the test results
To meet accreditation requirement
Objective evidence for defense against challenges
To be assured of the correctness of results
4.
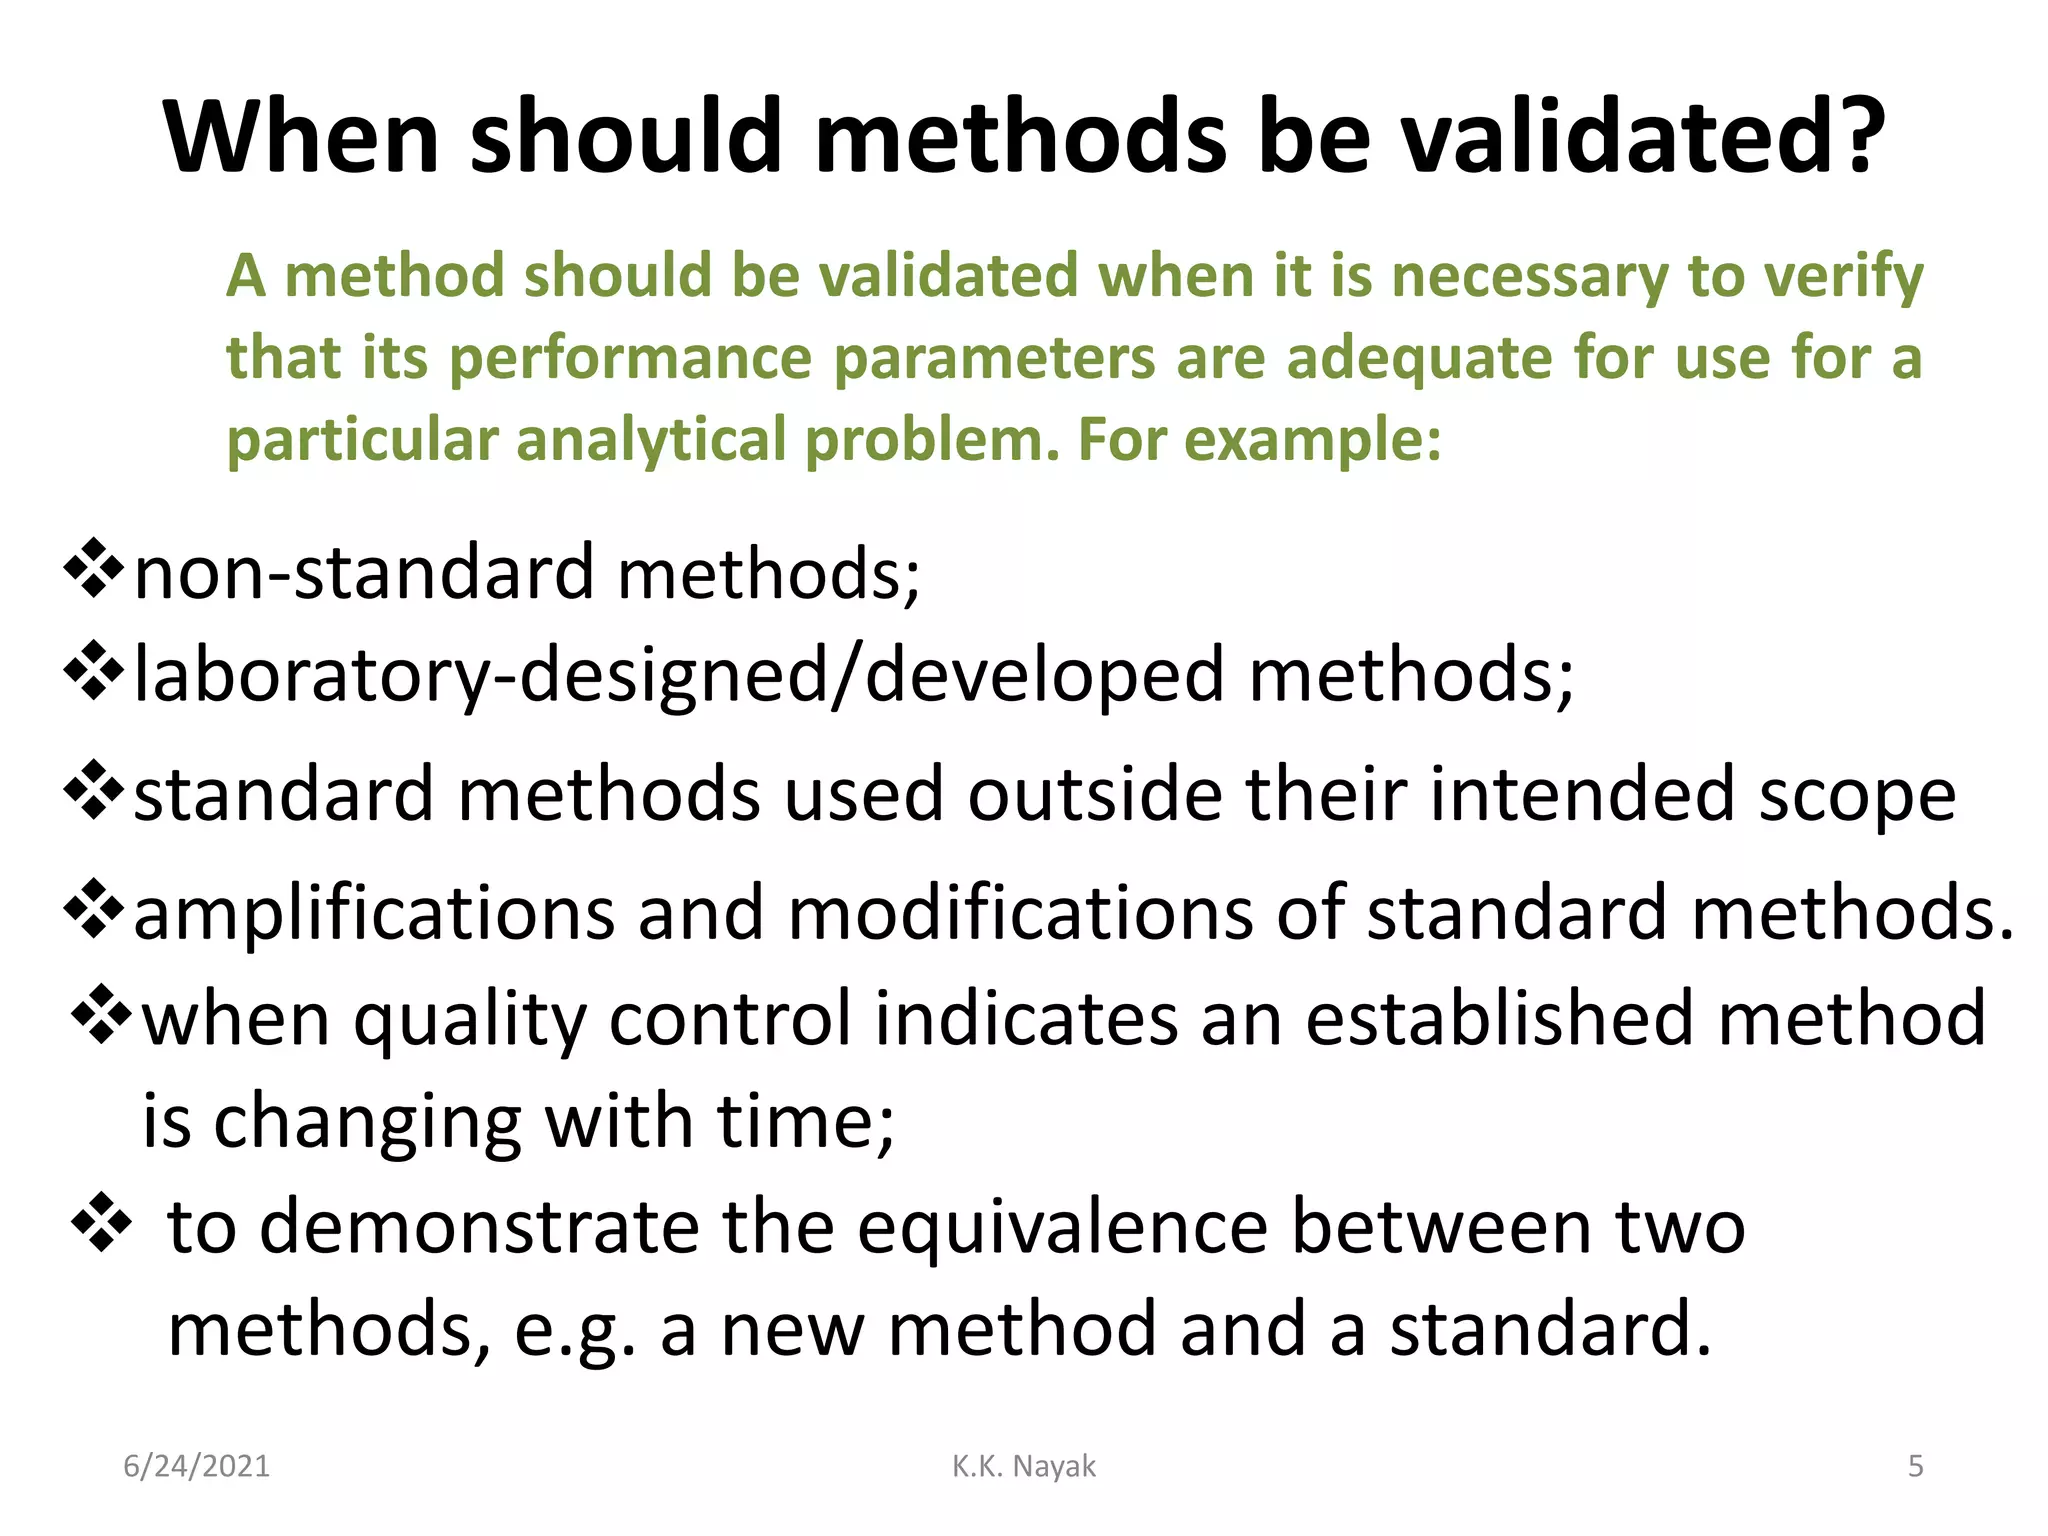
When should methodsbe validated?
6/24/2021 K.K. Nayak 5
A method should be validated when it is necessary to verify
that its performance parameters are adequate for use for a
particular analytical problem. For example:
non-standard methods;
laboratory-designed/developed methods;
standard methods used outside their intended scope
amplifications and modifications of standard methods.
to demonstrate the equivalence between two
methods, e.g. a new method and a standard.
when quality control indicates an established method
is changing with time;
5.
When Method ValidationNot
Required?
• Standard methods on condition that
– used within their scope of applicability (e.g.
matrices, ranges, etc)
– without modifications
6/24/2021 K.K. Nayak 6
6.
Who carries outmethod validation?
The laboratory using a method is responsible for ensuring that it
is adequately validated, and if necessary for carrying out
further work to supplement existing data. For example, where
a method has been validated by a standards approving
organisation, such as AOAC International, the user will
normally need only to establish performance data for their
own use of the method.
6/24/2021 K.K. Nayak 7
7.
EXTENT OF VALIDATIONSTUDIES
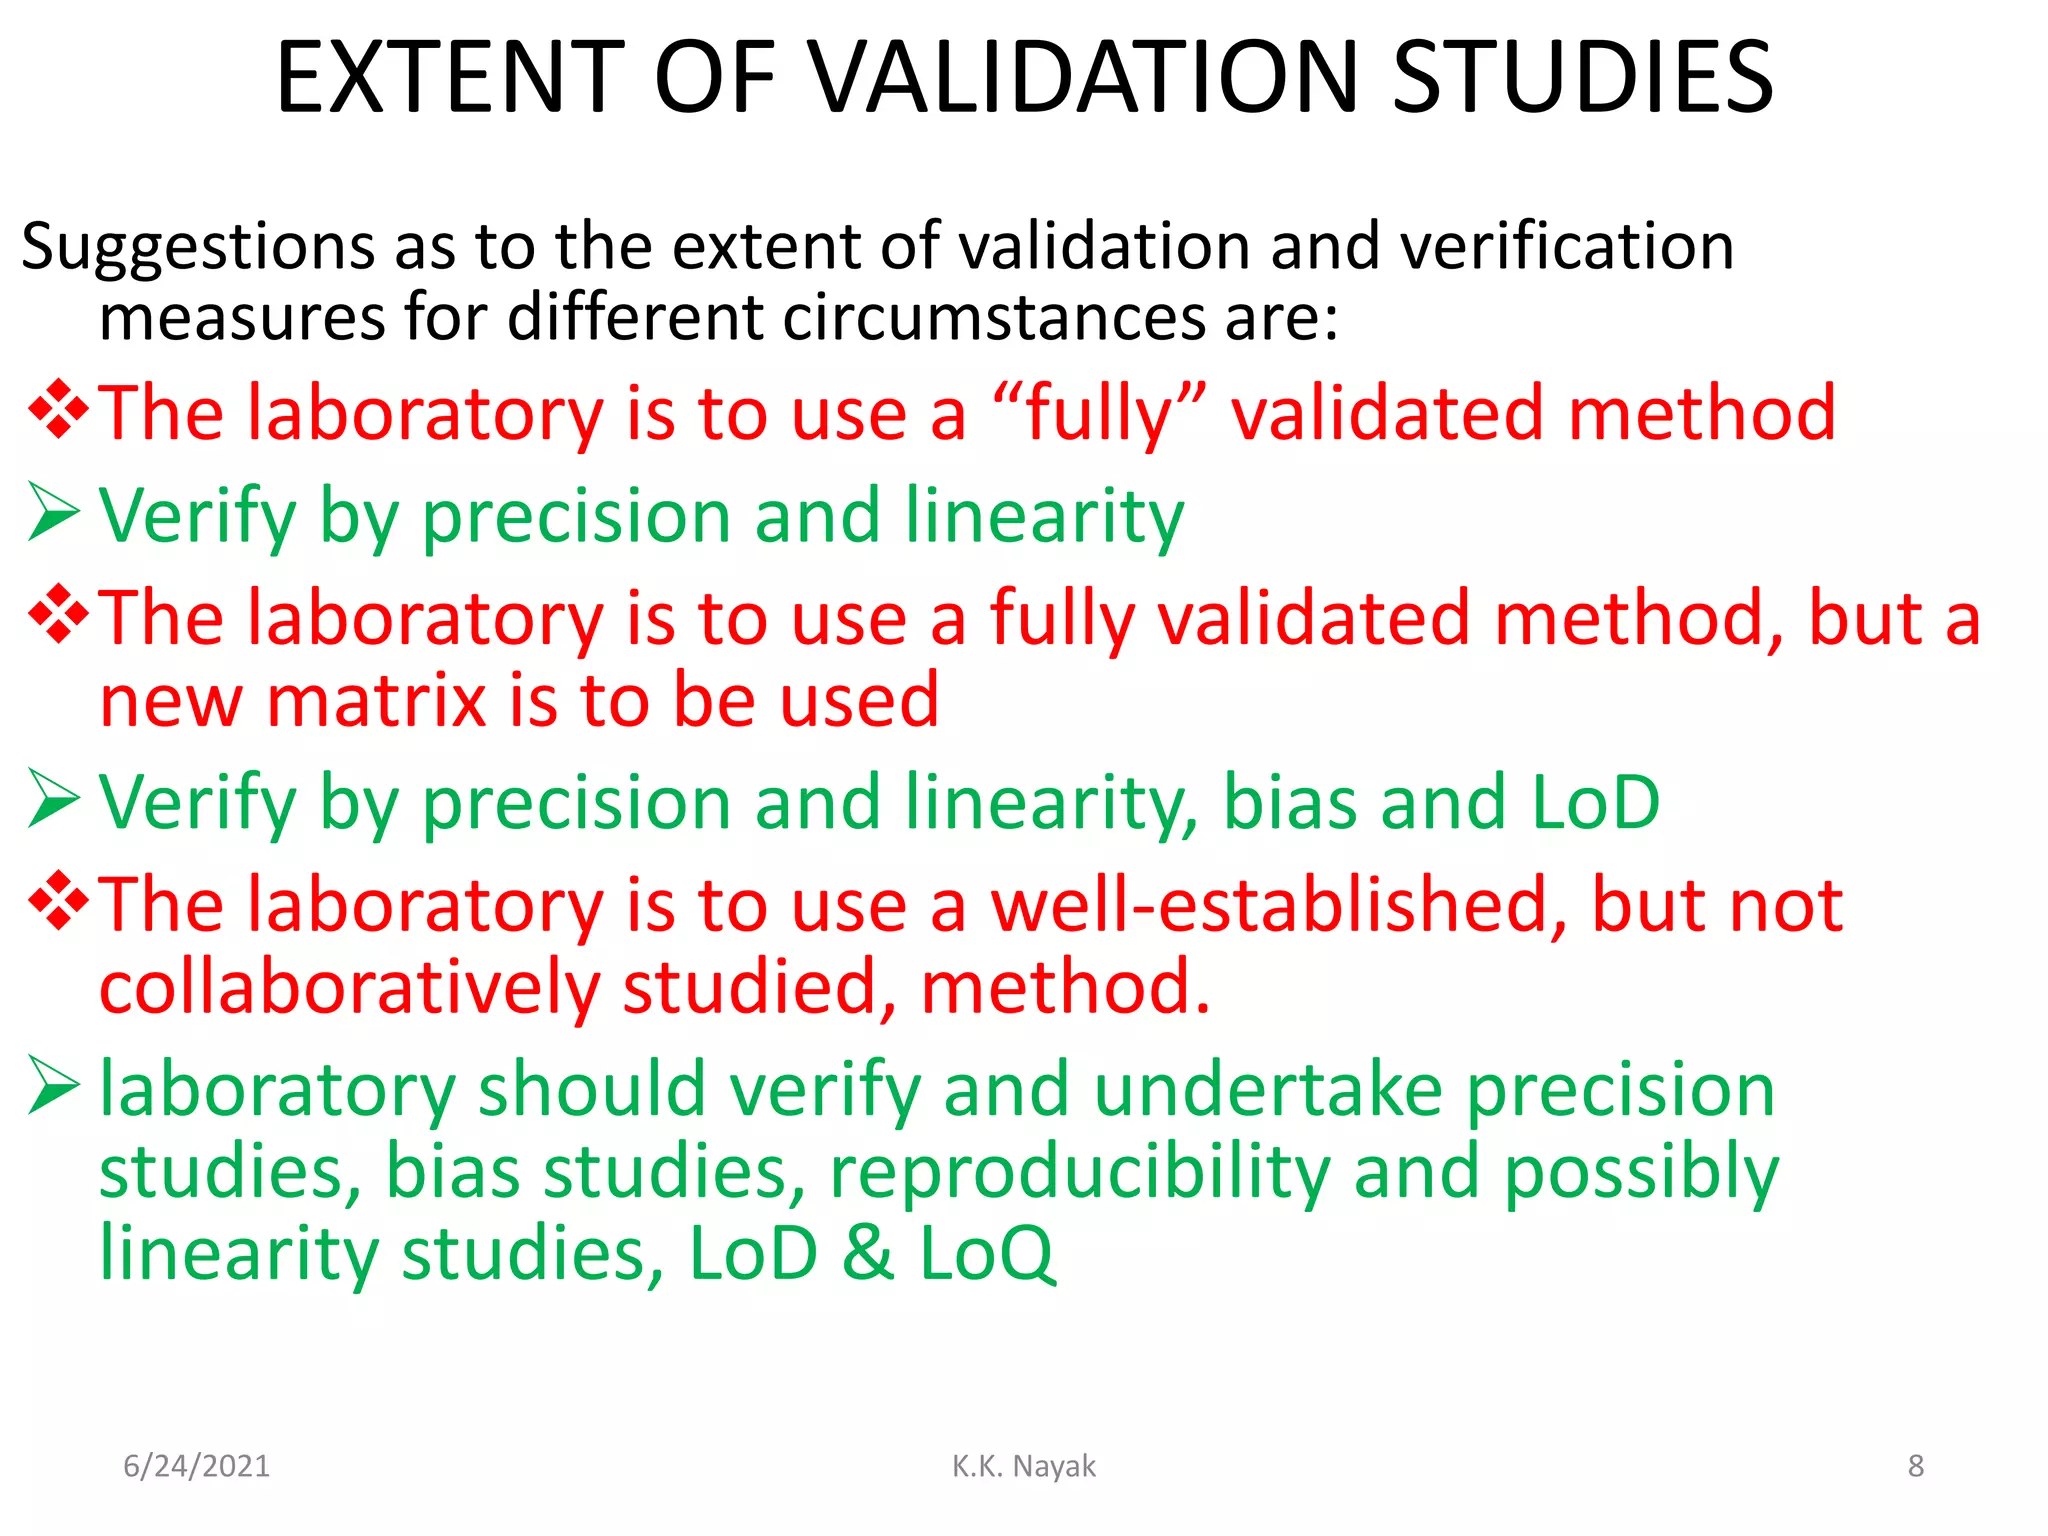
Suggestions as to the extent of validation and verification
measures for different circumstances are:
The laboratory is to use a “fully” validated method
Verify by precision and linearity
The laboratory is to use a fully validated method, but a
new matrix is to be used
Verify by precision and linearity, bias and LoD
The laboratory is to use a well-established, but not
collaboratively studied, method.
laboratory should verify and undertake precision
studies, bias studies, reproducibility and possibly
linearity studies, LoD & LoQ
6/24/2021 K.K. Nayak 8
8.
EXTENT OF VALIDATIONSTUDIES
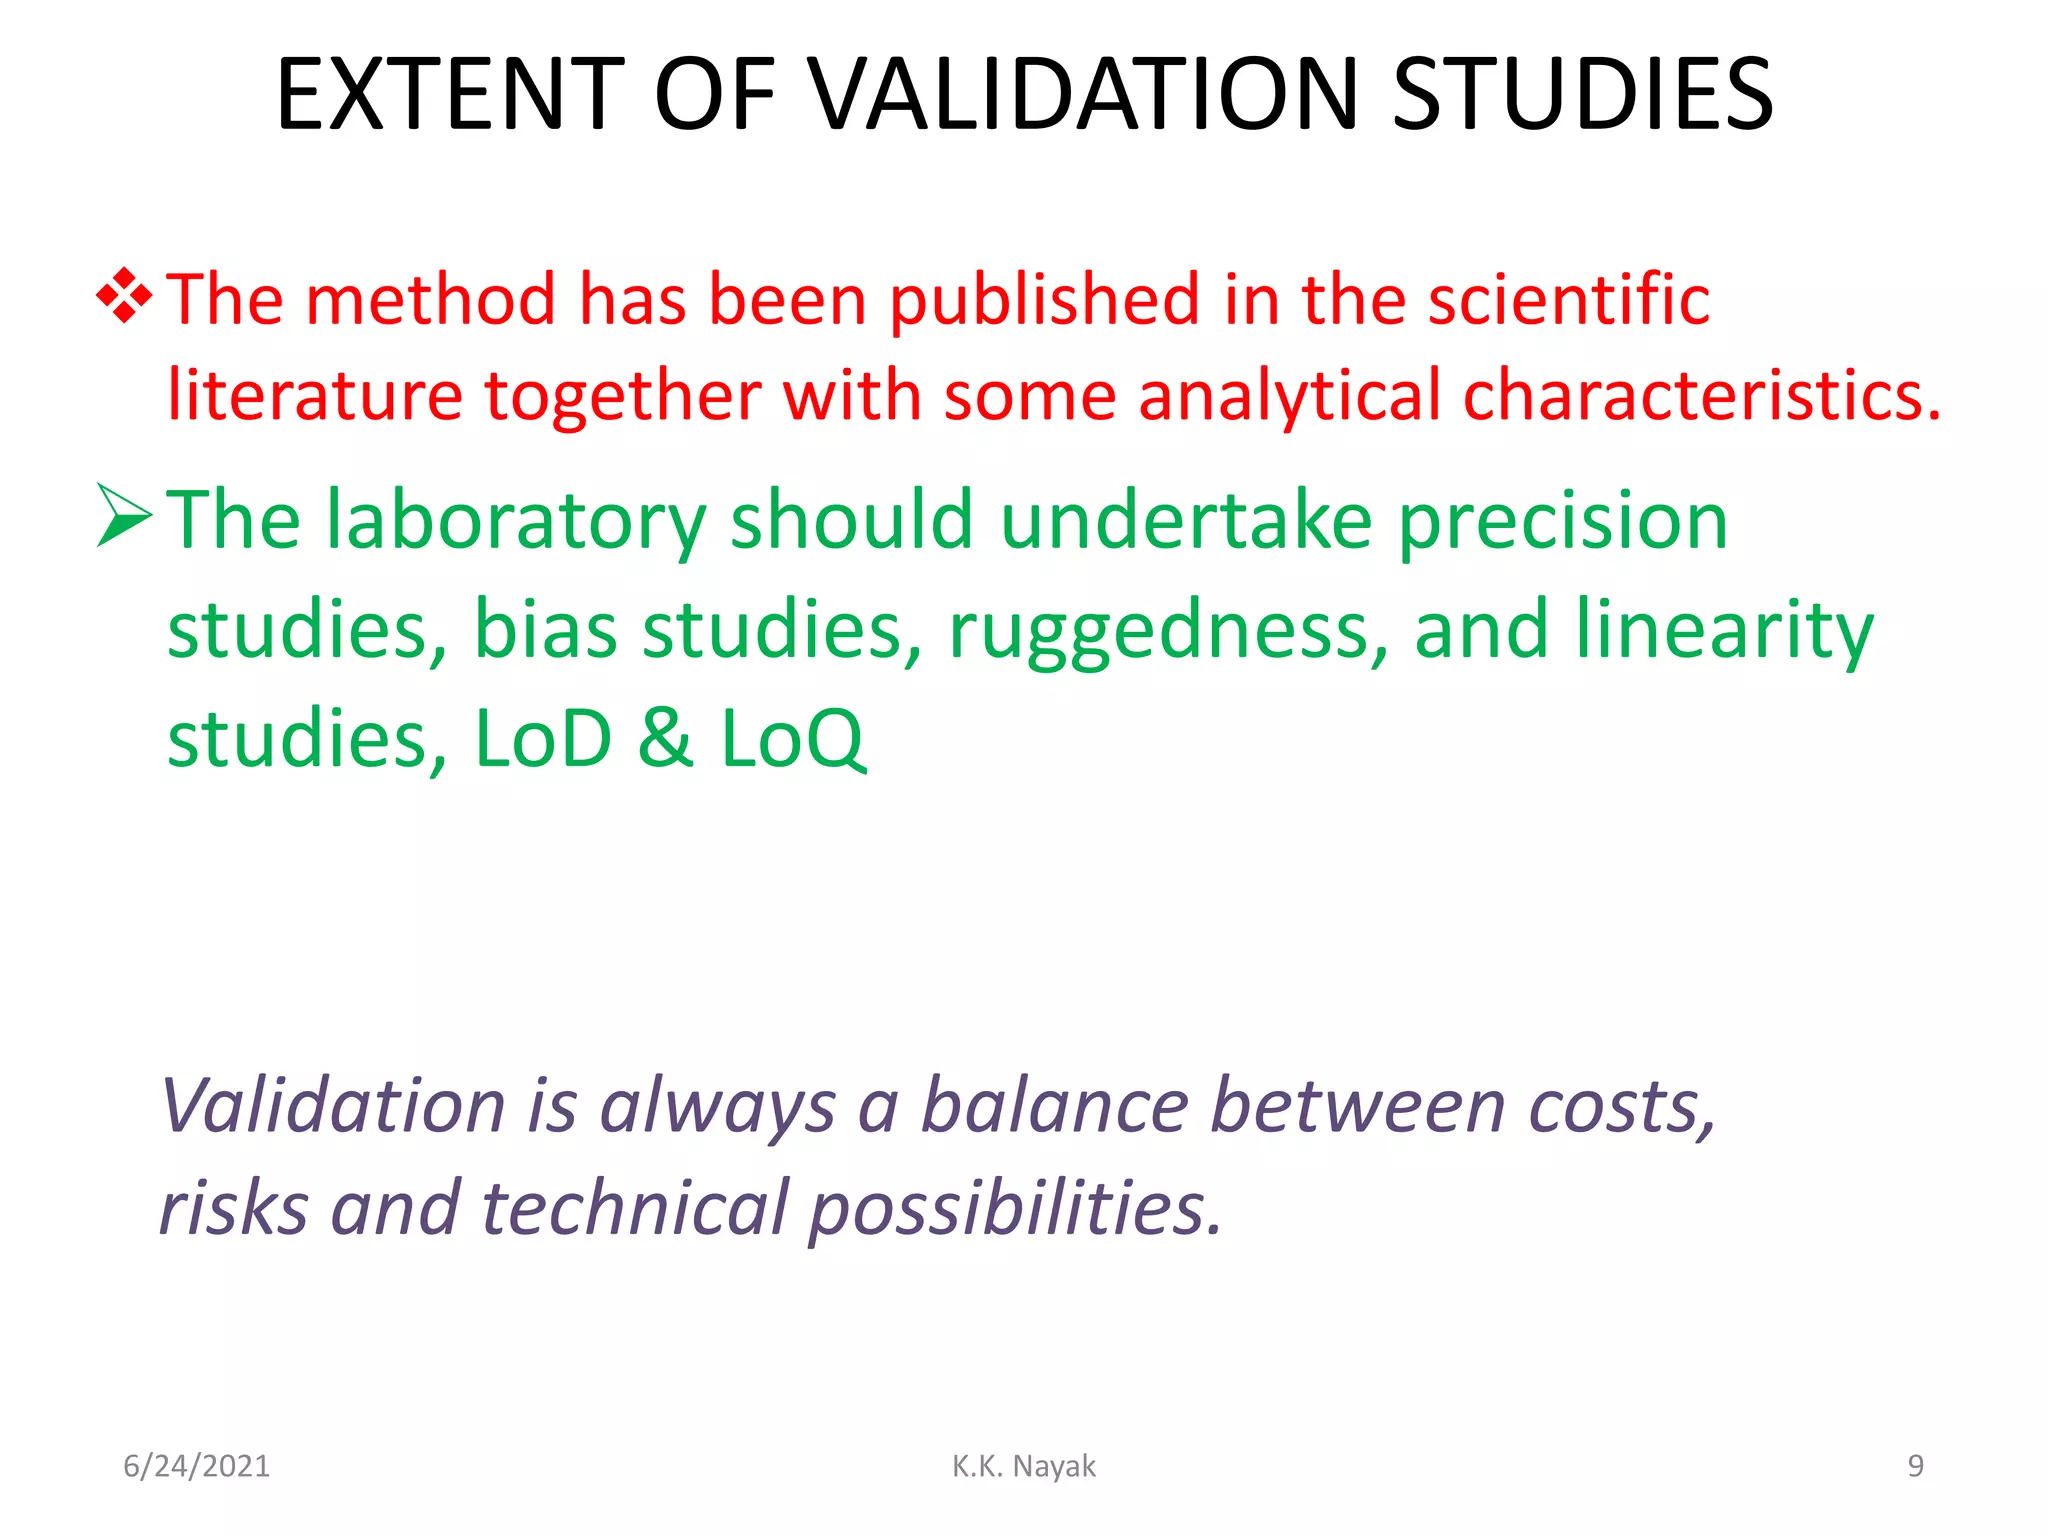
The method has been published in the scientific
literature together with some analytical characteristics.
The laboratory should undertake precision
studies, bias studies, ruggedness, and linearity
studies, LoD & LoQ
6/24/2021 K.K. Nayak 9
Validation is always a balance between costs,
risks and technical possibilities.
9.
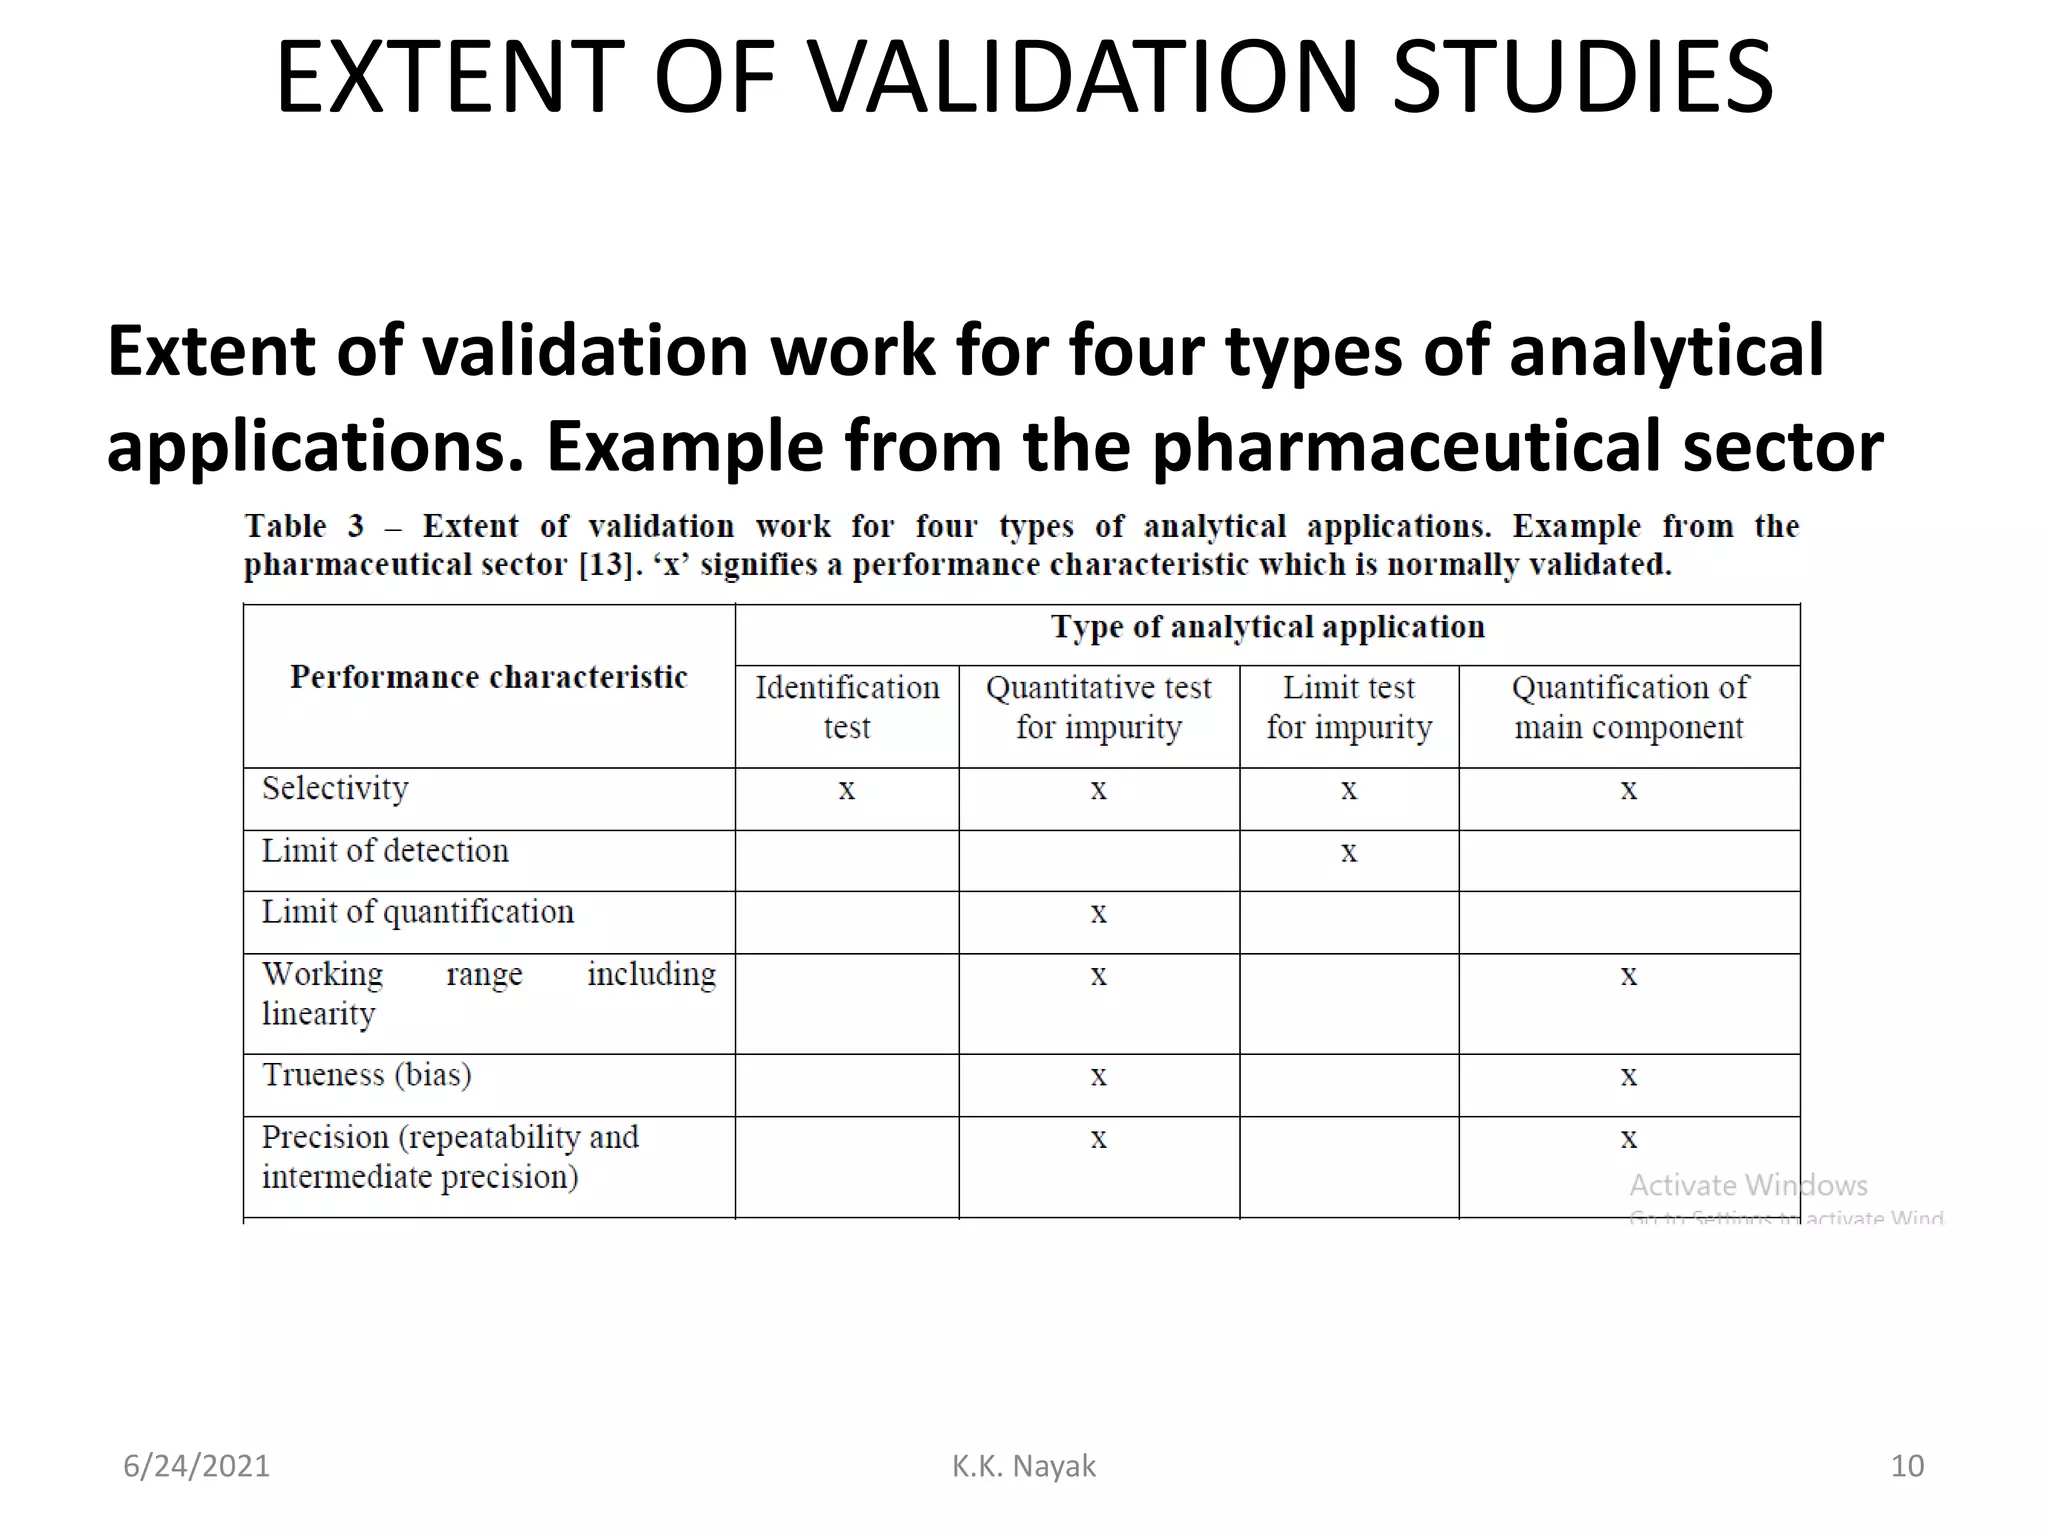
EXTENT OF VALIDATIONSTUDIES
6/24/2021 K.K. Nayak 10
Extent of validation work for four types of analytical
applications. Example from the pharmaceutical sector
10.
Deciding what degreeof validation is
required
• The laboratory has to decide which method performance
parameters need to be characterised in order to validate the
method.
6/24/2021 K.K. Nayak 11
Validation requirements may be specified in guidelines within
a particular sector of measurement relevant to the method
and it is recommended that where these are available they
are followed. For example validation of a method for food
analysis should be consistent with the validation strategy
used by AOAC International.
11.
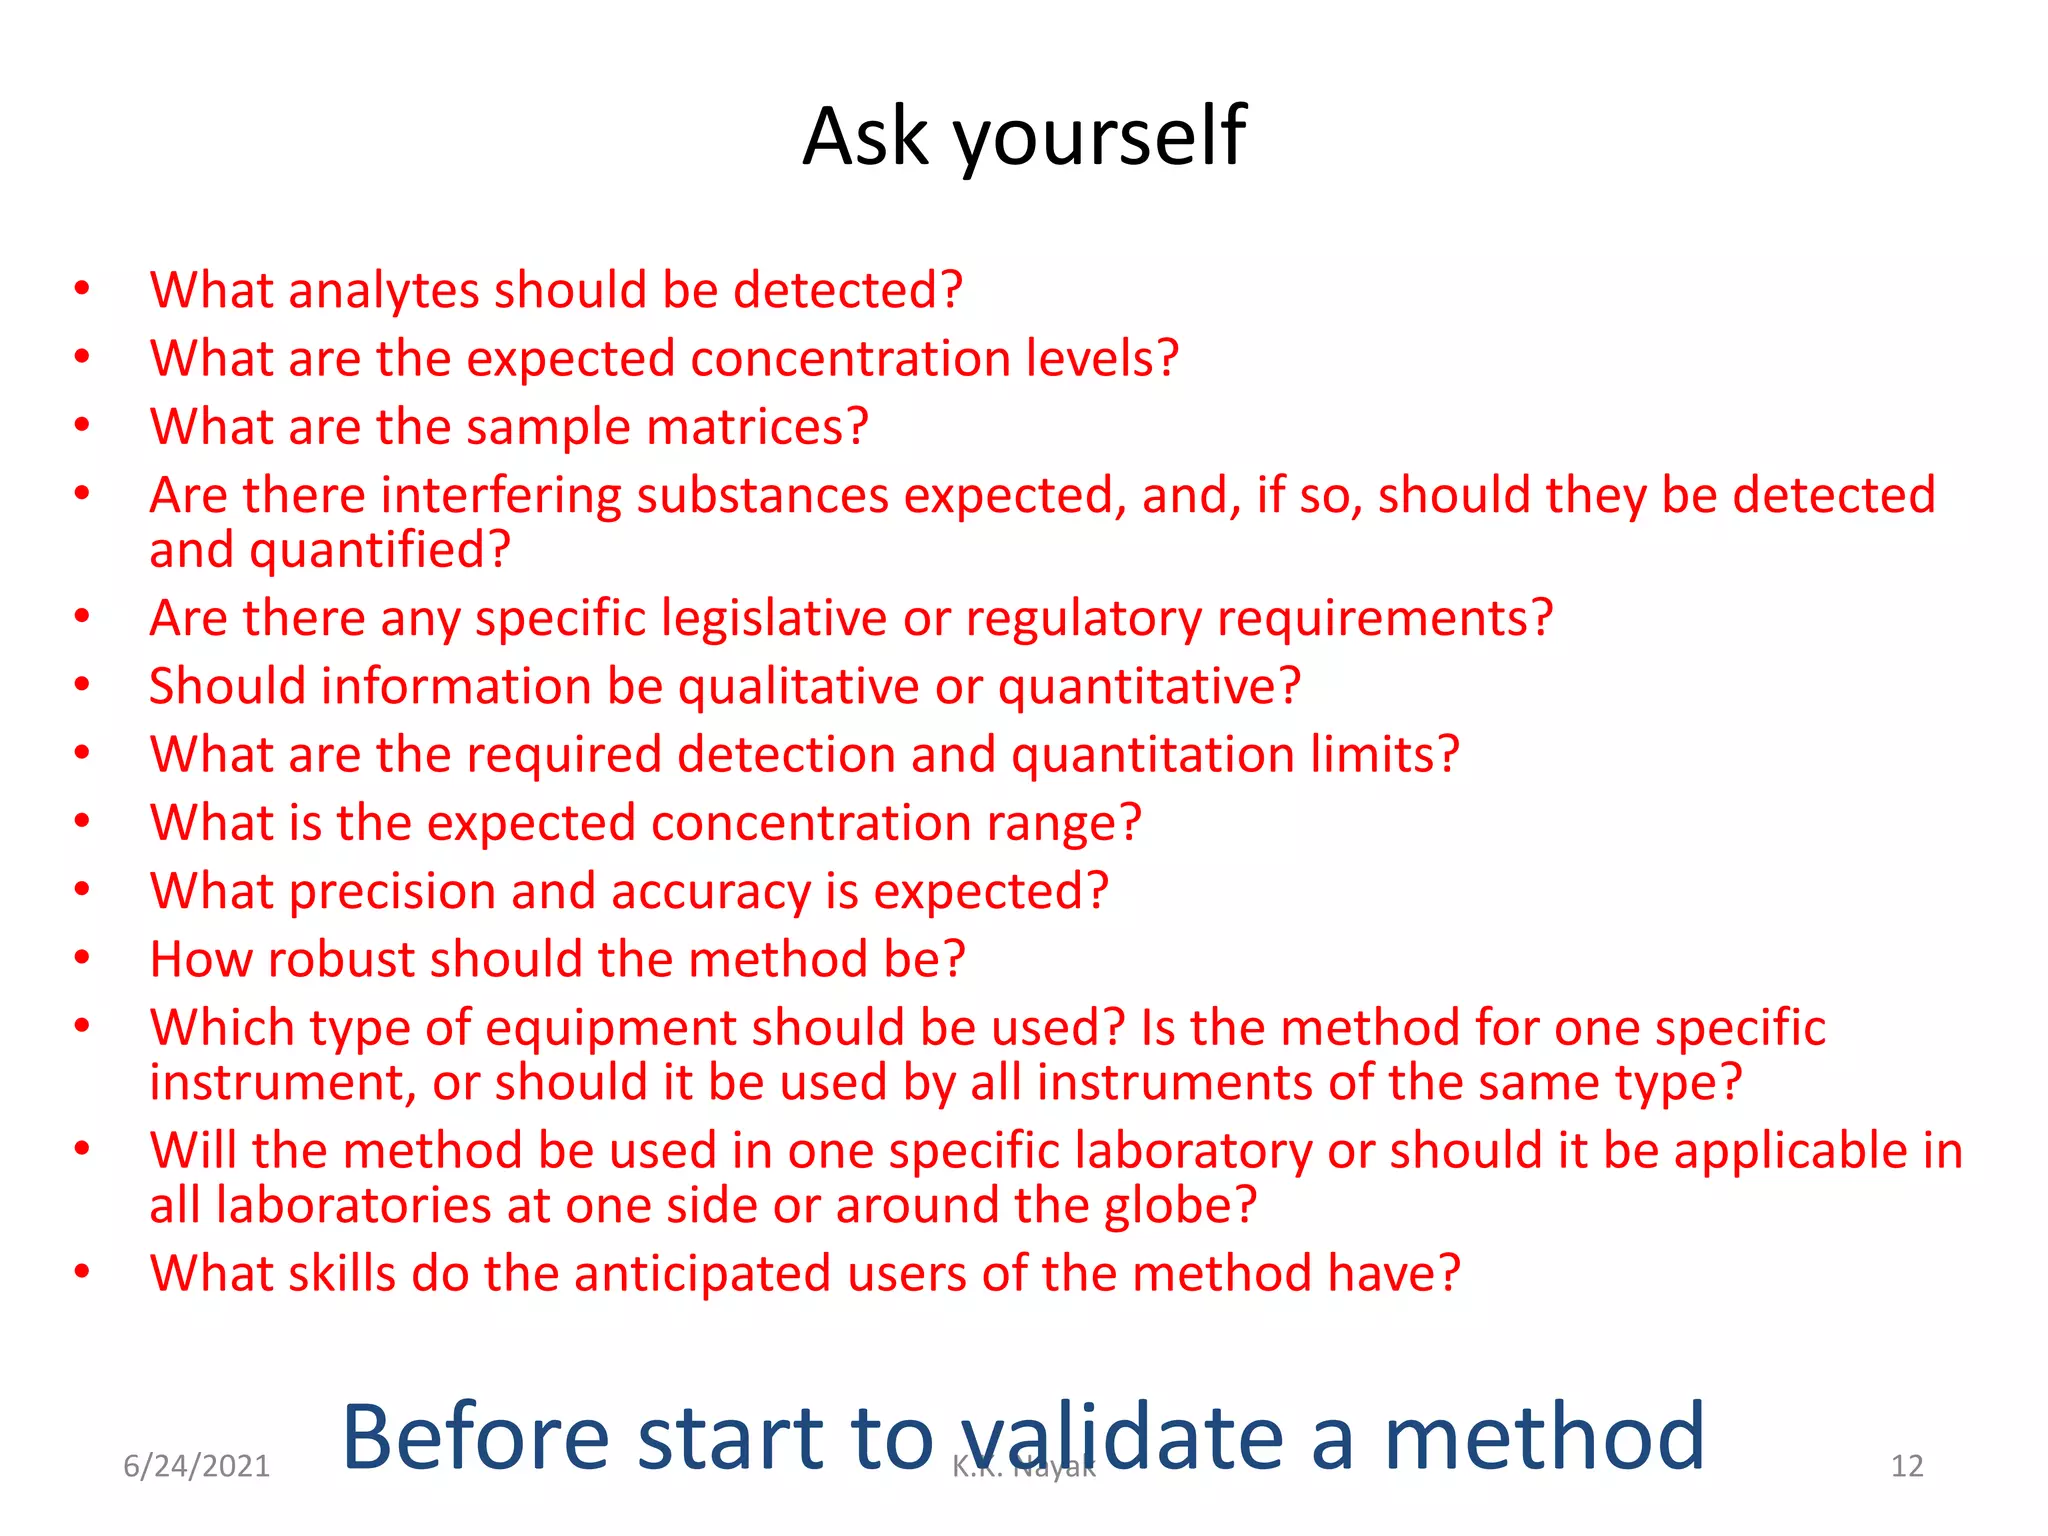
Ask yourself
• Whatanalytes should be detected?
• What are the expected concentration levels?
• What are the sample matrices?
• Are there interfering substances expected, and, if so, should they be detected
and quantified?
• Are there any specific legislative or regulatory requirements?
• Should information be qualitative or quantitative?
• What are the required detection and quantitation limits?
• What is the expected concentration range?
• What precision and accuracy is expected?
• How robust should the method be?
• Which type of equipment should be used? Is the method for one specific
instrument, or should it be used by all instruments of the same type?
• Will the method be used in one specific laboratory or should it be applicable in
all laboratories at one side or around the globe?
• What skills do the anticipated users of the method have?
6/24/2021 K.K. Nayak 12
Before start to validate a method
12.
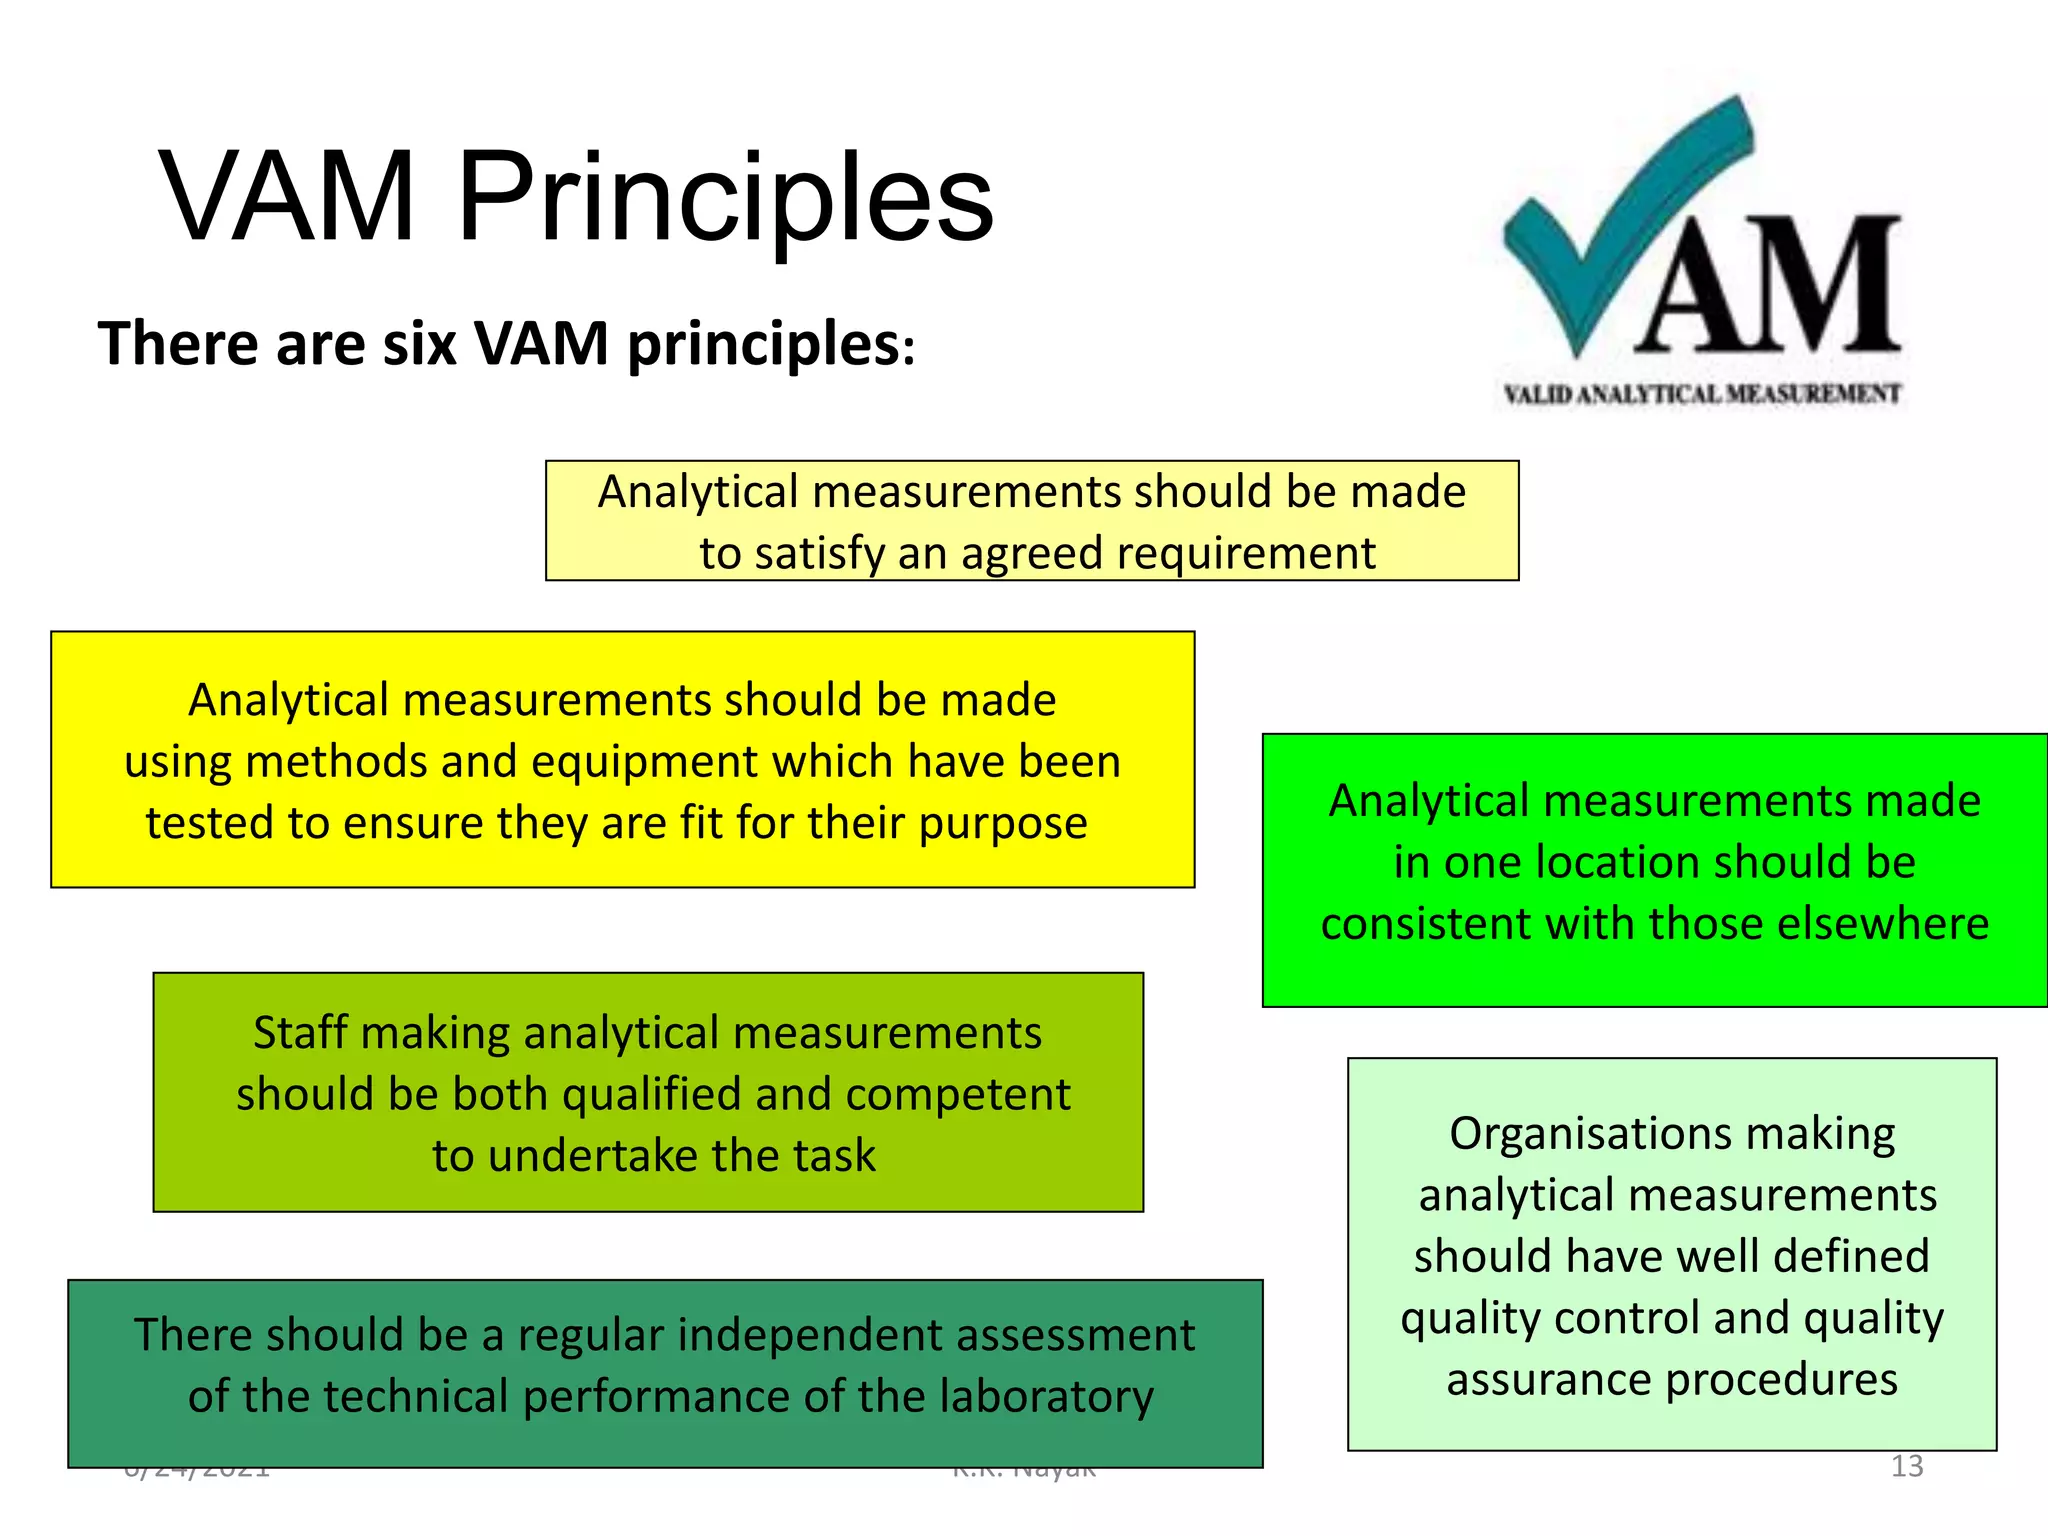
VAM Principles
6/24/2021 K.K.Nayak 13
There are six VAM principles:
Analytical measurements should be made
to satisfy an agreed requirement
Analytical measurements should be made
using methods and equipment which have been
tested to ensure they are fit for their purpose
Staff making analytical measurements
should be both qualified and competent
to undertake the task
There should be a regular independent assessment
of the technical performance of the laboratory
Analytical measurements made
in one location should be
consistent with those elsewhere
Organisations making
analytical measurements
should have well defined
quality control and quality
assurance procedures
13.
Method development
and validation
6/24/2021K.K. Nayak 14
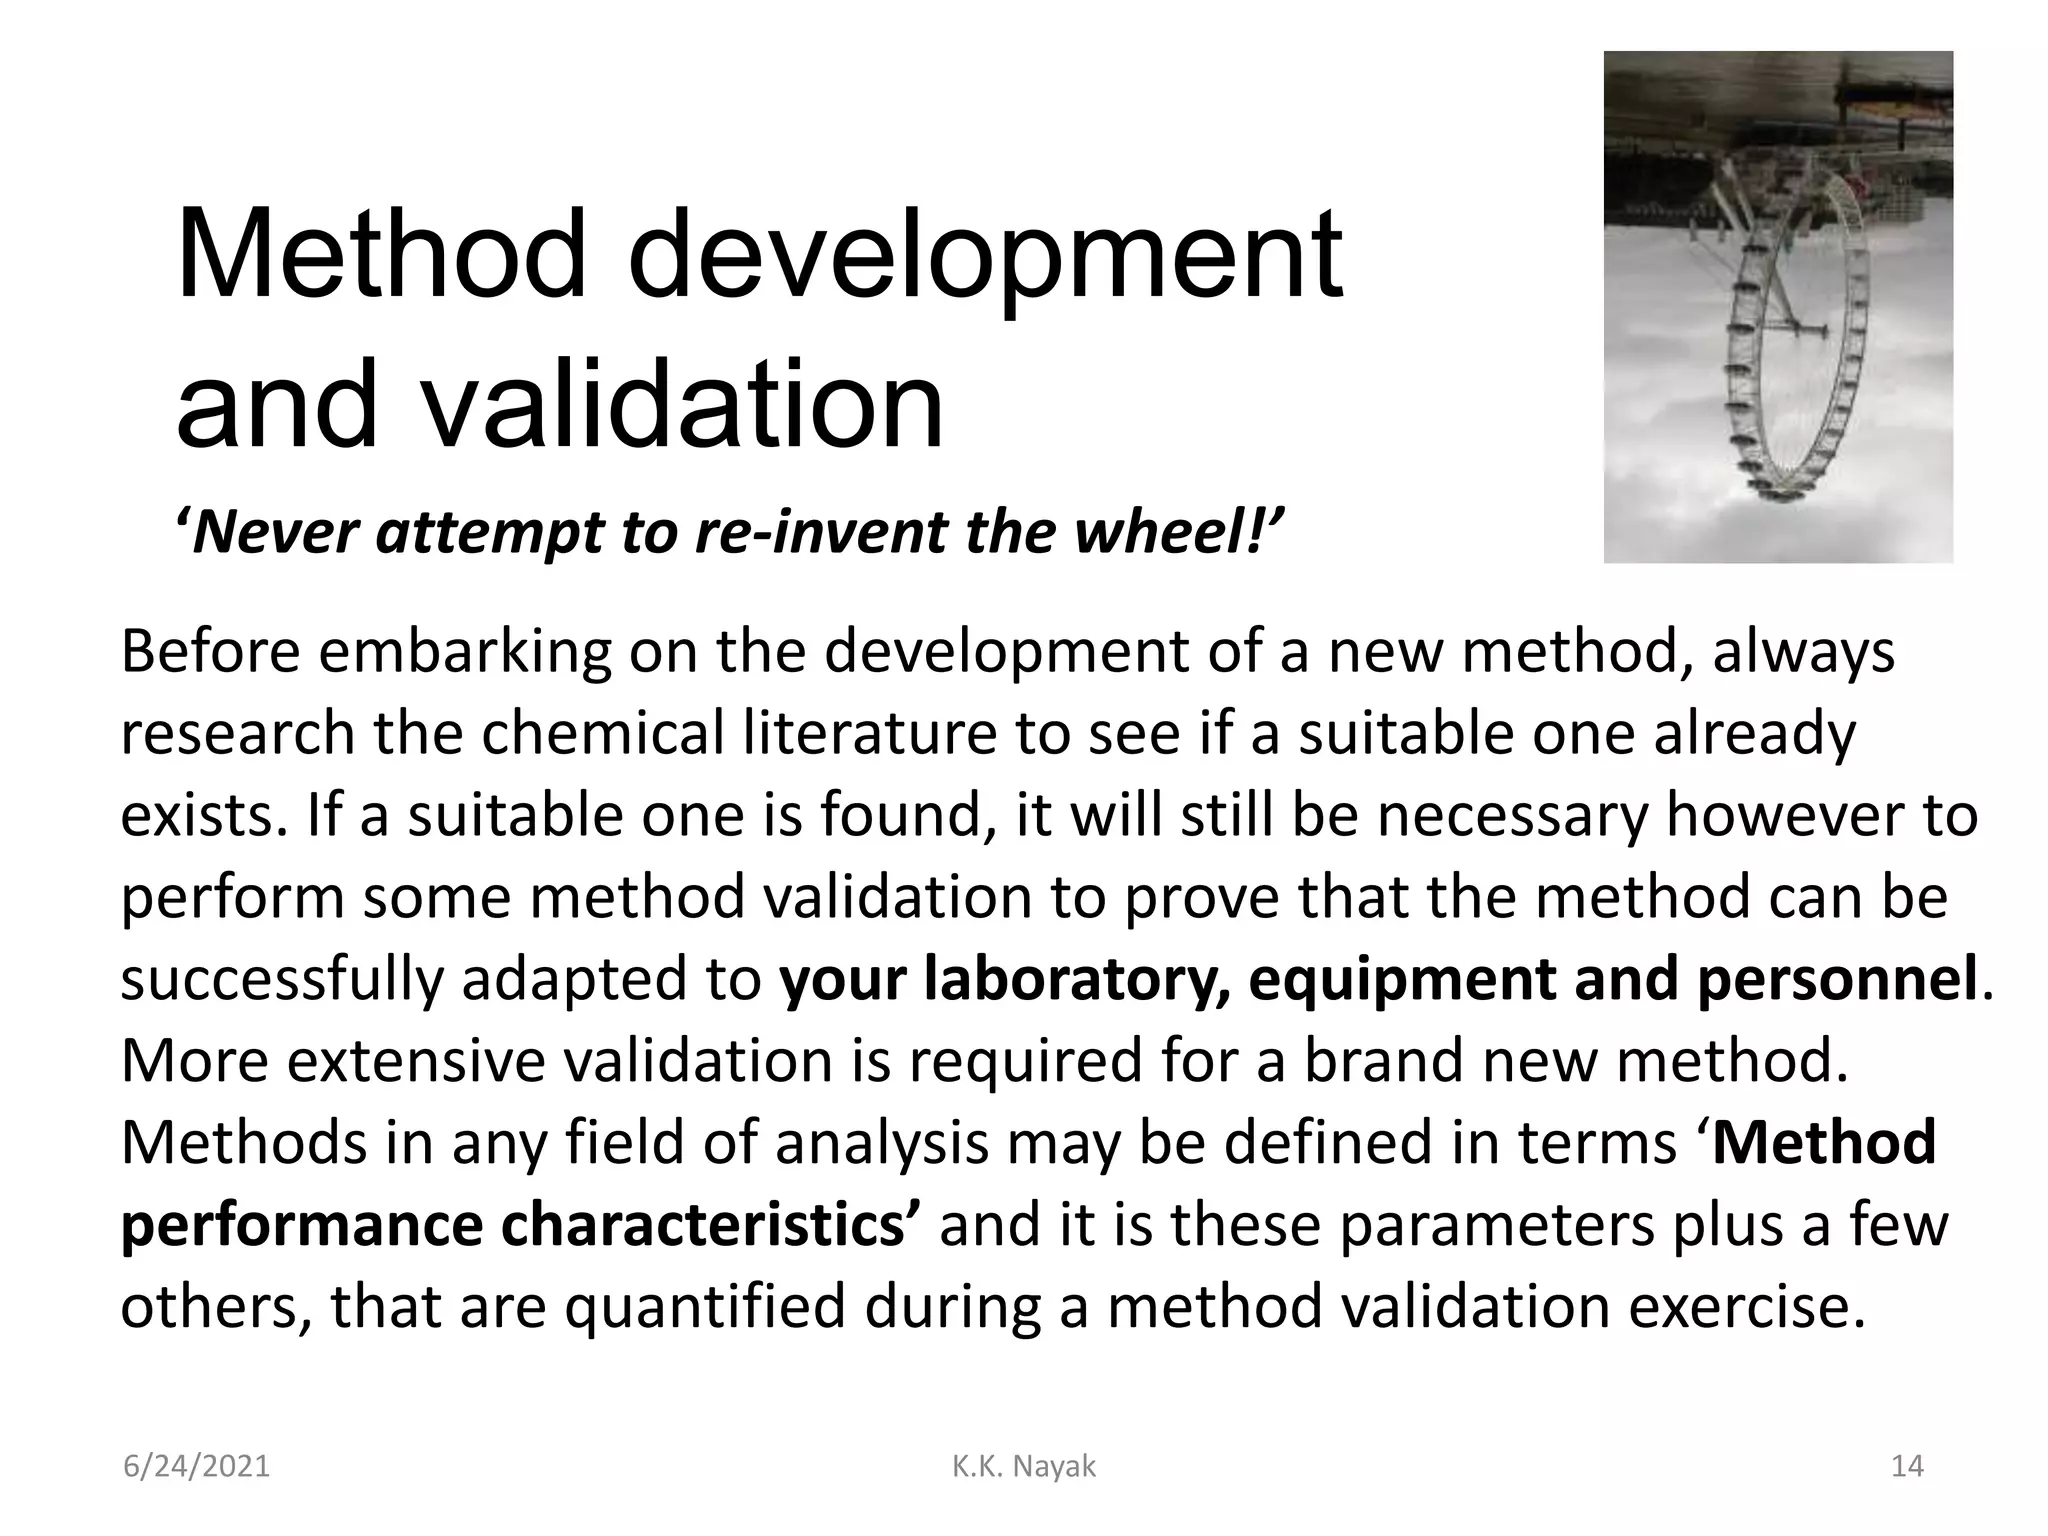
‘Never attempt to re-invent the wheel!’
Before embarking on the development of a new method, always
research the chemical literature to see if a suitable one already
exists. If a suitable one is found, it will still be necessary however to
perform some method validation to prove that the method can be
successfully adapted to your laboratory, equipment and personnel.
More extensive validation is required for a brand new method.
Methods in any field of analysis may be defined in terms ‘Method
performance characteristics’ and it is these parameters plus a few
others, that are quantified during a method validation exercise.
14.
Method validation
6/24/2021 K.K.Nayak 15
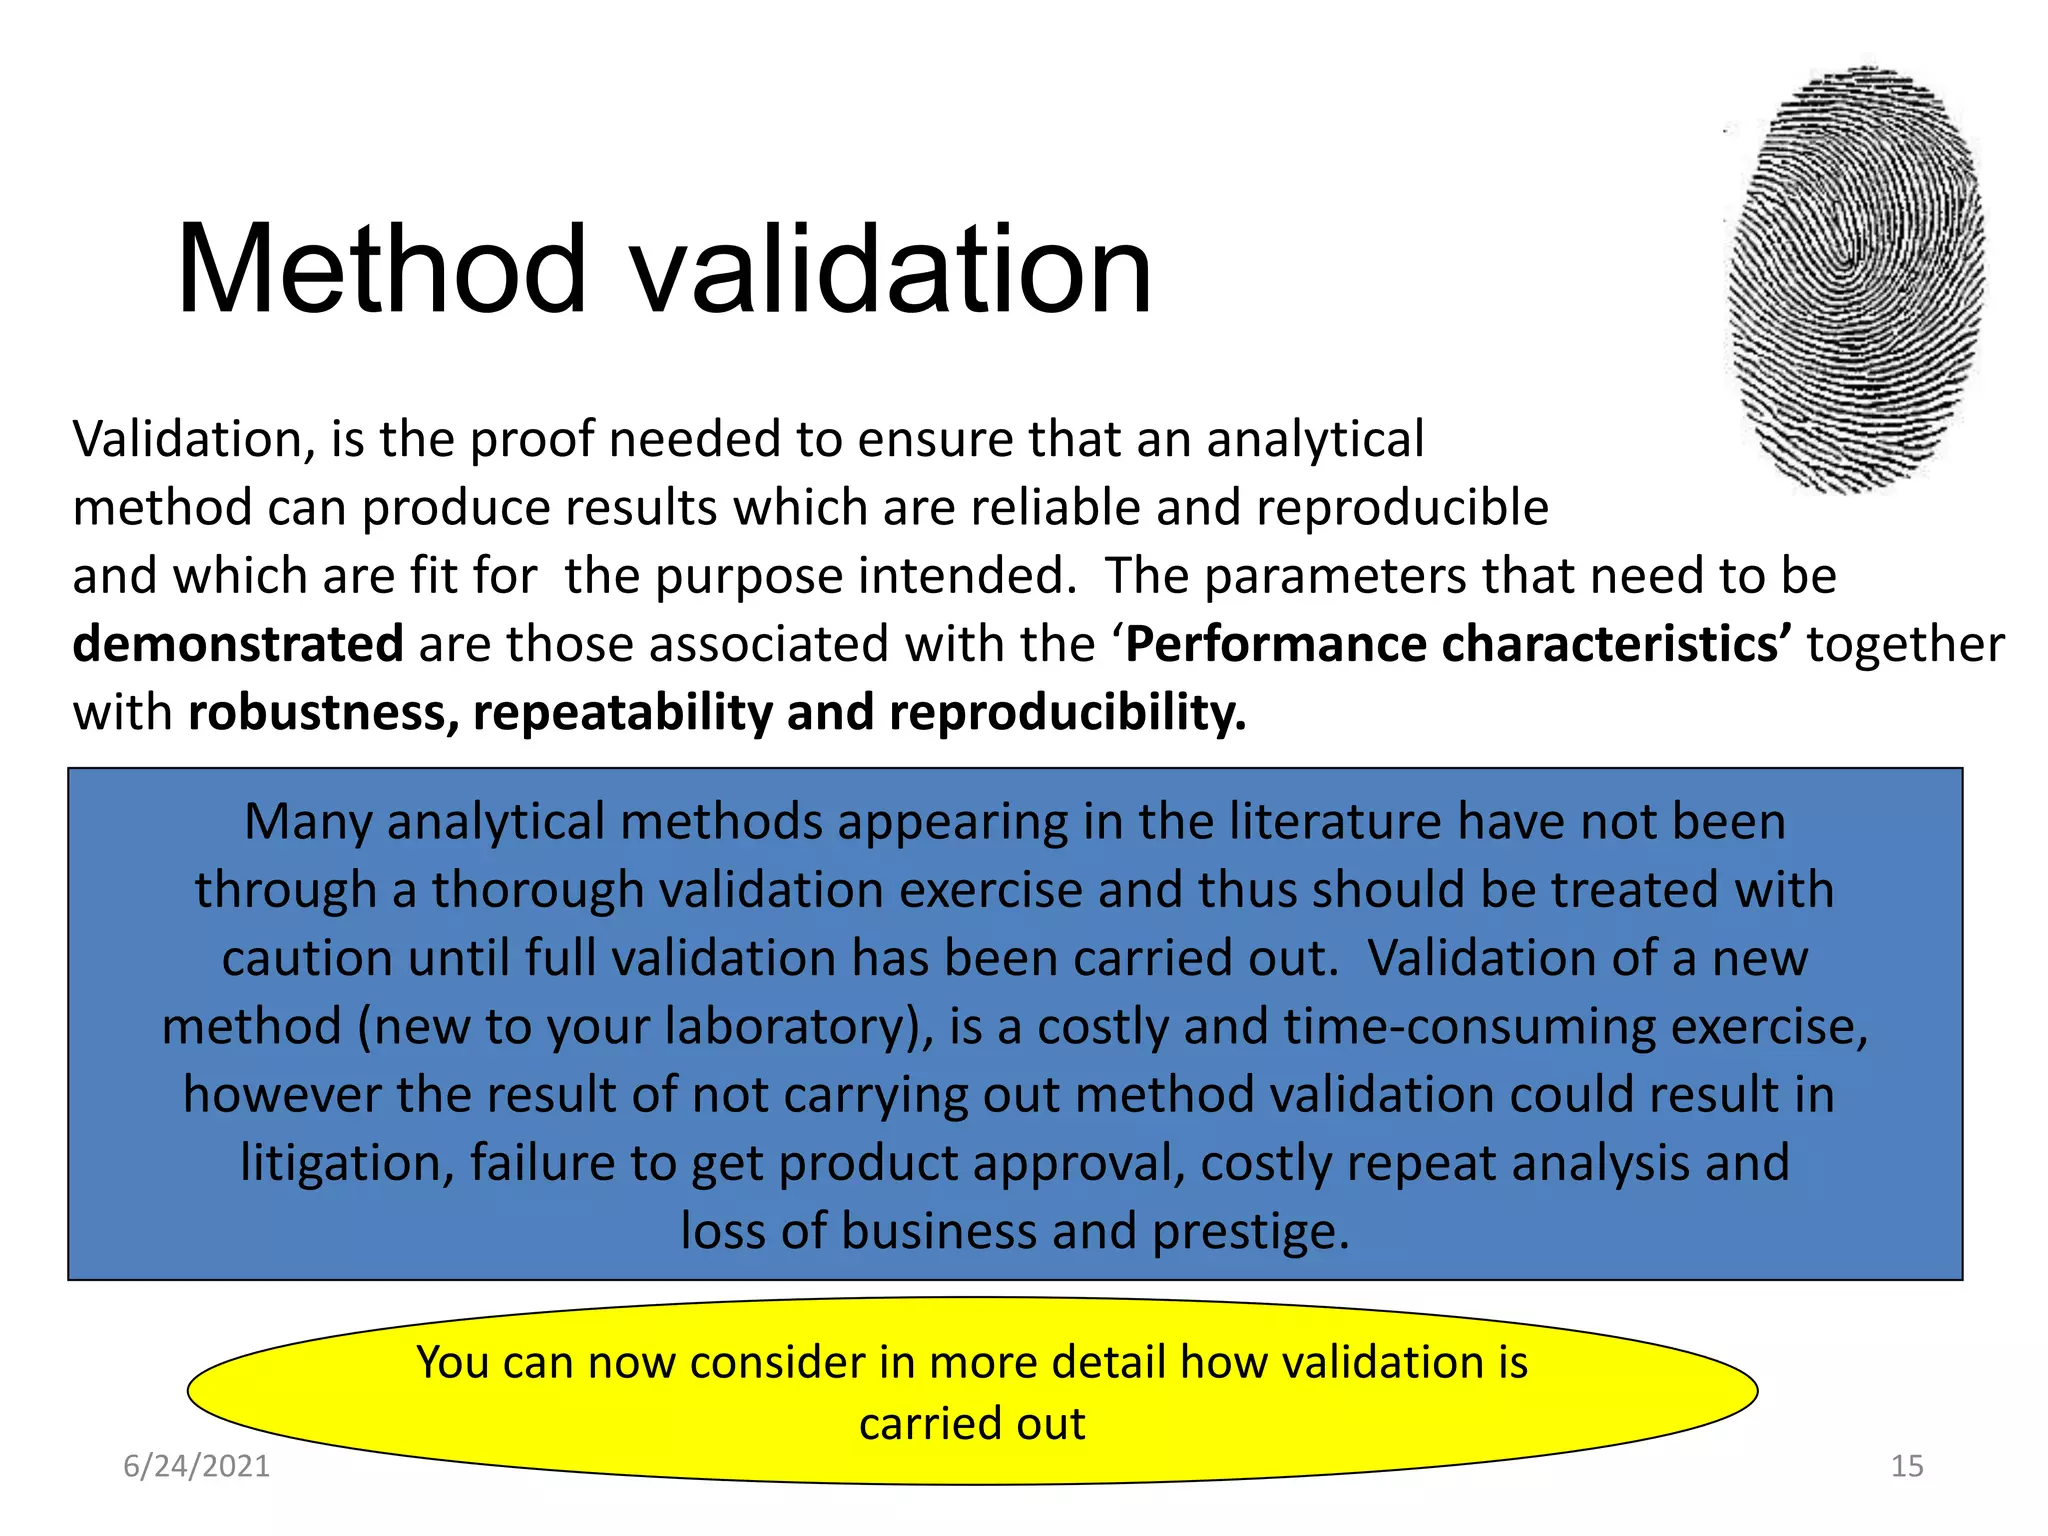
Validation, is the proof needed to ensure that an analytical
method can produce results which are reliable and reproducible
and which are fit for the purpose intended. The parameters that need to be
demonstrated are those associated with the ‘Performance characteristics’ together
with robustness, repeatability and reproducibility.
Many analytical methods appearing in the literature have not been
through a thorough validation exercise and thus should be treated with
caution until full validation has been carried out. Validation of a new
method (new to your laboratory), is a costly and time-consuming exercise,
however the result of not carrying out method validation could result in
litigation, failure to get product approval, costly repeat analysis and
loss of business and prestige.
You can now consider in more detail how validation is
carried out
Method performance
characteristics
6/24/2021 17
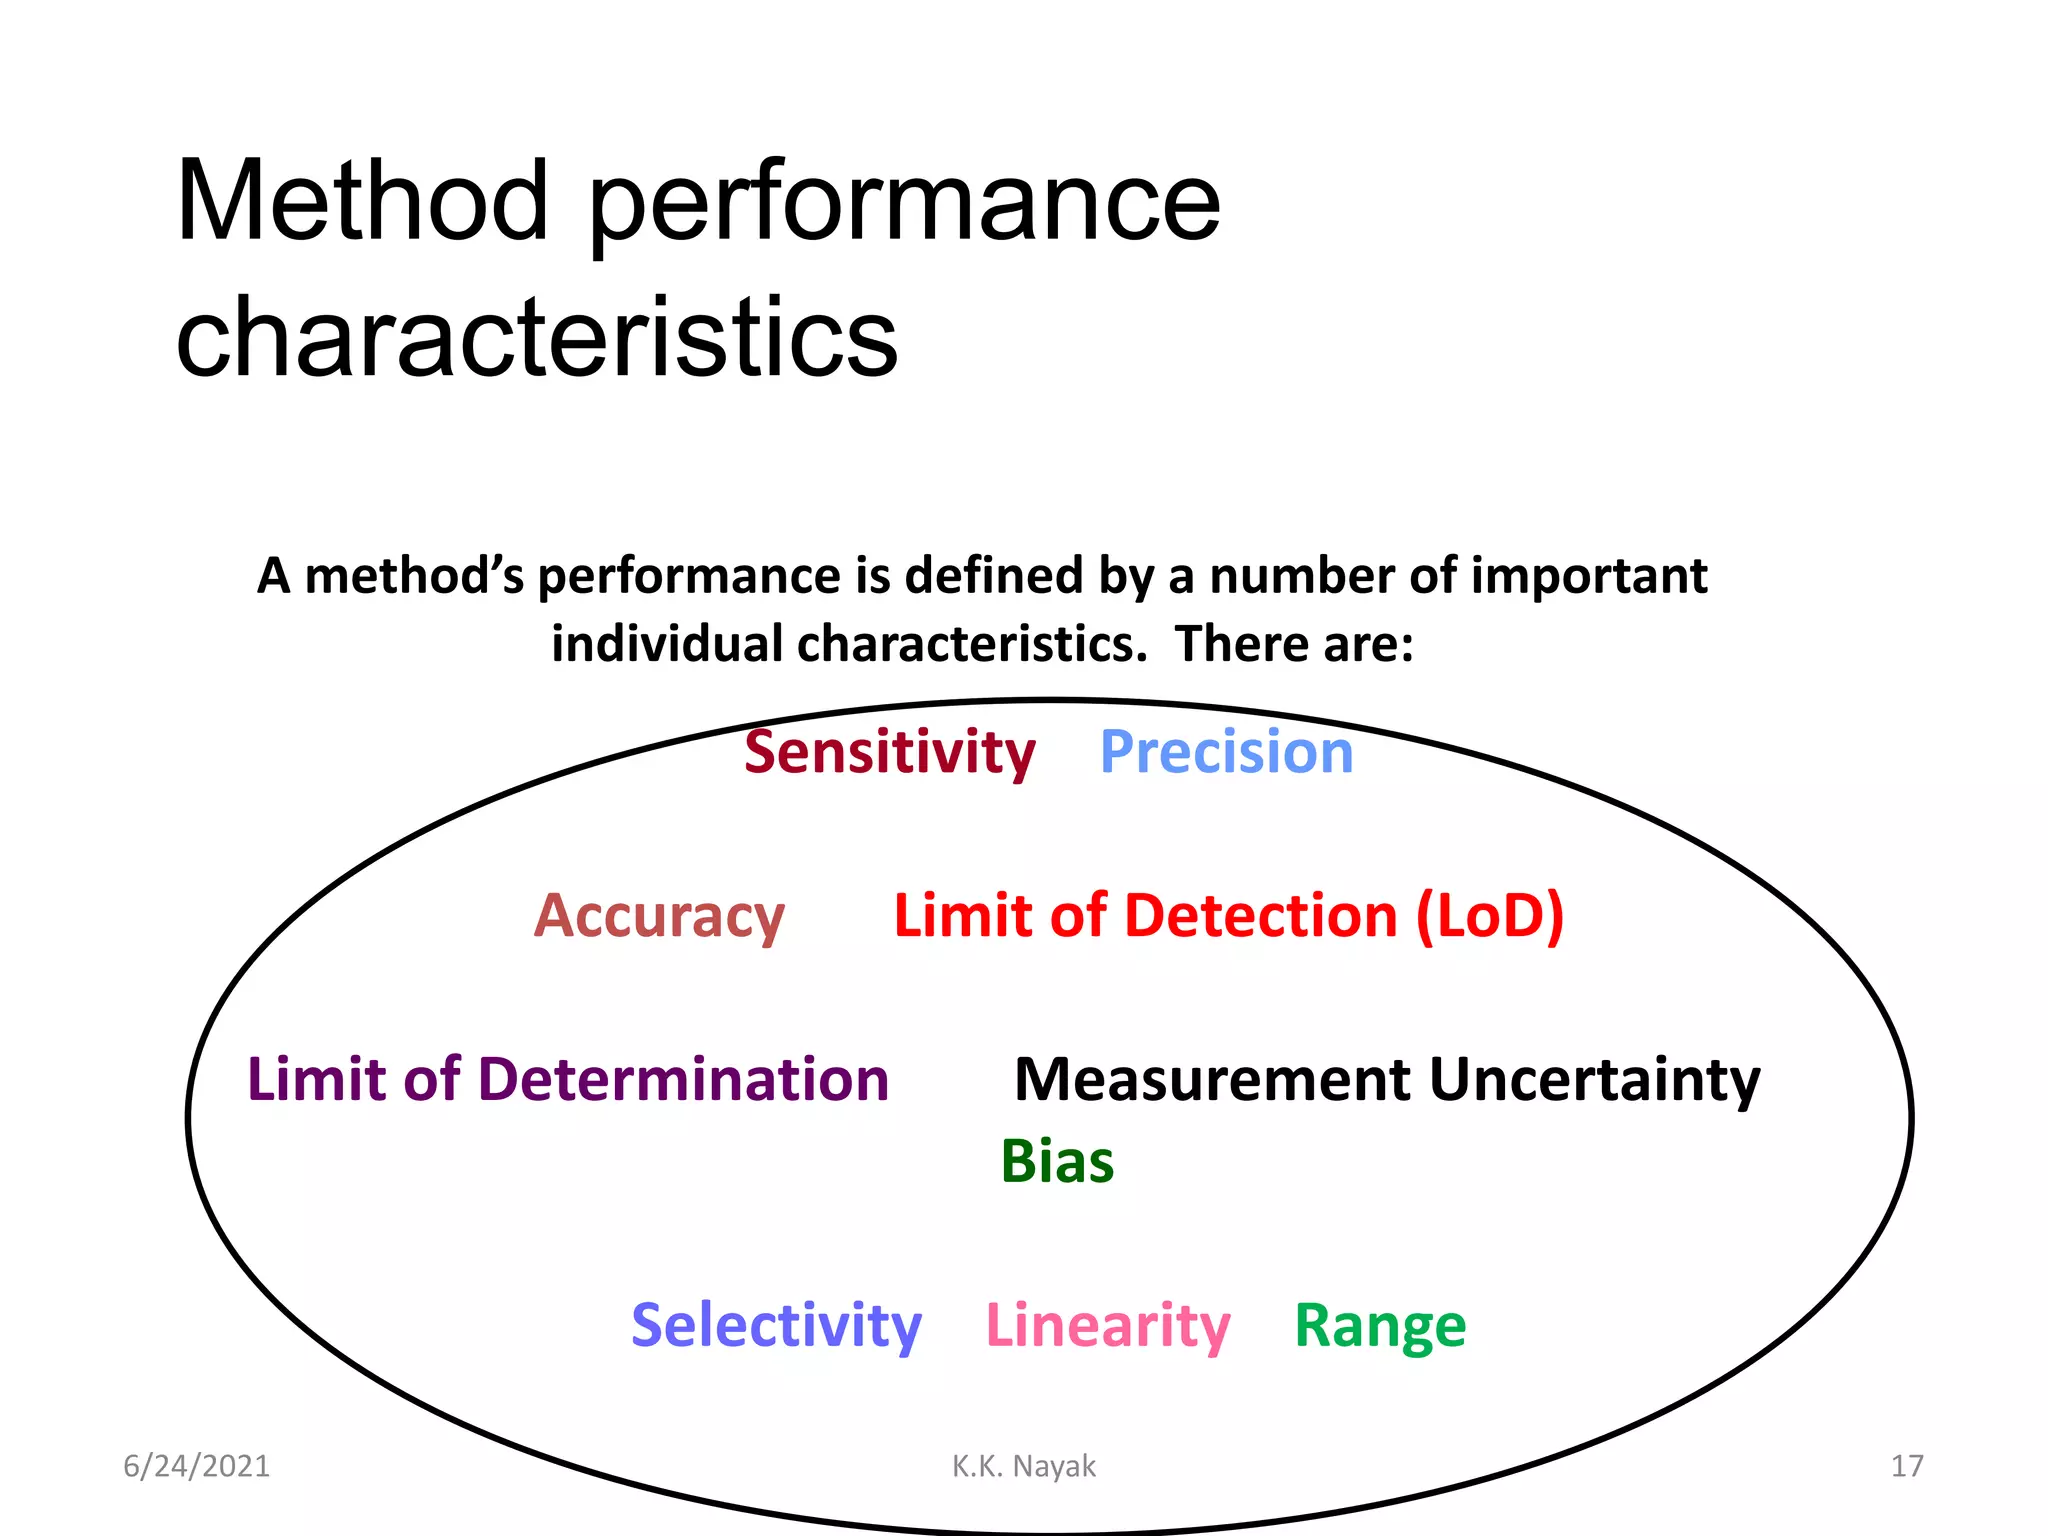
Amethod’s performance is defined by a number of important
individual characteristics. There are:
Sensitivity Precision
Accuracy Limit of Detection (LoD)
Limit of Determination Measurement Uncertainty
Bias
Selectivity Linearity Range
K.K. Nayak
17.
Accuracy and precision
6/24/2021K.K. Nayak 18
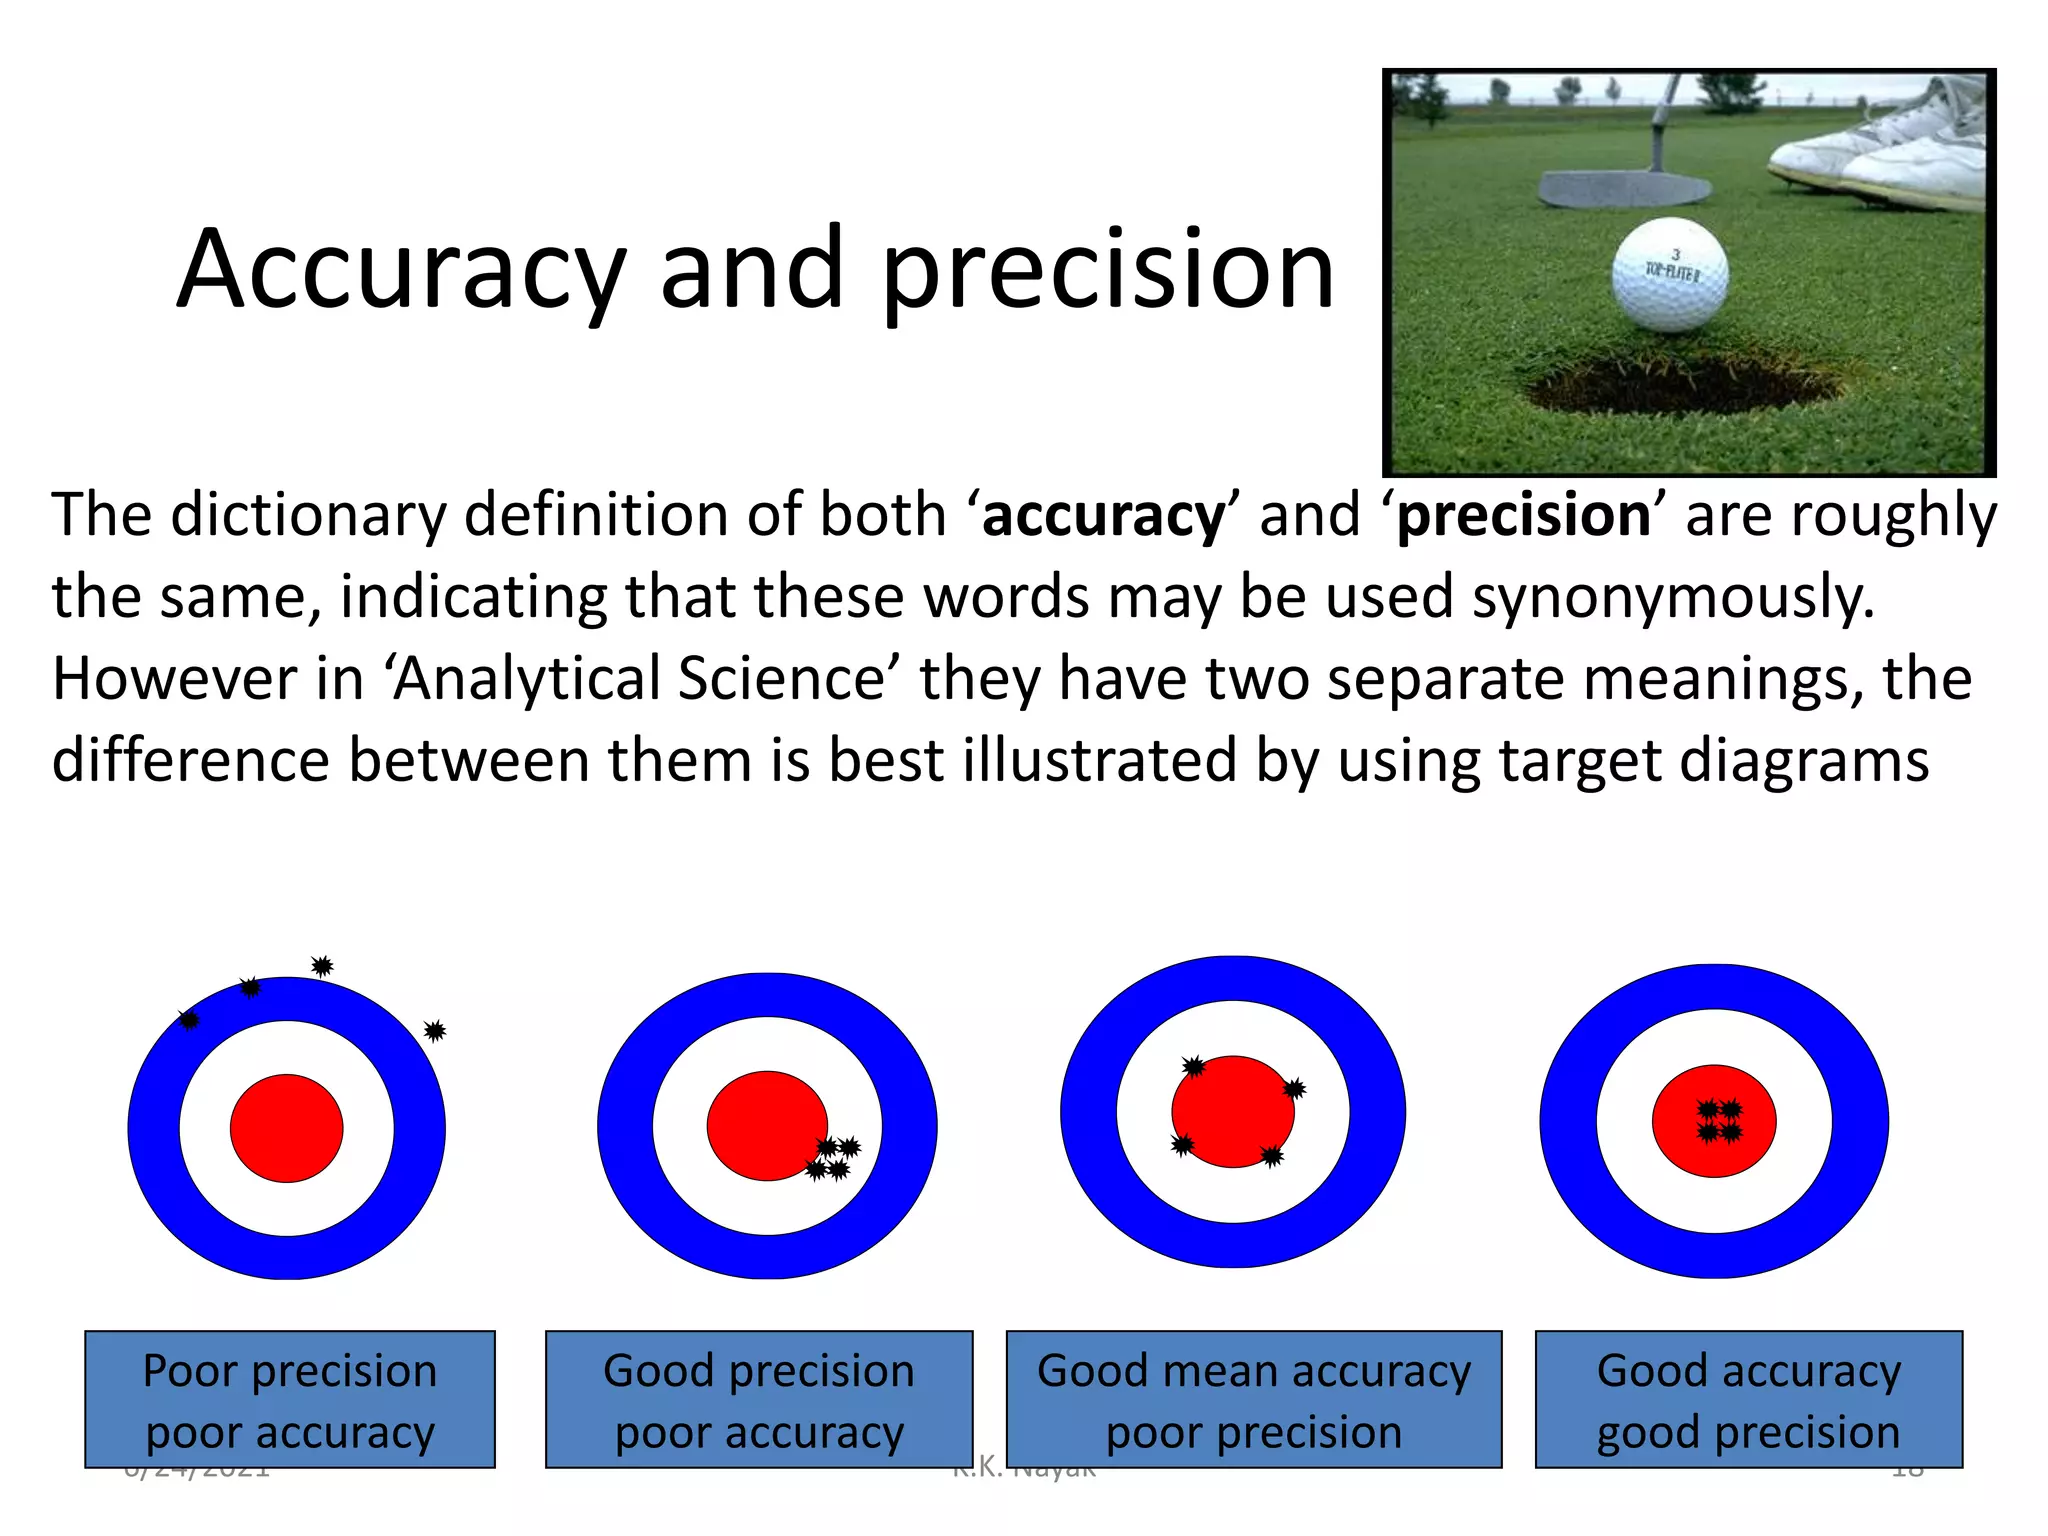
The dictionary definition of both ‘accuracy’ and ‘precision’ are roughly
the same, indicating that these words may be used synonymously.
However in ‘Analytical Science’ they have two separate meanings, the
difference between them is best illustrated by using target diagrams
Poor precision
poor accuracy
Good precision
poor accuracy
Good mean accuracy
poor precision
Good accuracy
good precision
18.
Accuracy and precision
(2)
6/24/2021K.K. Nayak 19
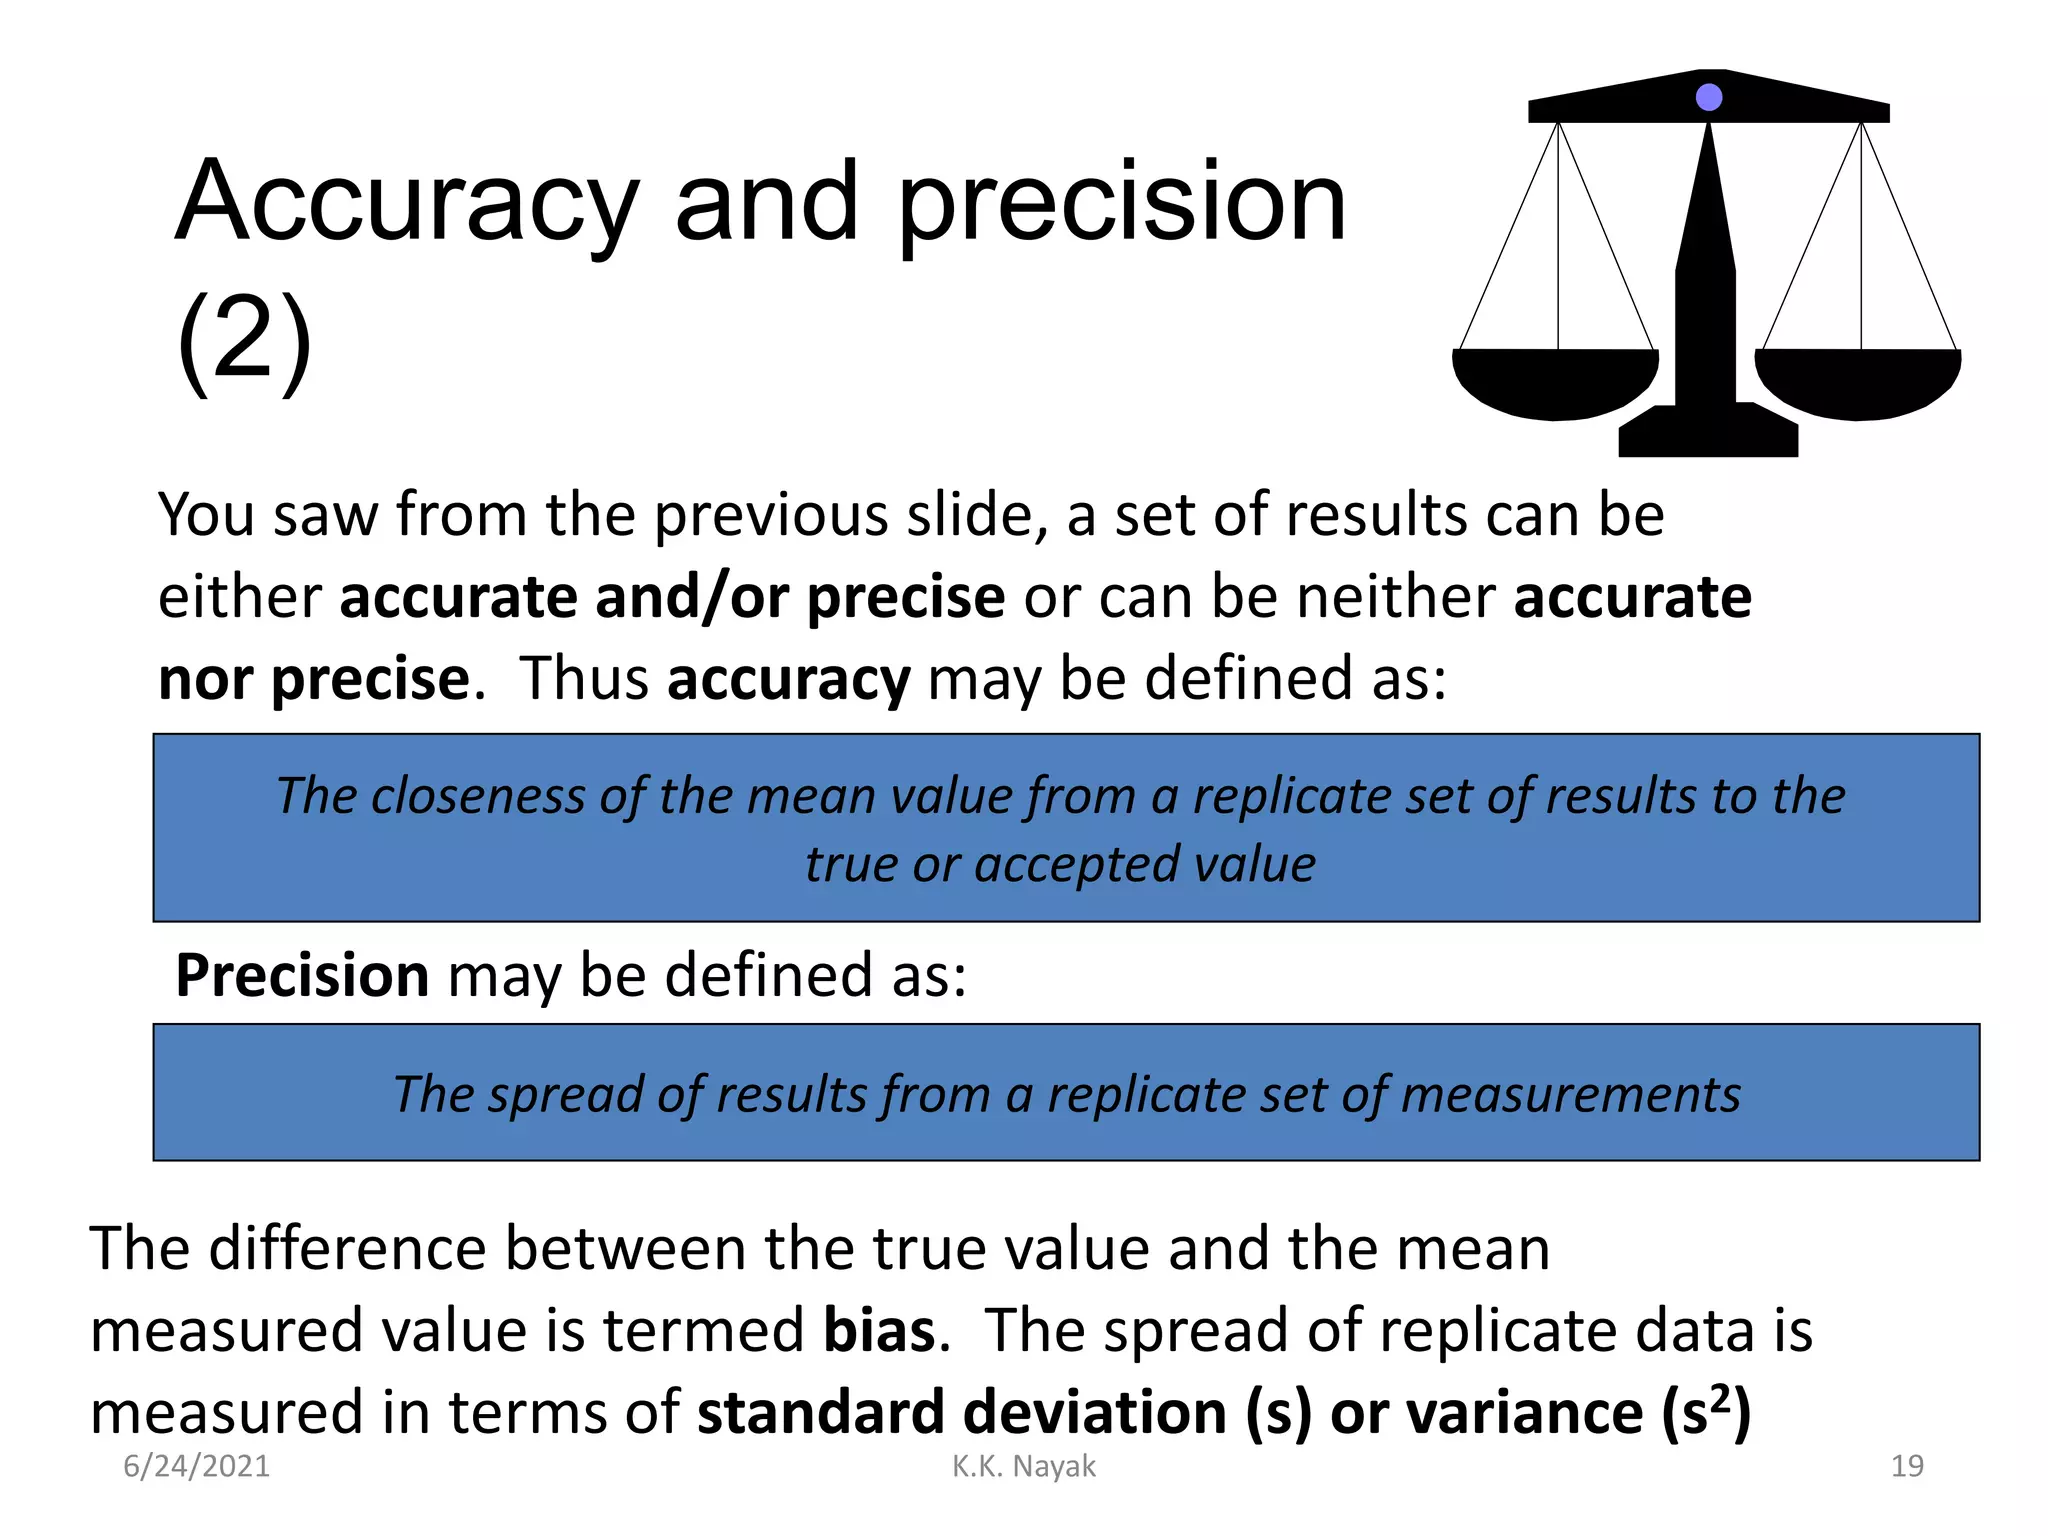
You saw from the previous slide, a set of results can be
either accurate and/or precise or can be neither accurate
nor precise. Thus accuracy may be defined as:
The closeness of the mean value from a replicate set of results to the
true or accepted value
Precision may be defined as:
The spread of results from a replicate set of measurements
The difference between the true value and the mean
measured value is termed bias. The spread of replicate data is
measured in terms of standard deviation (s) or variance (s2)
19.
Bias and variance
6/24/2021K.K. Nayak 20
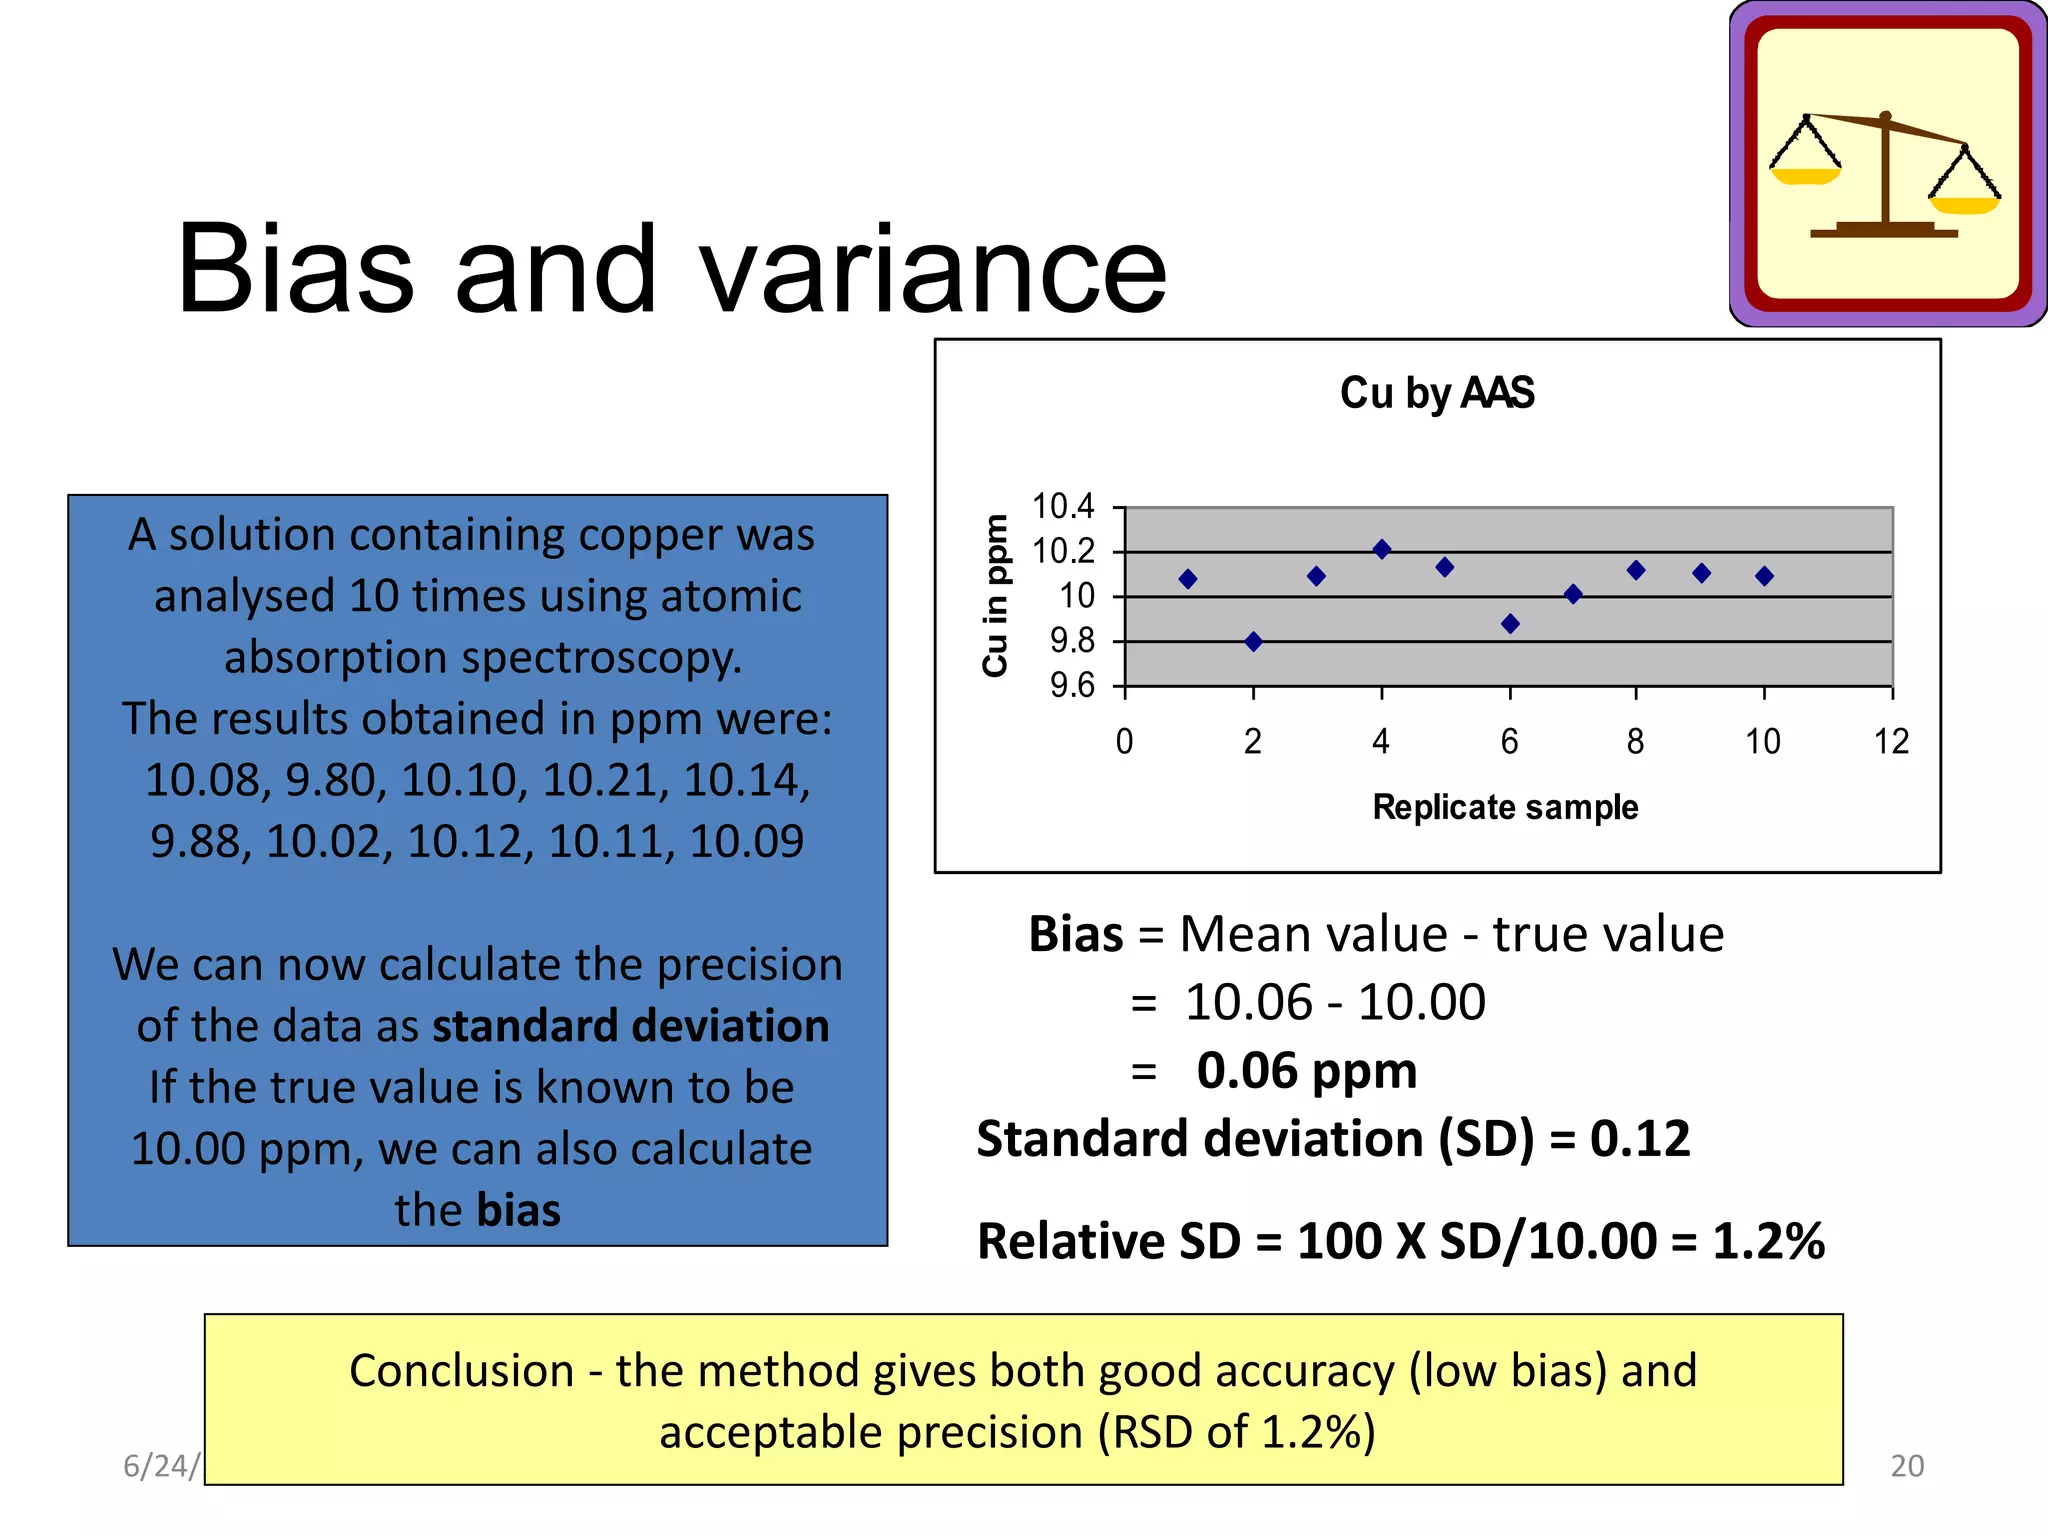
A solution containing copper was
analysed 10 times using atomic
absorption spectroscopy.
The results obtained in ppm were:
10.08, 9.80, 10.10, 10.21, 10.14,
9.88, 10.02, 10.12, 10.11, 10.09
We can now calculate the precision
of the data as standard deviation
If the true value is known to be
10.00 ppm, we can also calculate
the bias
Cu by AAS
9.6
9.8
10
10.2
10.4
0 2 4 6 8 10 12
Replicate sample
Cu
in
ppm
Bias = Mean value - true value
= 10.06 - 10.00
= 0.06 ppm
Standard deviation (SD) = 0.12
Conclusion - the method gives both good accuracy (low bias) and
acceptable precision (RSD of 1.2%)
Relative SD = 100 X SD/10.00 = 1.2%
20.
Sensitivity and
selectivity
6/24/2021 K.K.Nayak 21
Assessment of method sensitivity
0
200
400
600
800
1000
1200
0 10 20 30
Concentration
Signal
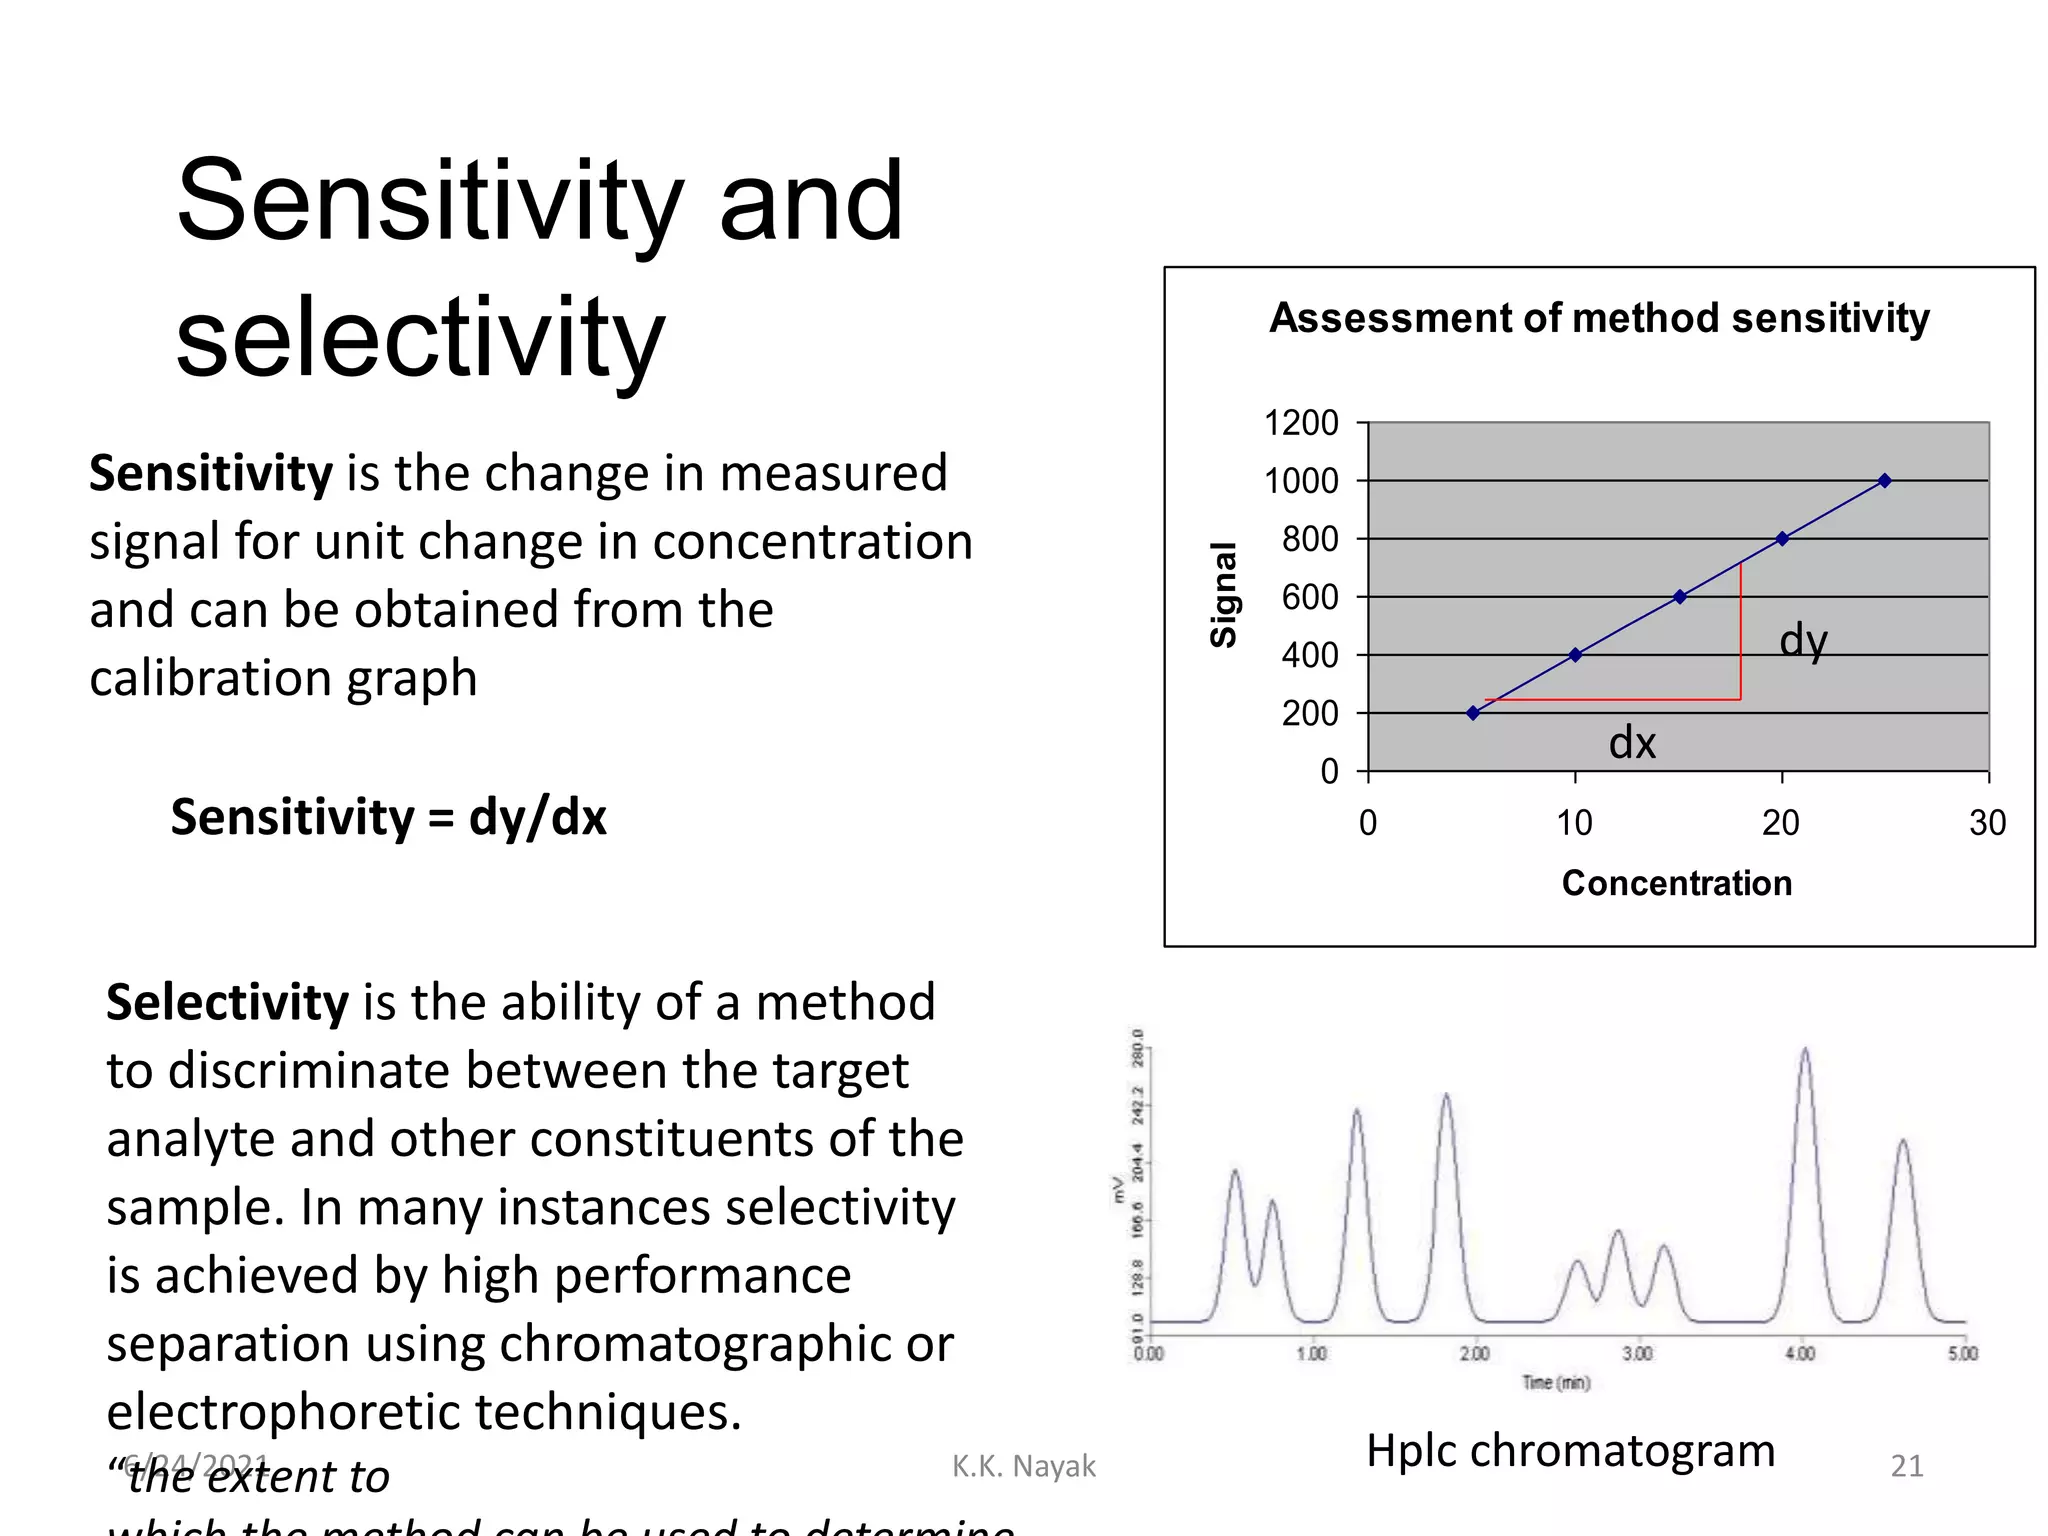
Sensitivity is the change in measured
signal for unit change in concentration
and can be obtained from the
calibration graph
Sensitivity = dy/dx
dy
dx
Selectivity is the ability of a method
to discriminate between the target
analyte and other constituents of the
sample. In many instances selectivity
is achieved by high performance
separation using chromatographic or
electrophoretic techniques.
“the extent to
Hplc chromatogram
21.
Limits of detection(LoD) and determination
6/24/2021 K.K. Nayak 22
These values refer to the statistical
limits below which results of detection
or accurate quantitative measurements
(determination) should not be reported.
The levels of both are dependent upon
the variability of the signal when a blank
containing none of the analyte is being
measured. The signal generated under
these conditions is mostly signal noise
and is assumed to exhibit a normal
distribution pattern. Both the blank
signal and the standard deviation of
the blank signal need to be measured.
From this data we can calculate both
limits.
Example: In an analysis of trace
Cd by plasma emission
spectrometry the following data
were obtained:
• mean blank (Bl) signal 4
• SD of blank signal 12
• 500 ppb Cd 2000
LoD = Bl signal + 3(SD of Bl)
= 4 + 3(12)
= 40
This equates to: [40/2000] X 500 ppb
= 10 ppb Cd
The limit of determination uses a
similar formula, replacing the
3 SD’s by 10. This gives the limit of
determination as 31 ppb Cd
22.
Method validation -
detection& quantitation limits
6/24/2021 K.K. Nayak 23
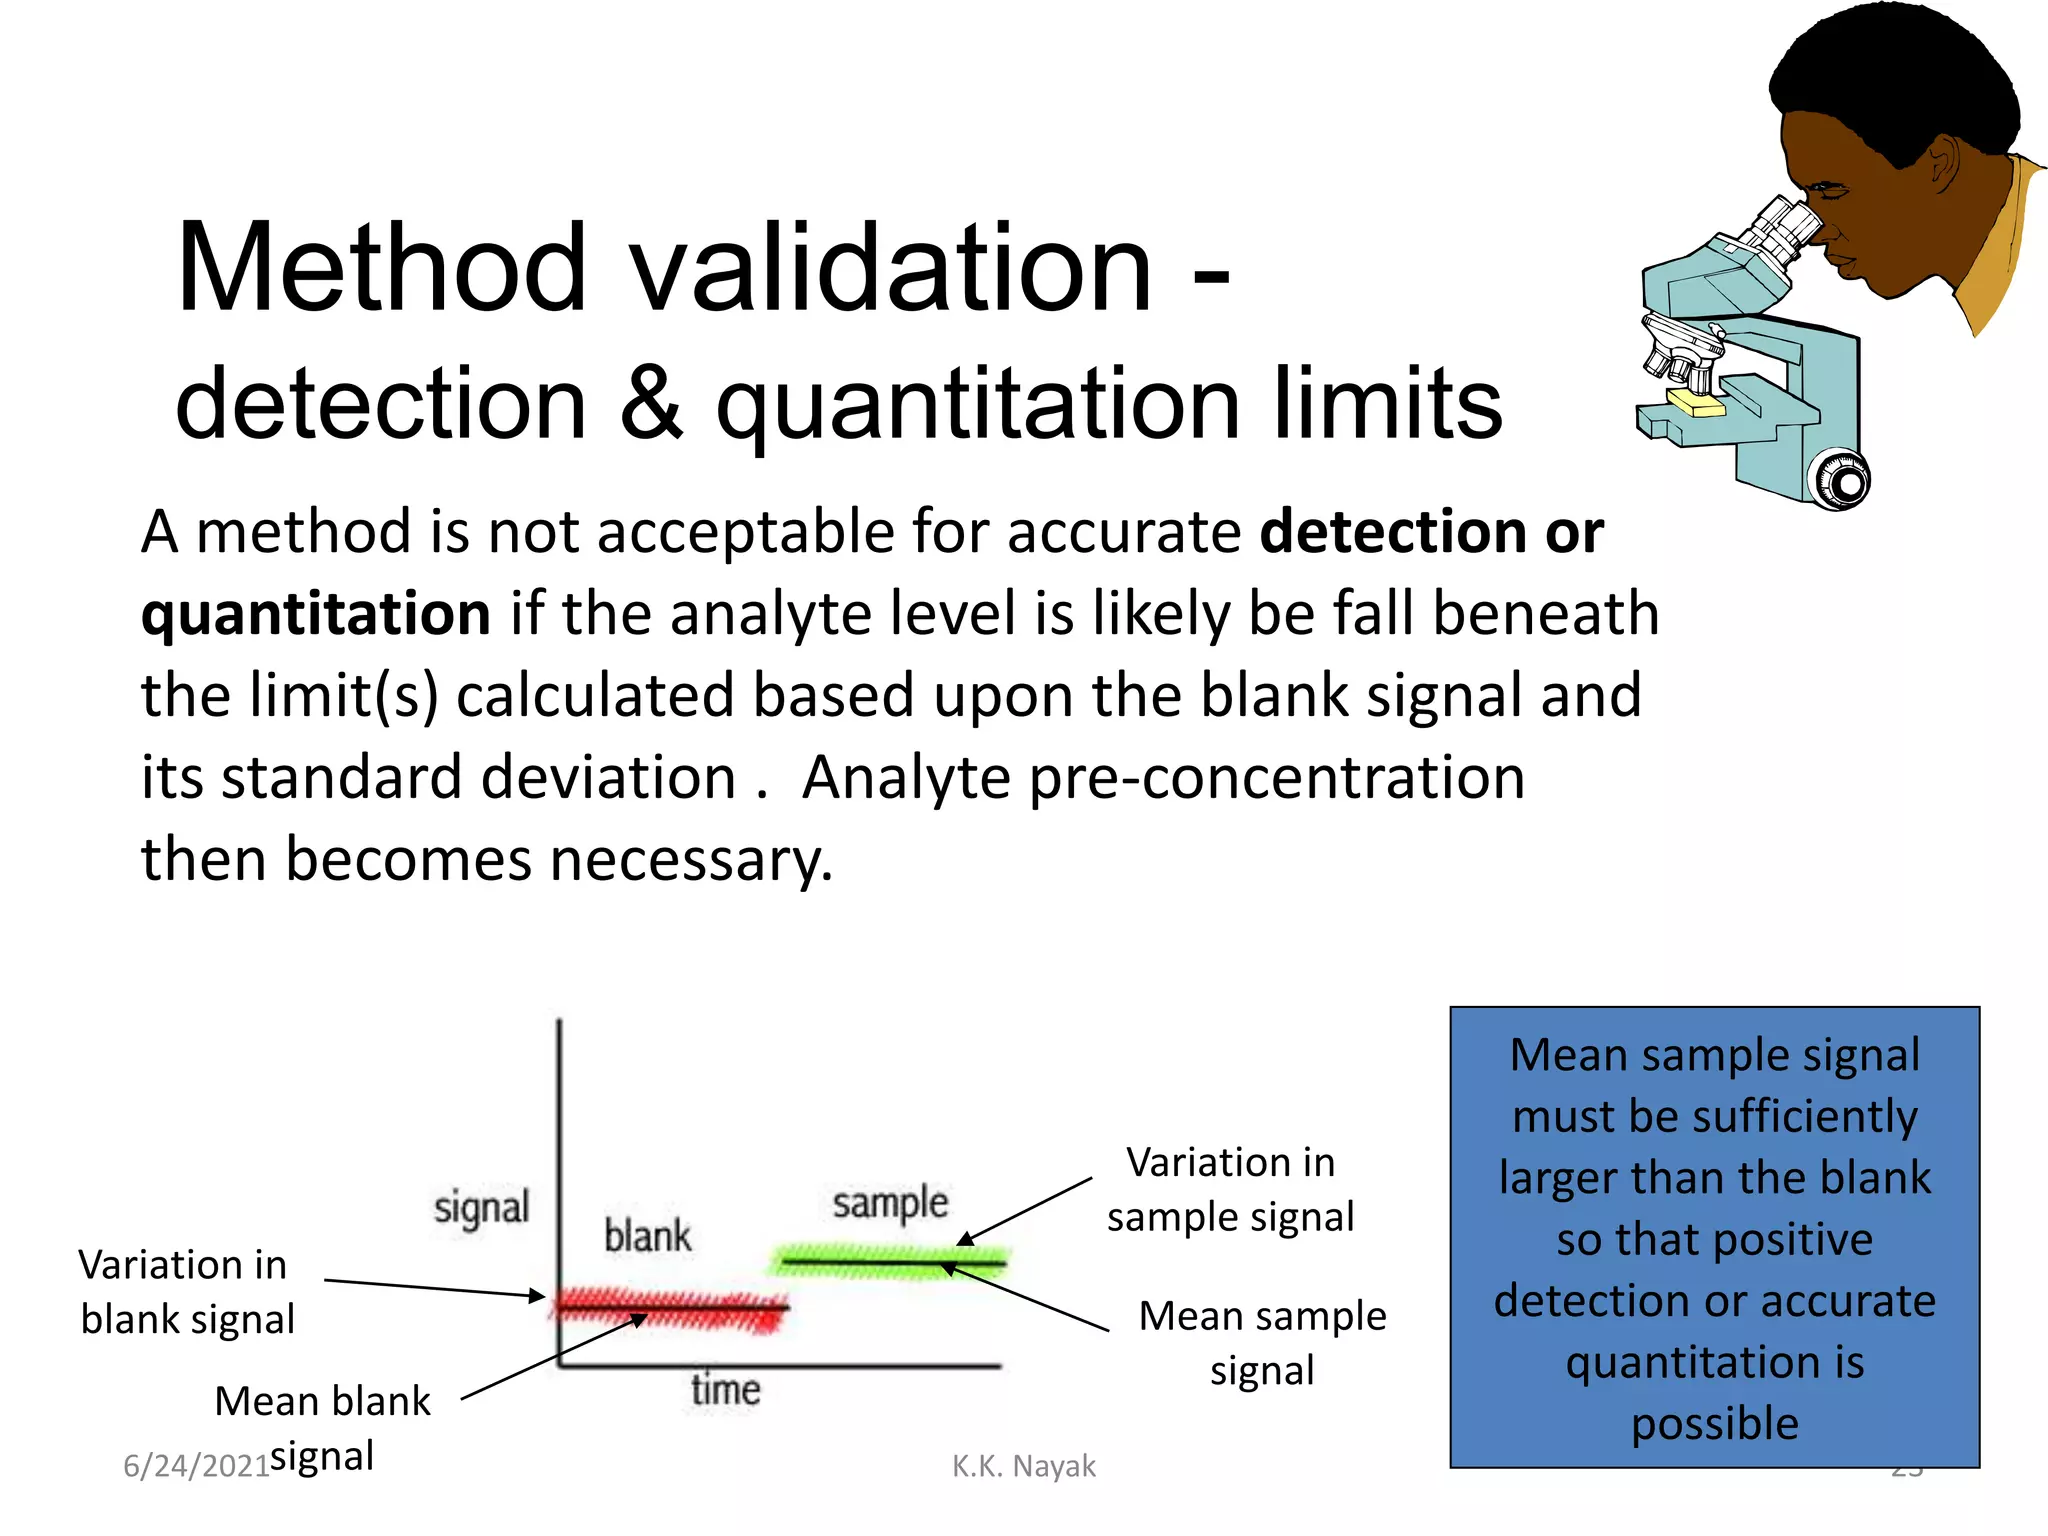
A method is not acceptable for accurate detection or
quantitation if the analyte level is likely be fall beneath
the limit(s) calculated based upon the blank signal and
its standard deviation . Analyte pre-concentration
then becomes necessary.
Variation in
blank signal
Mean blank
signal
Variation in
sample signal
Mean sample
signal
Mean sample signal
must be sufficiently
larger than the blank
so that positive
detection or accurate
quantitation is
possible
23.
Method validation -
linearity
6/24/2021K.K. Nayak 24
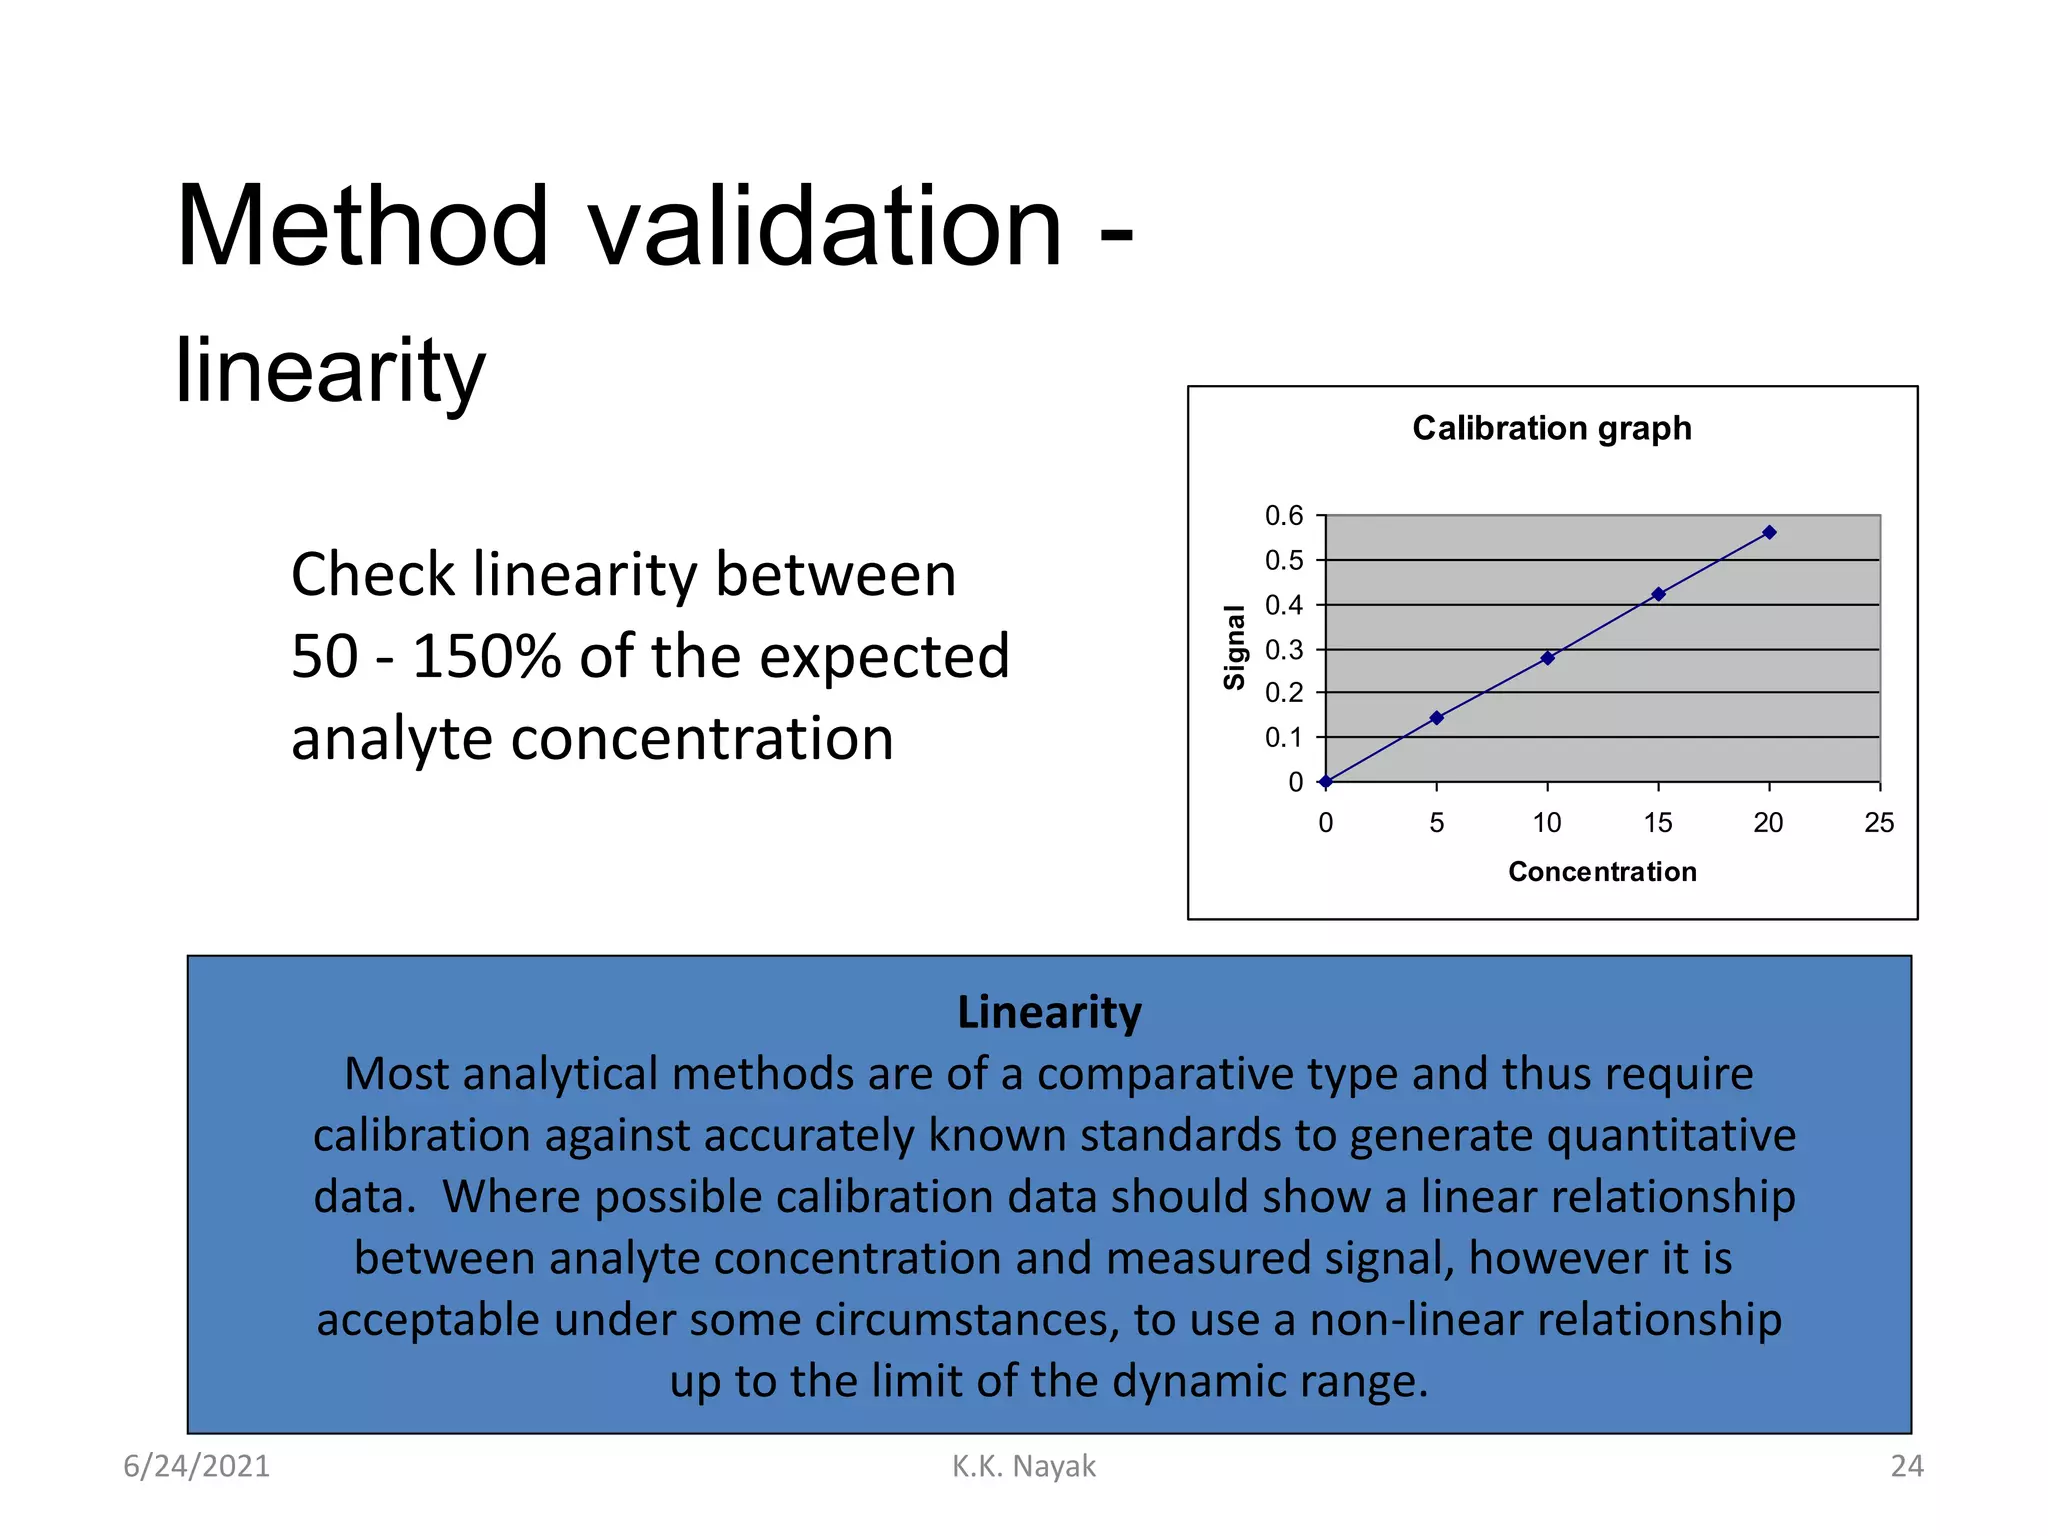
Linearity
Most analytical methods are of a comparative type and thus require
calibration against accurately known standards to generate quantitative
data. Where possible calibration data should show a linear relationship
between analyte concentration and measured signal, however it is
acceptable under some circumstances, to use a non-linear relationship
up to the limit of the dynamic range.
Calibration graph
0
0.1
0.2
0.3
0.4
0.5
0.6
0 5 10 15 20 25
Concentration
Signal
Check linearity between
50 - 150% of the expected
analyte concentration
24.
Method validation -
specificity
6/24/2021K.K. Nayak 25
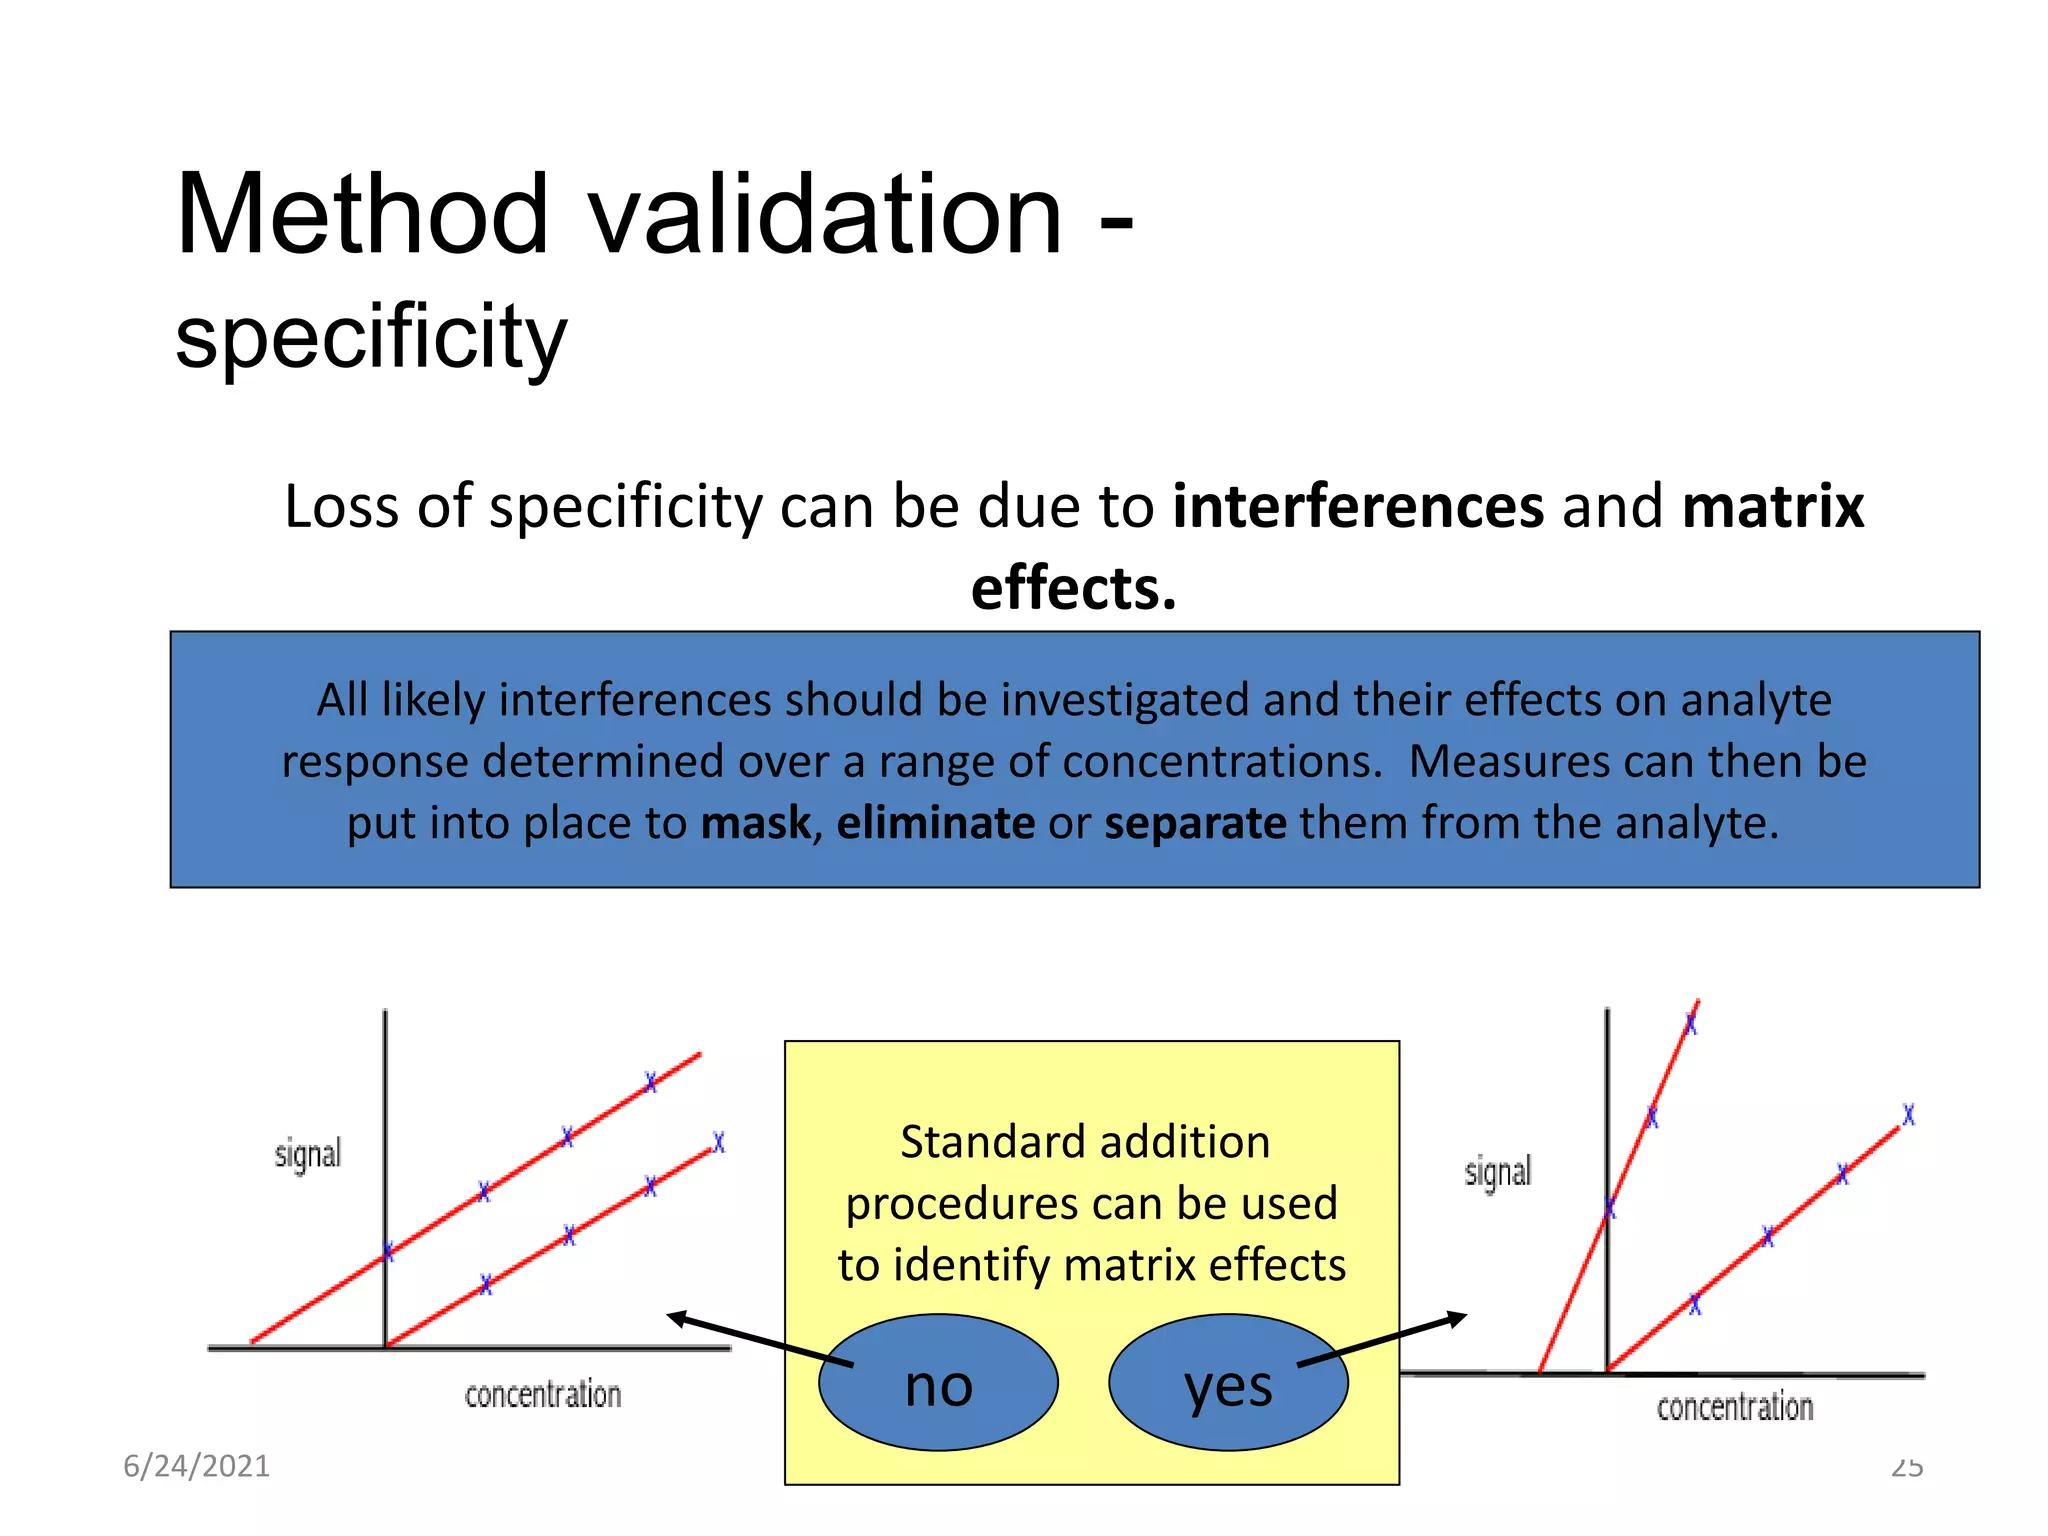
Loss of specificity can be due to interferences and matrix
effects.
All likely interferences should be investigated and their effects on analyte
response determined over a range of concentrations. Measures can then be
put into place to mask, eliminate or separate them from the analyte.
Standard addition
procedures can be used
to identify matrix effects
no yes
25.
Method validation -
precision
6/24/2021K.K. Nayak 26
You have seen already that,
precision is measured in
terms of standard deviation (SD).
Assuming that the variability of
the measurements is totally
random (obeys a normal
distribution curve) then
a formula derived from this
distribution may be used
to calculate standard deviation.
SD = [ Σ(xi - x)2/(n - 1)]1/2
where:
xi = individual data point
x = mean value of the data
n = the total number of data points
Σ = the sum of
Normal distribution curve
0
20
40
60
80
100
0 50 100 150
Data points
Frequency
of
occurrence
Estimation of true mean
In practice around 8 - 10 data points are used normally to calculate the
SD, although statisticians would recommend 50
26.
Method Validation -
repeatability& reproducibility
6/24/2021 K.K. Nayak 27
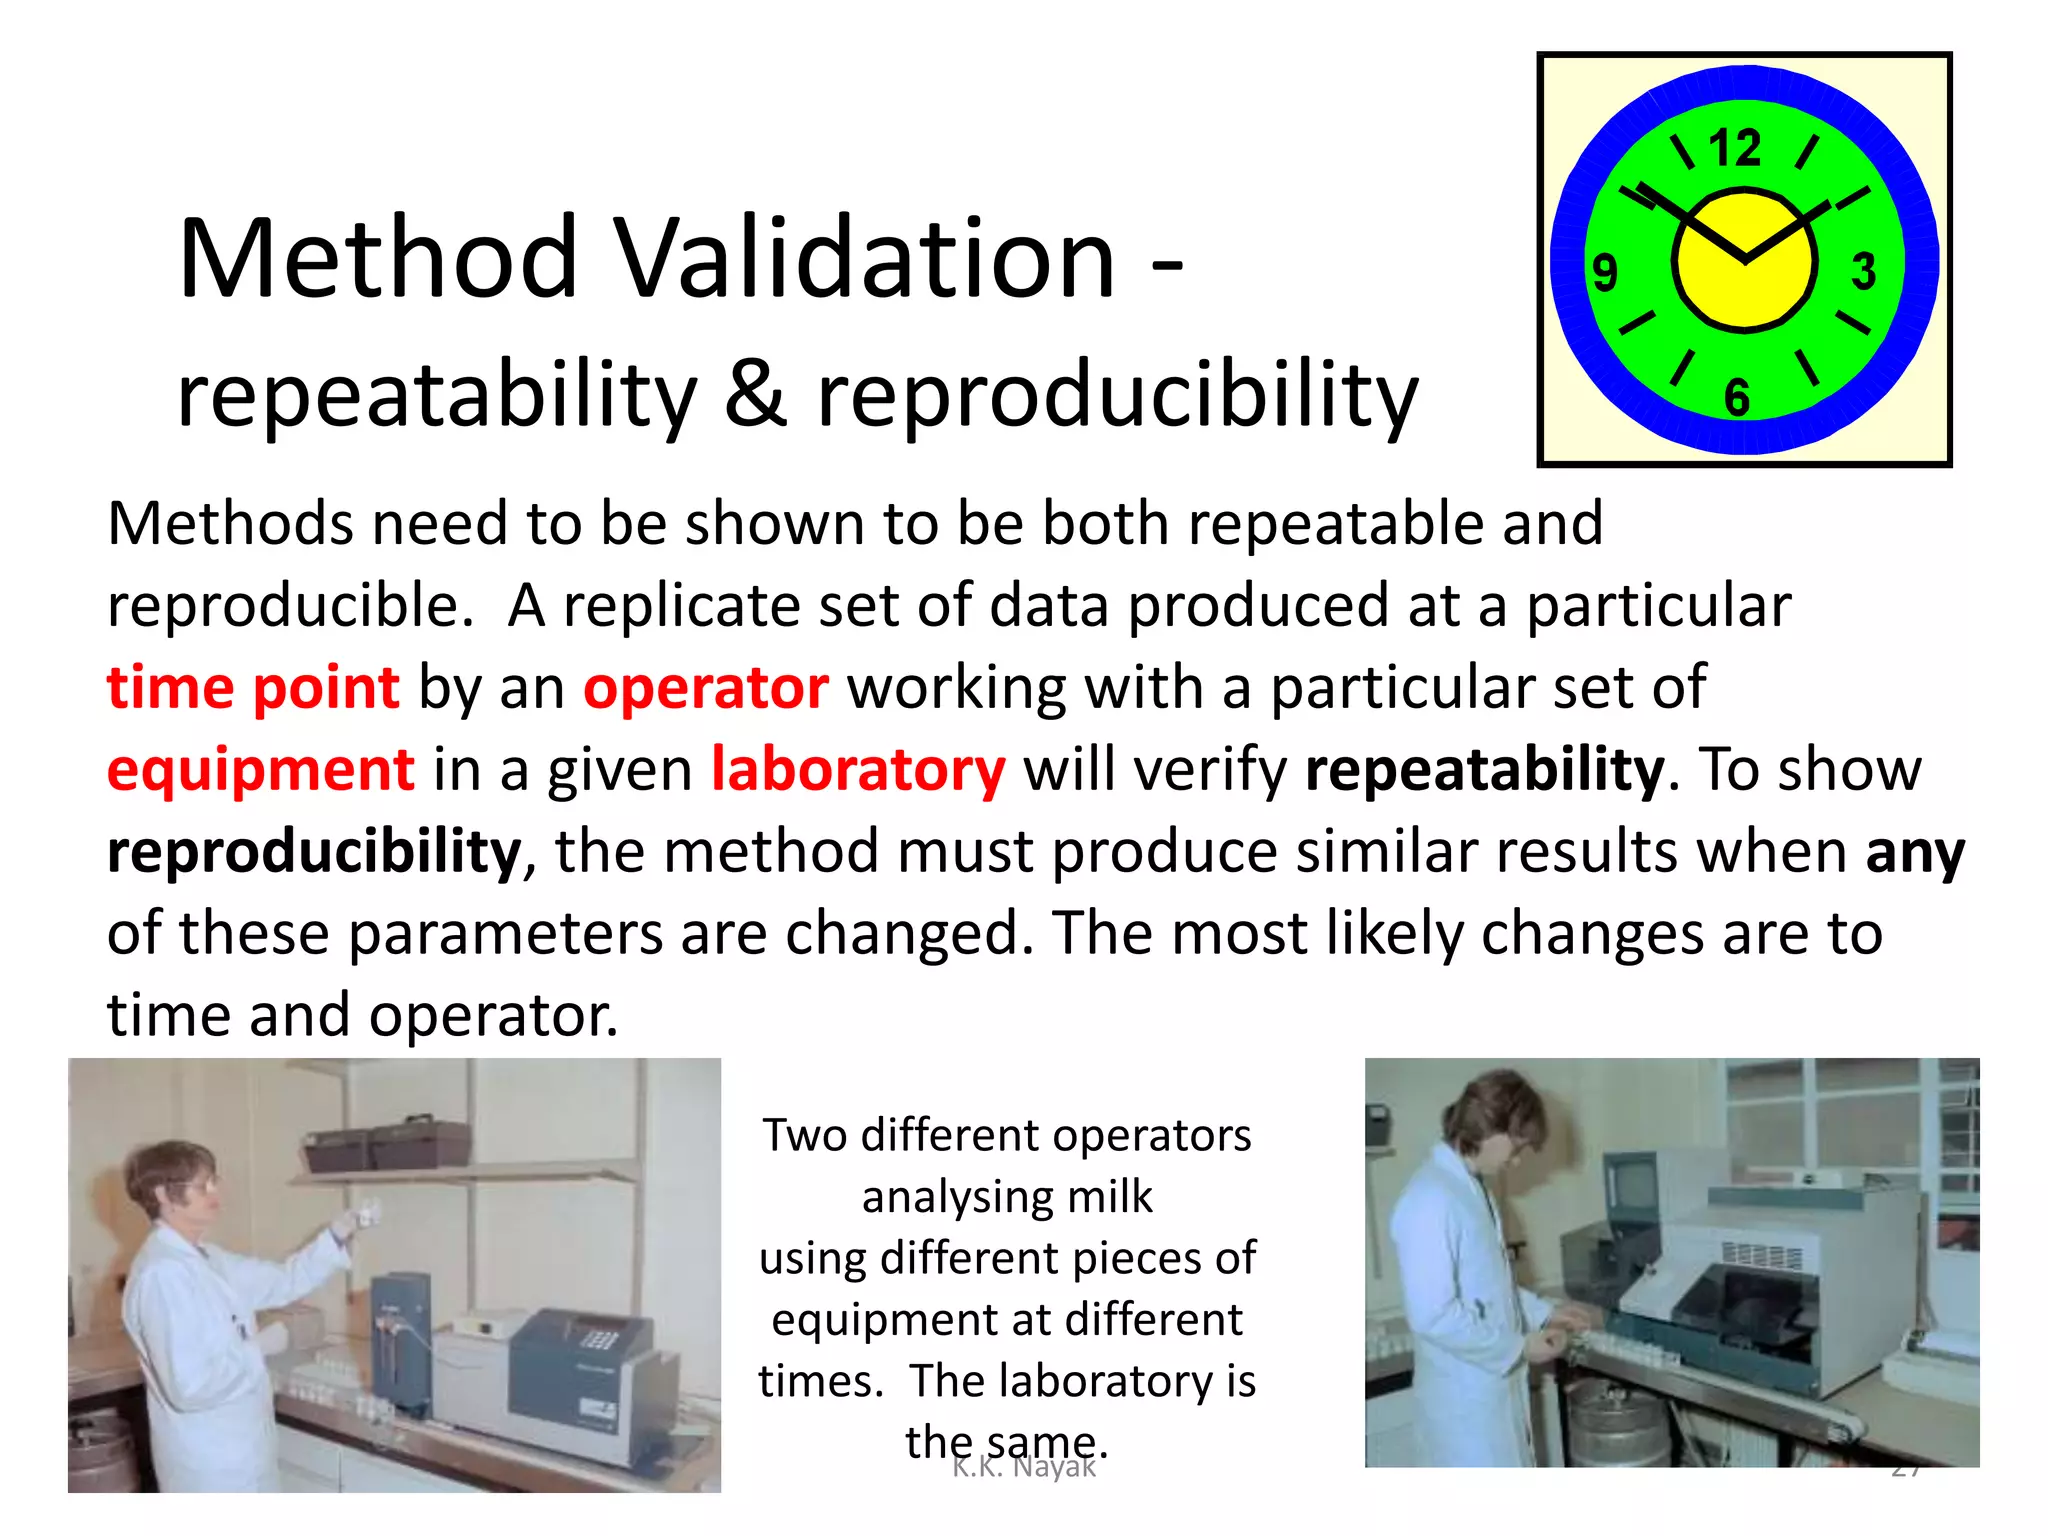
Methods need to be shown to be both repeatable and
reproducible. A replicate set of data produced at a particular
time point by an operator working with a particular set of
equipment in a given laboratory will verify repeatability. To show
reproducibility, the method must produce similar results when any
of these parameters are changed. The most likely changes are to
time and operator.
Two different operators
analysing milk
using different pieces of
equipment at different
times. The laboratory is
the same.
27.
Method validation -
reliability
6/24/2021K.K. Nayak 28
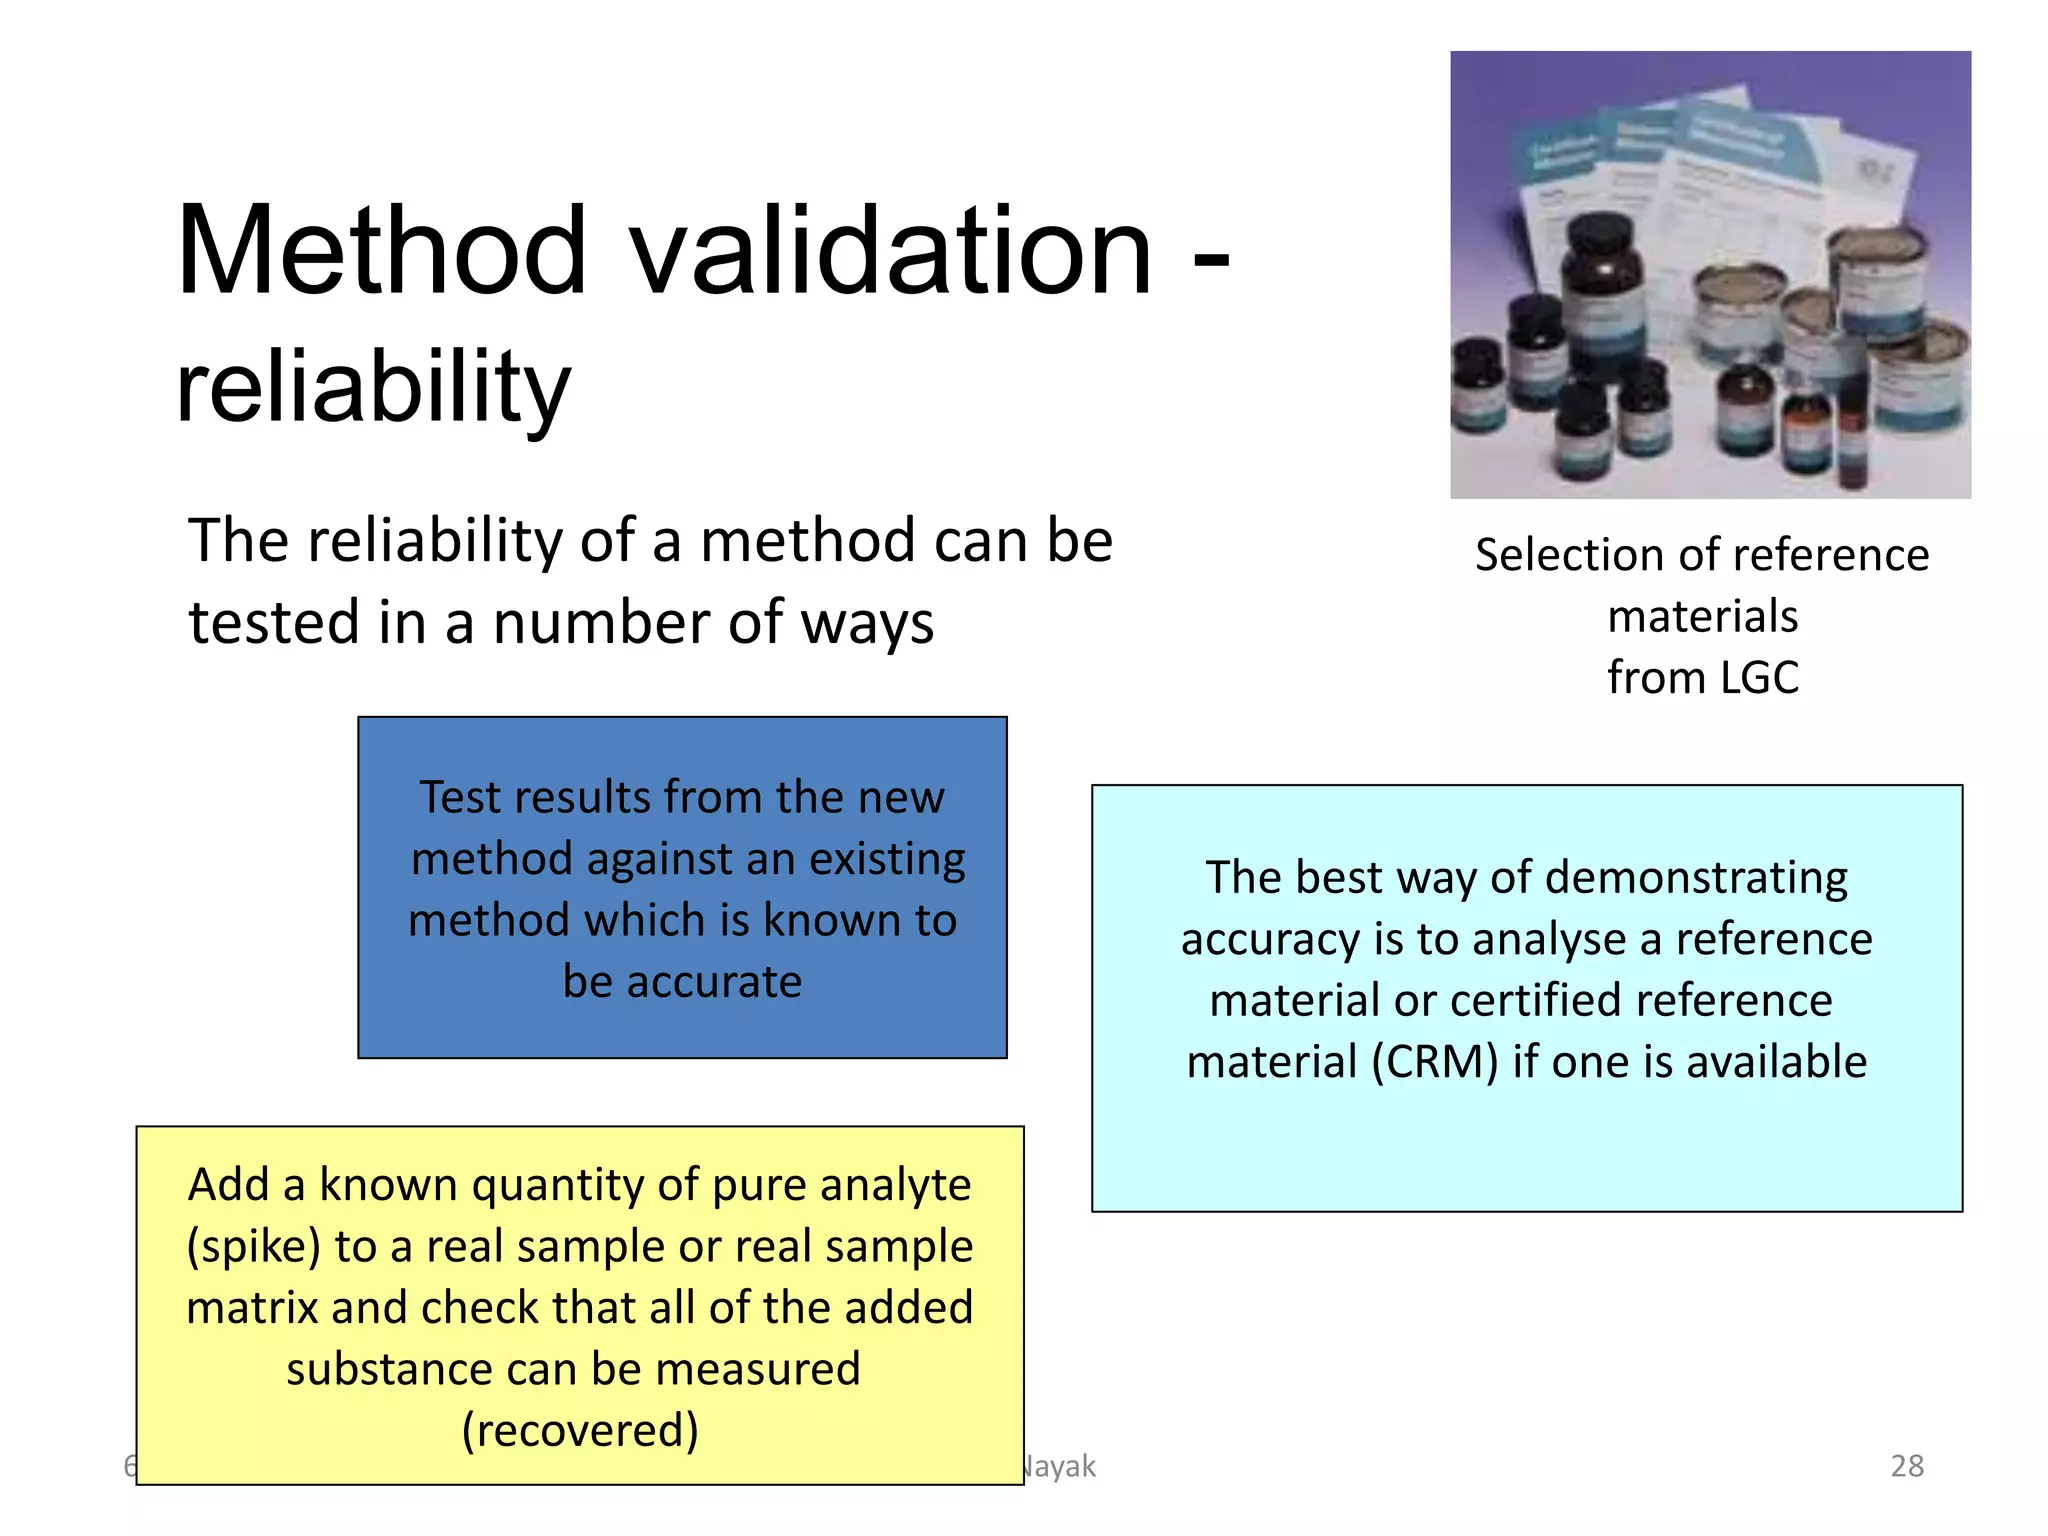
The reliability of a method can be
tested in a number of ways
Test results from the new
method against an existing
method which is known to
be accurate
Add a known quantity of pure analyte
(spike) to a real sample or real sample
matrix and check that all of the added
substance can be measured
(recovered)
The best way of demonstrating
accuracy is to analyse a reference
material or certified reference
material (CRM) if one is available
Selection of reference
materials
from LGC
28.
Method validation -
robustness
6/24/2021K.K. Nayak 29
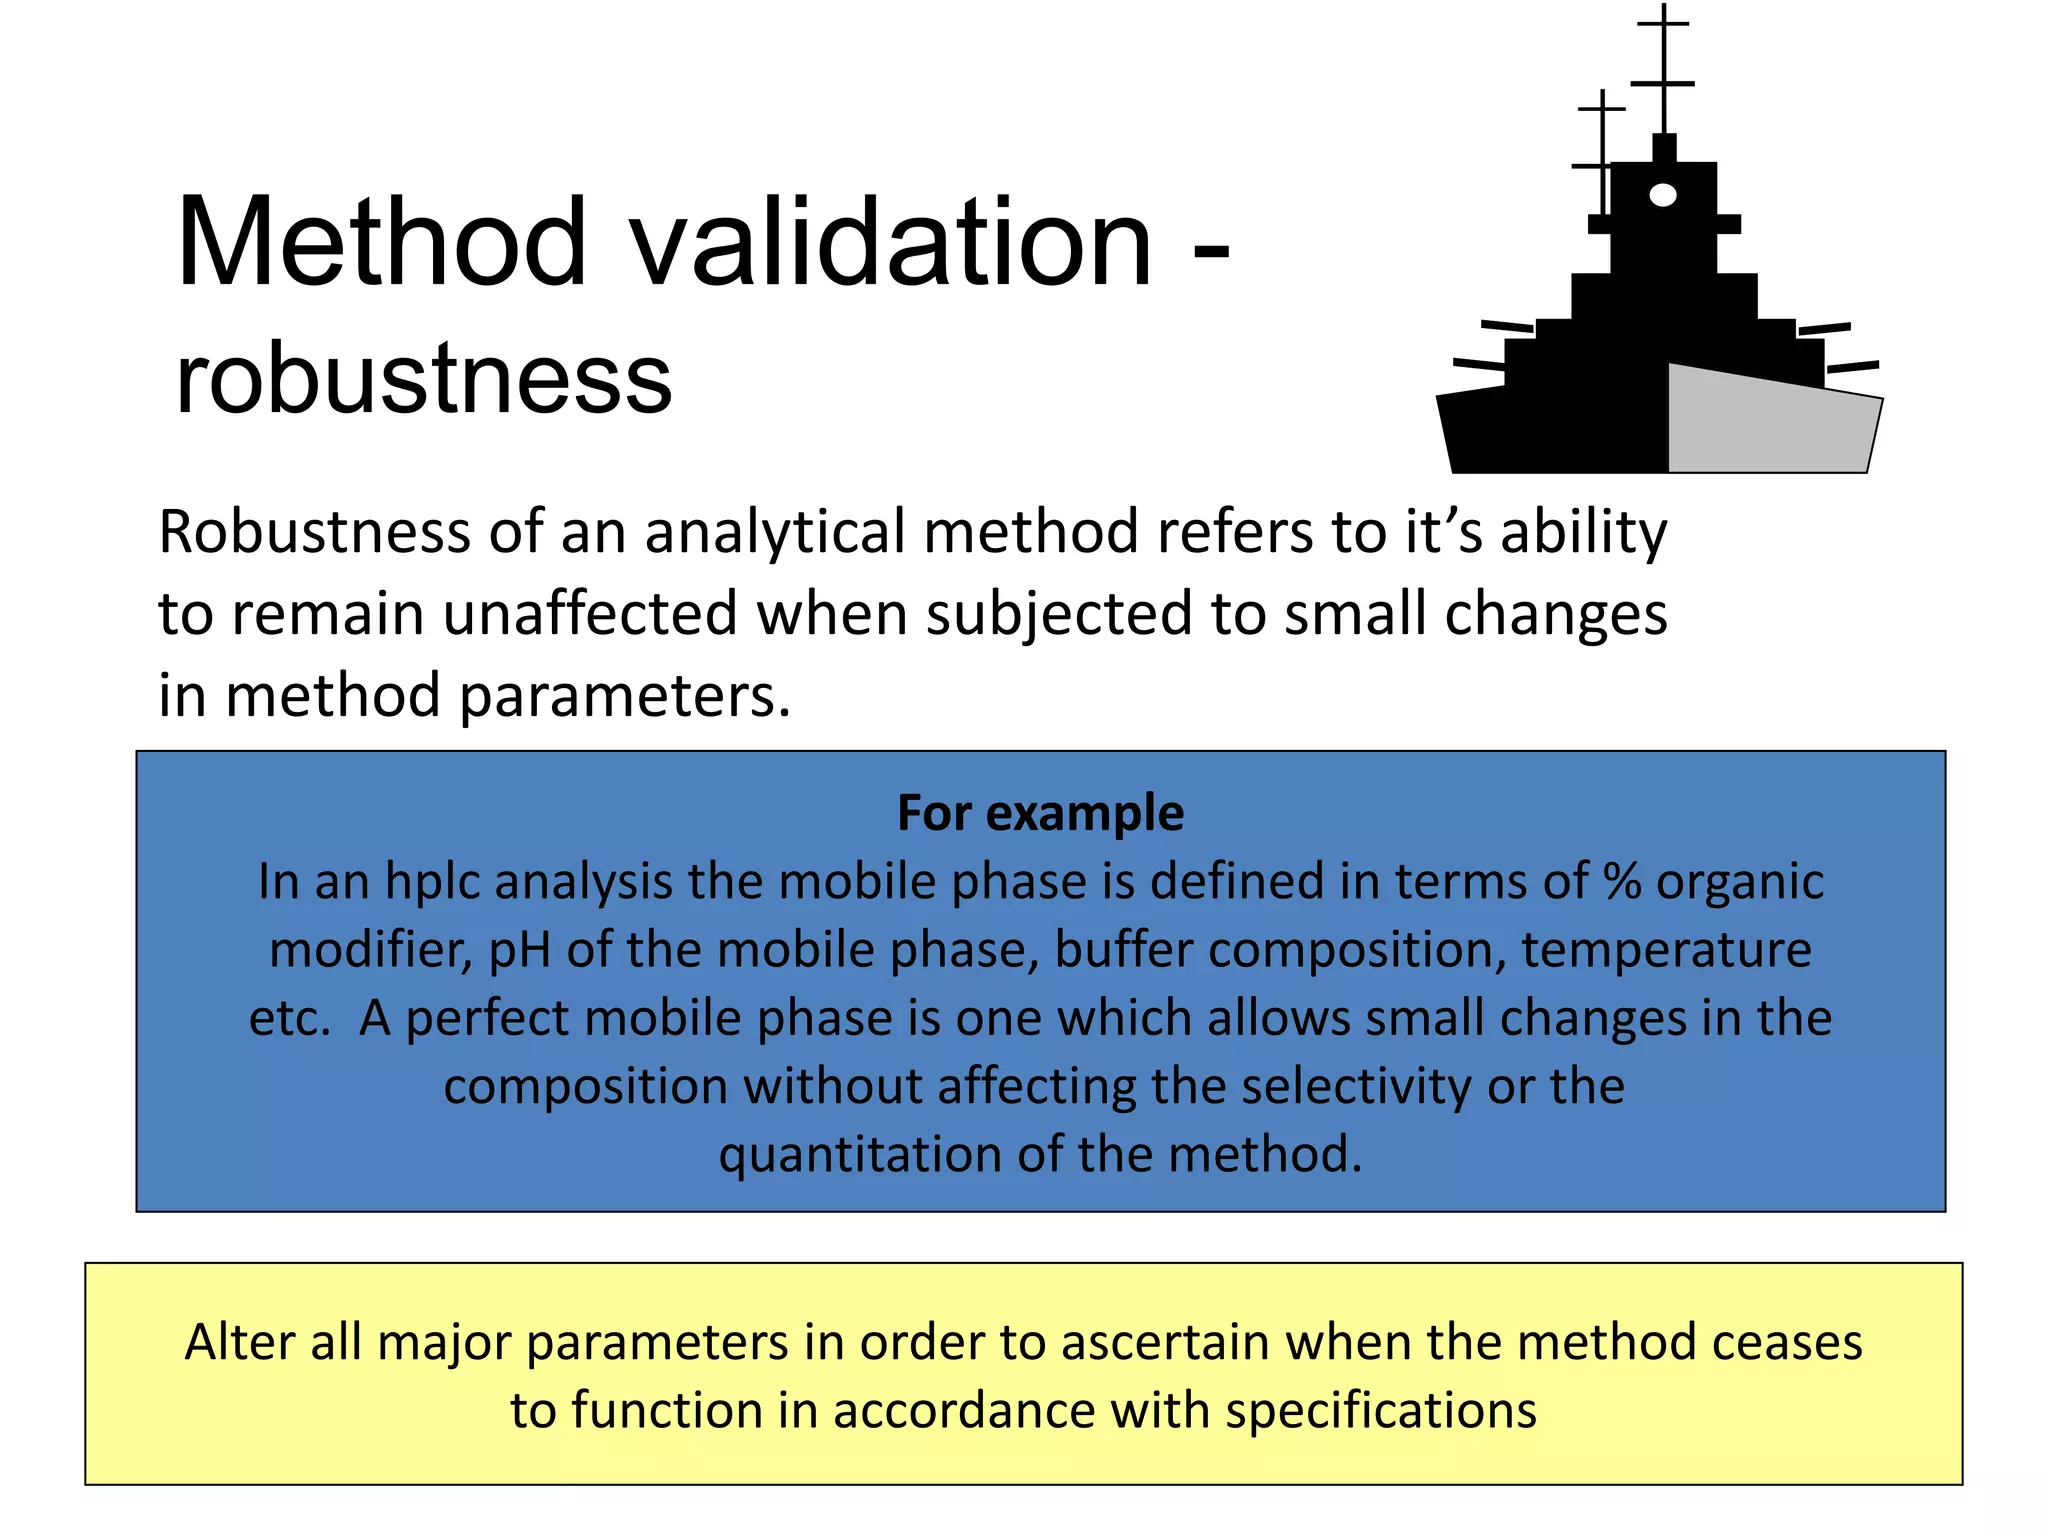
Robustness of an analytical method refers to it’s ability
to remain unaffected when subjected to small changes
in method parameters.
For example
In an hplc analysis the mobile phase is defined in terms of % organic
modifier, pH of the mobile phase, buffer composition, temperature
etc. A perfect mobile phase is one which allows small changes in the
composition without affecting the selectivity or the
quantitation of the method.
Alter all major parameters in order to ascertain when the method ceases
to function in accordance with specifications
29.
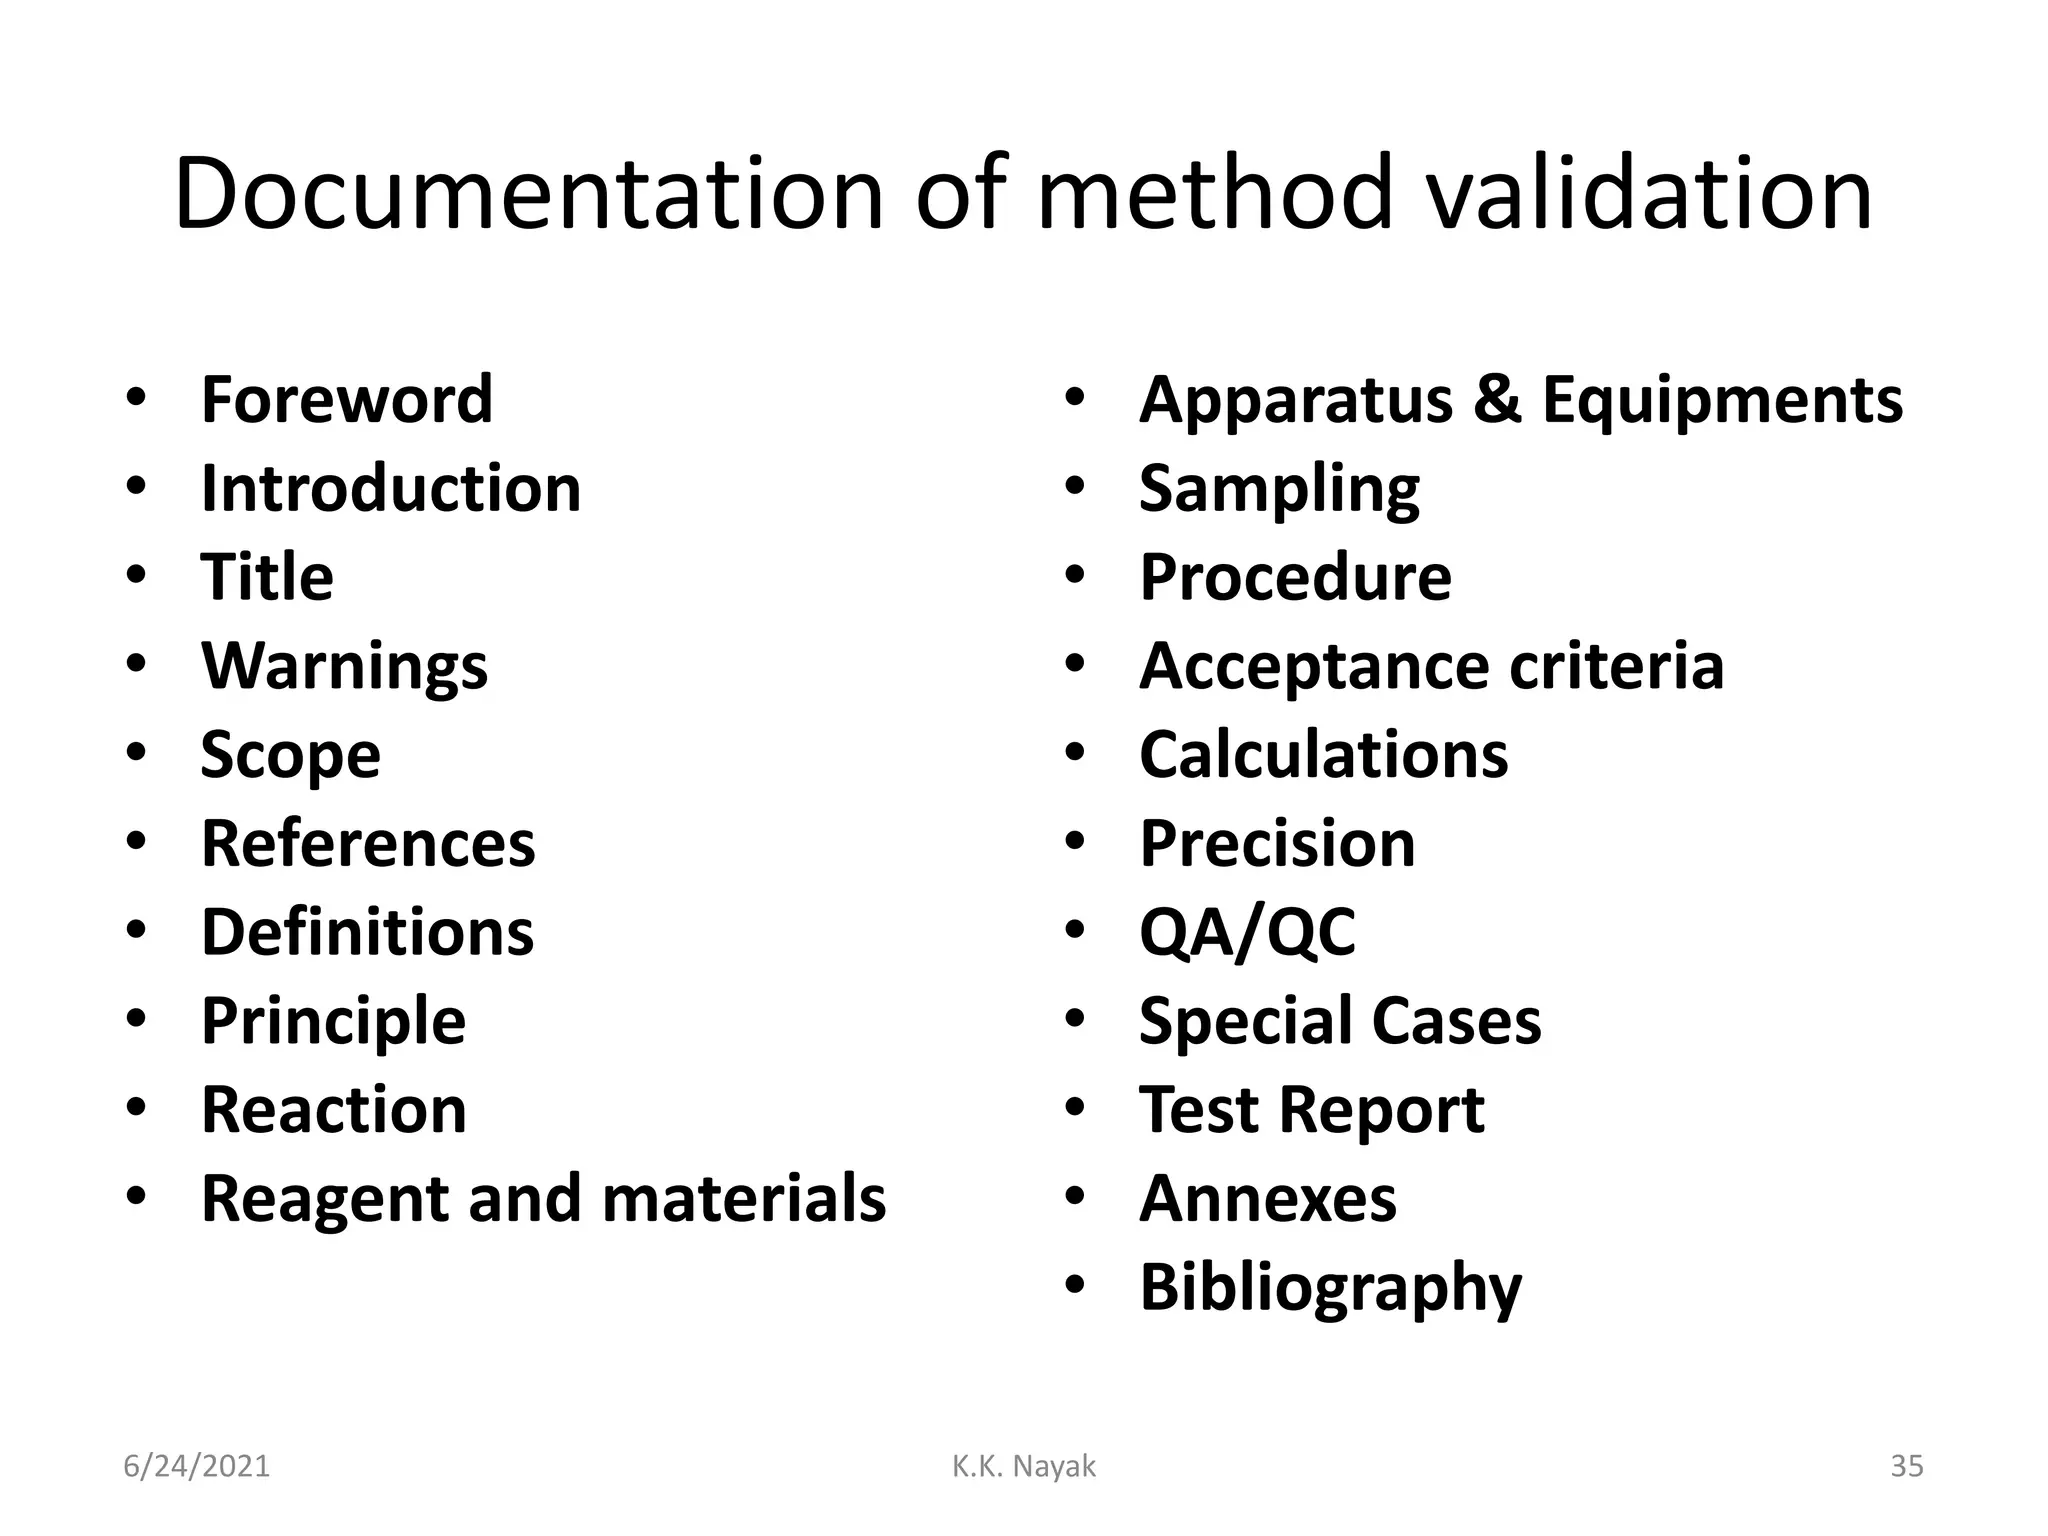
Validation Plan& Report
validationplan and validation report may consist
of the following sections:
Title
Planning
Performance Characteristics
Summary
6/24/2021 K.K. Nayak 30
30.
Title:
6/24/2021 K.K. Nayak31
Identify the method
When and who is performing
Method scope and a short description of method
The Analyte
Measurement Unit
Types of Sample
31.
Planning
• This sectionshould outline the purpose, e.g.
full validation of a new method,
verification of performance of a standardised
method,
extension to method scope,
6/24/2021 K.K. Nayak 32
32.
Performance characteristics:
• Thissection should give a brief explanation of
the performance characteristic,
• Outline the experiments which will be done
and
• How the results are to be evaluated?
• Results and conclusions from the experiments
should be stated.
6/24/2021 K.K. Nayak 33
33.
Summary
• The lastsection should summarize the
validation work and the results
• A concluding statement as to whether the
method is fit for purpose
6/24/2021 K.K. Nayak 34
![Definitions
6/24/2021 K.K. Nayak 3
Method validation is basically the process of defining
an analytical requirement, and confirming that the
method under consideration has capabilities consistent
with what the application requires.
confirmation, through the provision of objective
evidence, that the requirements for a specific
intended use are fulfilled [ISO/IEC 17025]
confirmation by examination and provision of
objective evidence that the particular
requirements for a specific intended use or
application have been fulfilled [ISO 9000]](https://image.slidesharecdn.com/method-validation-210624161351/75/Method-validation-2-2048.jpg)
![Limits of detection (LoD) and determination
6/24/2021 K.K. Nayak 22
These values refer to the statistical
limits below which results of detection
or accurate quantitative measurements
(determination) should not be reported.
The levels of both are dependent upon
the variability of the signal when a blank
containing none of the analyte is being
measured. The signal generated under
these conditions is mostly signal noise
and is assumed to exhibit a normal
distribution pattern. Both the blank
signal and the standard deviation of
the blank signal need to be measured.
From this data we can calculate both
limits.
Example: In an analysis of trace
Cd by plasma emission
spectrometry the following data
were obtained:
• mean blank (Bl) signal 4
• SD of blank signal 12
• 500 ppb Cd 2000
LoD = Bl signal + 3(SD of Bl)
= 4 + 3(12)
= 40
This equates to: [40/2000] X 500 ppb
= 10 ppb Cd
The limit of determination uses a
similar formula, replacing the
3 SD’s by 10. This gives the limit of
determination as 31 ppb Cd](https://image.slidesharecdn.com/method-validation-210624161351/75/Method-validation-21-2048.jpg)
![Method validation -
precision
6/24/2021 K.K. Nayak 26
You have seen already that,
precision is measured in
terms of standard deviation (SD).
Assuming that the variability of
the measurements is totally
random (obeys a normal
distribution curve) then
a formula derived from this
distribution may be used
to calculate standard deviation.
SD = [ Σ(xi - x)2/(n - 1)]1/2
where:
xi = individual data point
x = mean value of the data
n = the total number of data points
Σ = the sum of
Normal distribution curve
0
20
40
60
80
100
0 50 100 150
Data points
Frequency
of
occurrence
Estimation of true mean
In practice around 8 - 10 data points are used normally to calculate the
SD, although statisticians would recommend 50](https://image.slidesharecdn.com/method-validation-210624161351/75/Method-validation-25-2048.jpg)