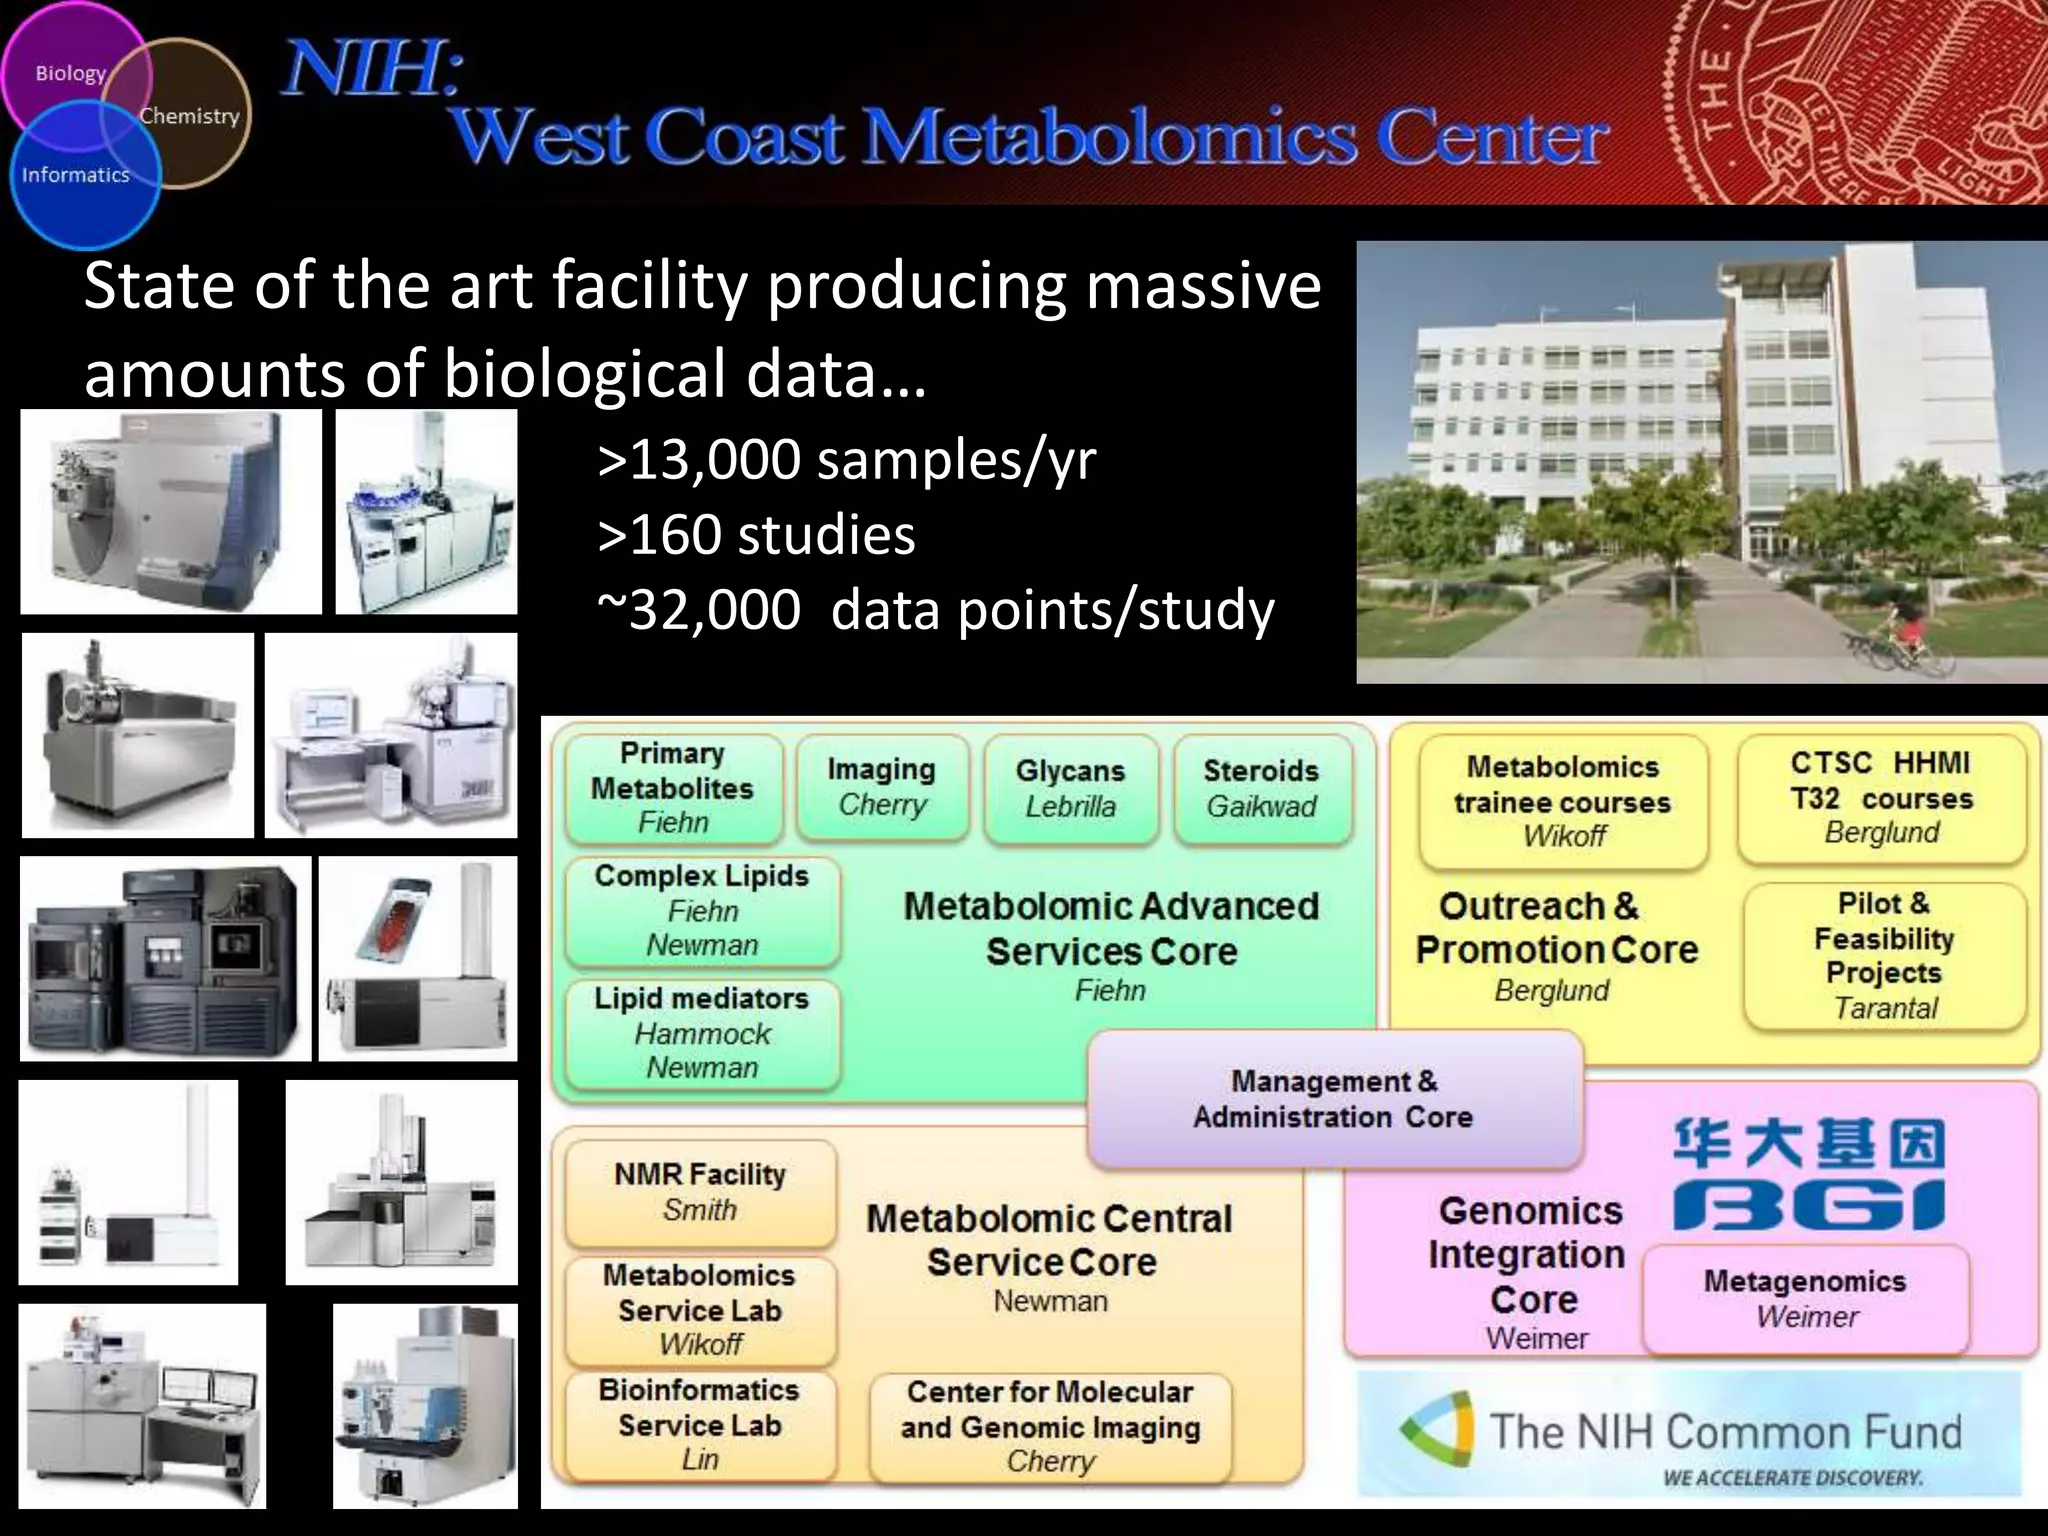
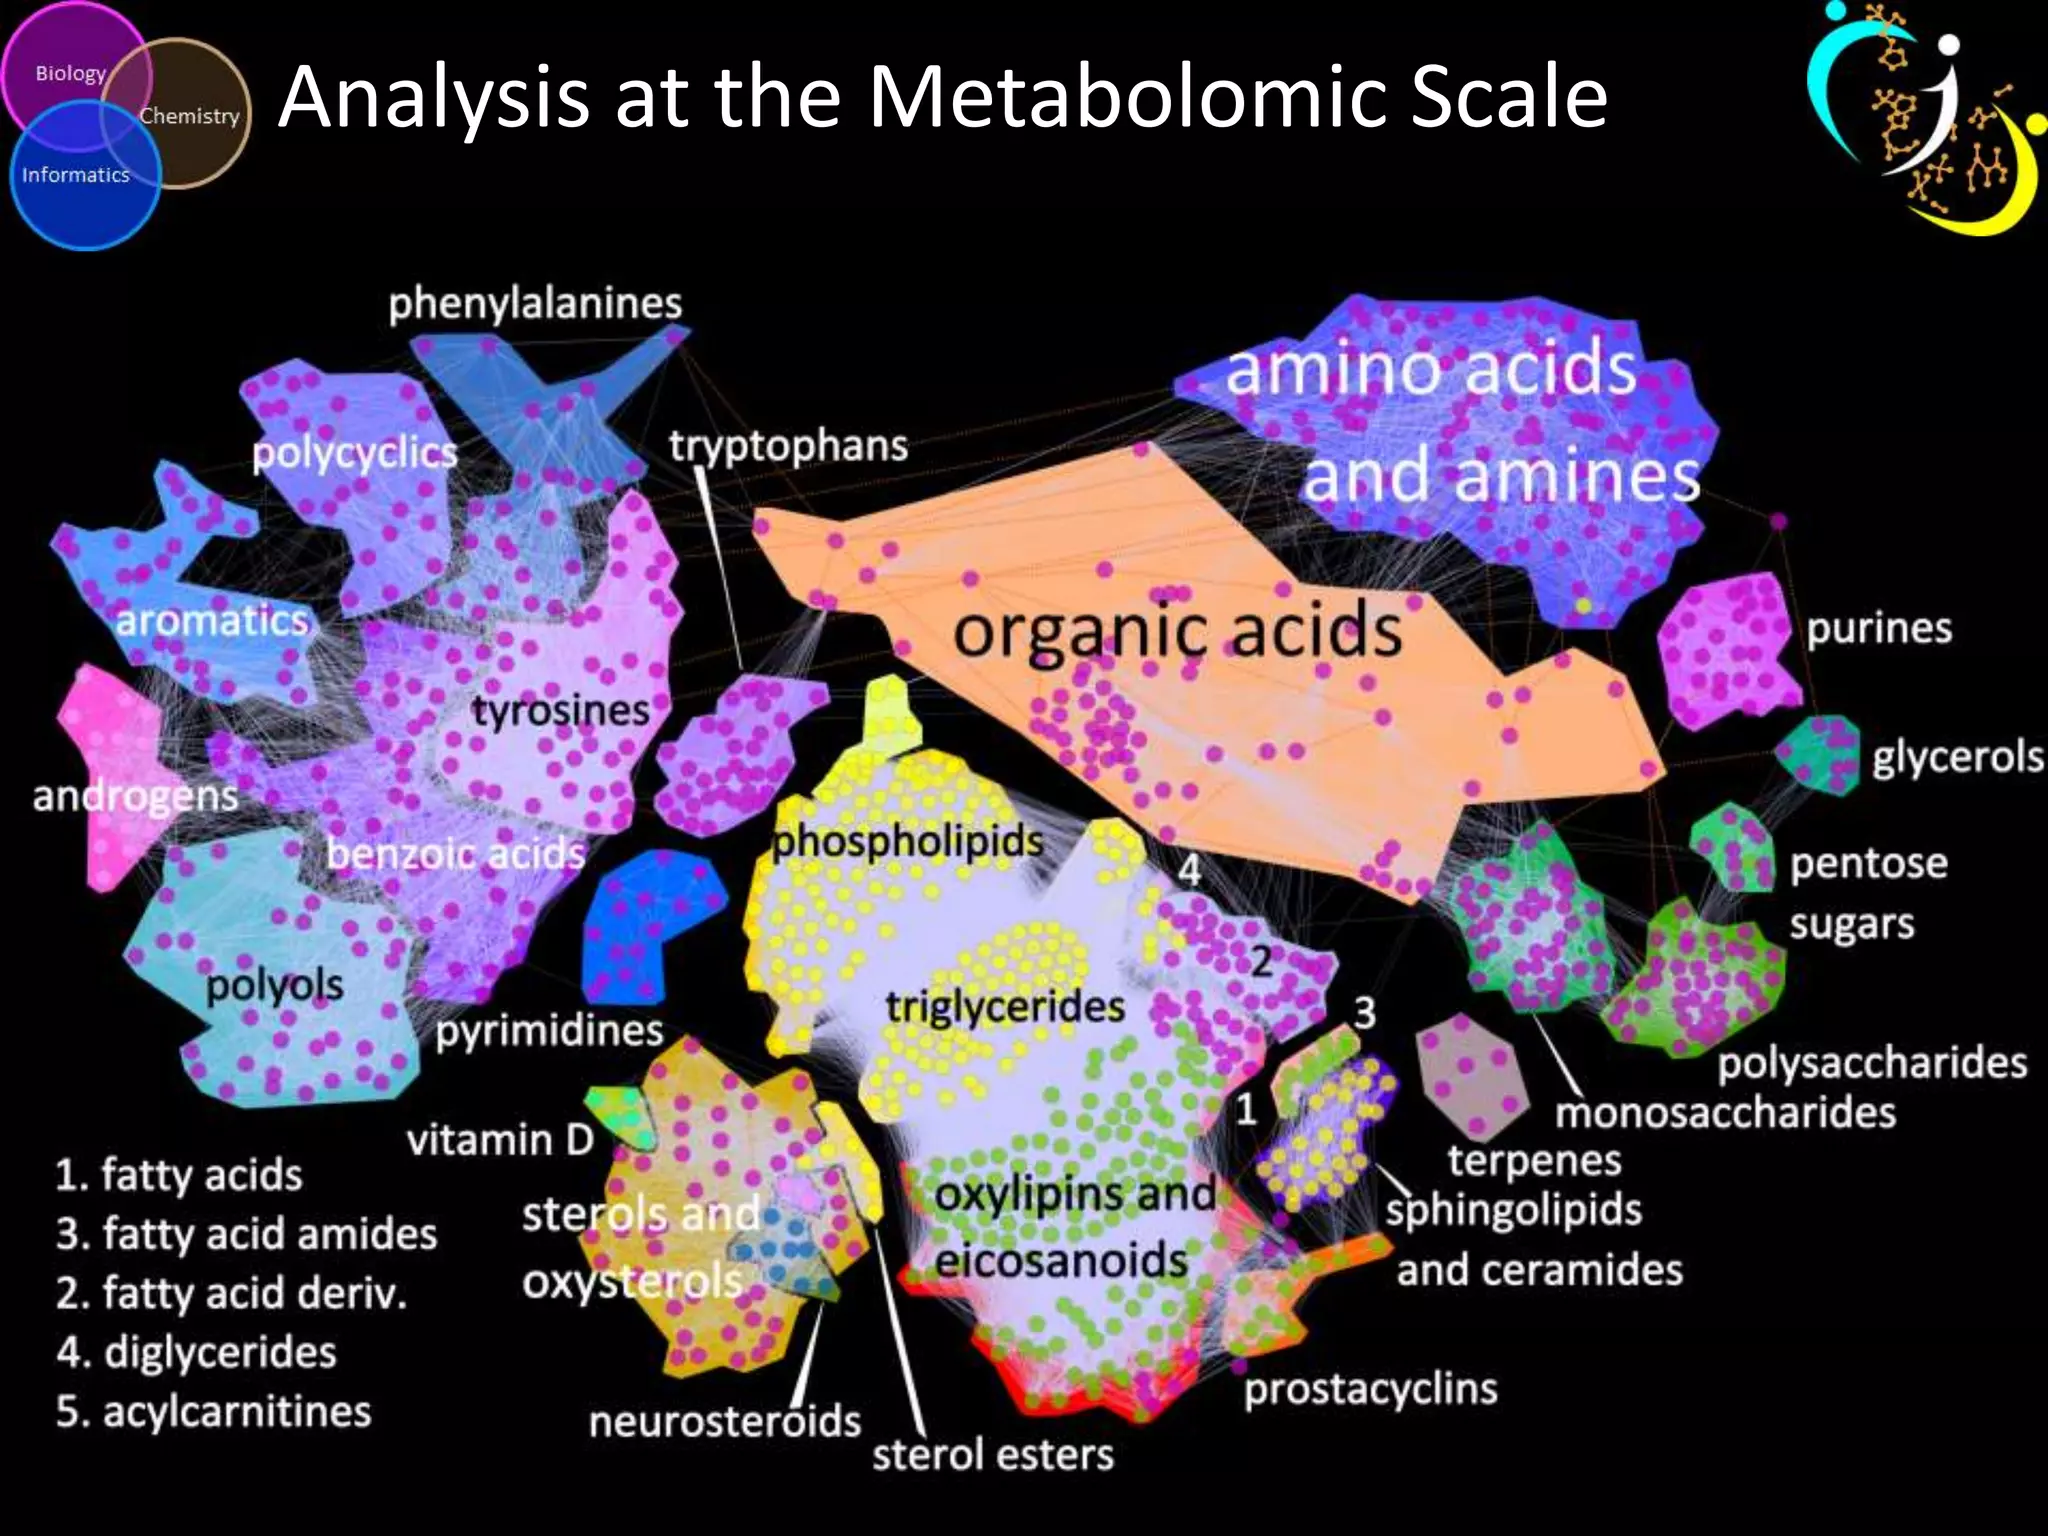
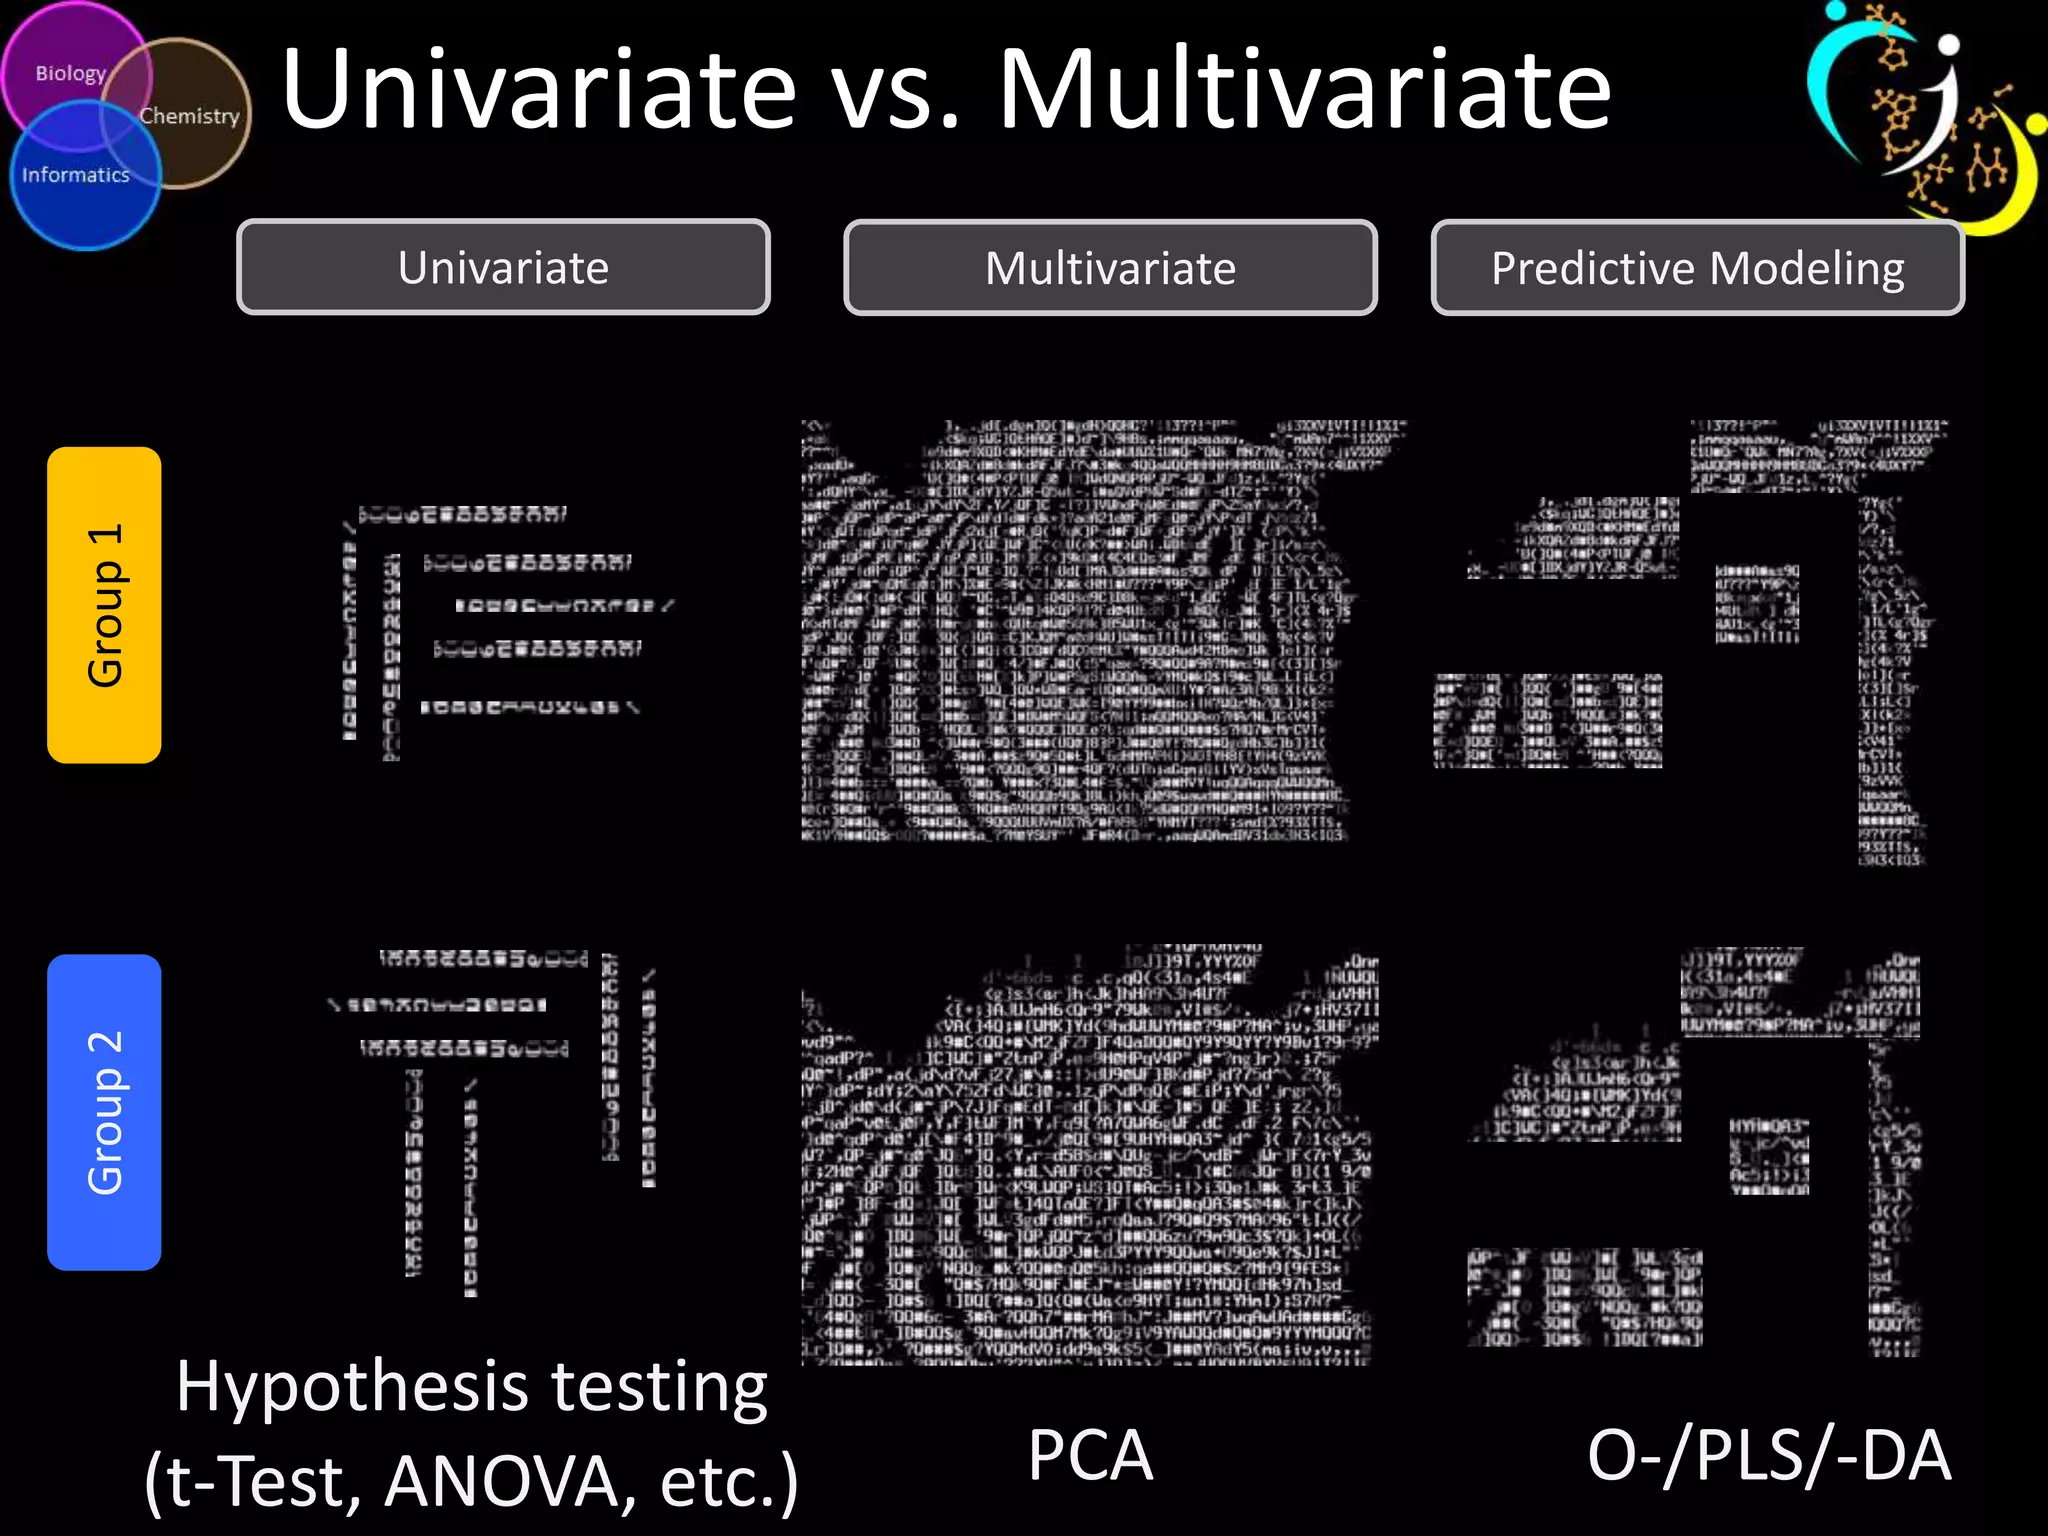
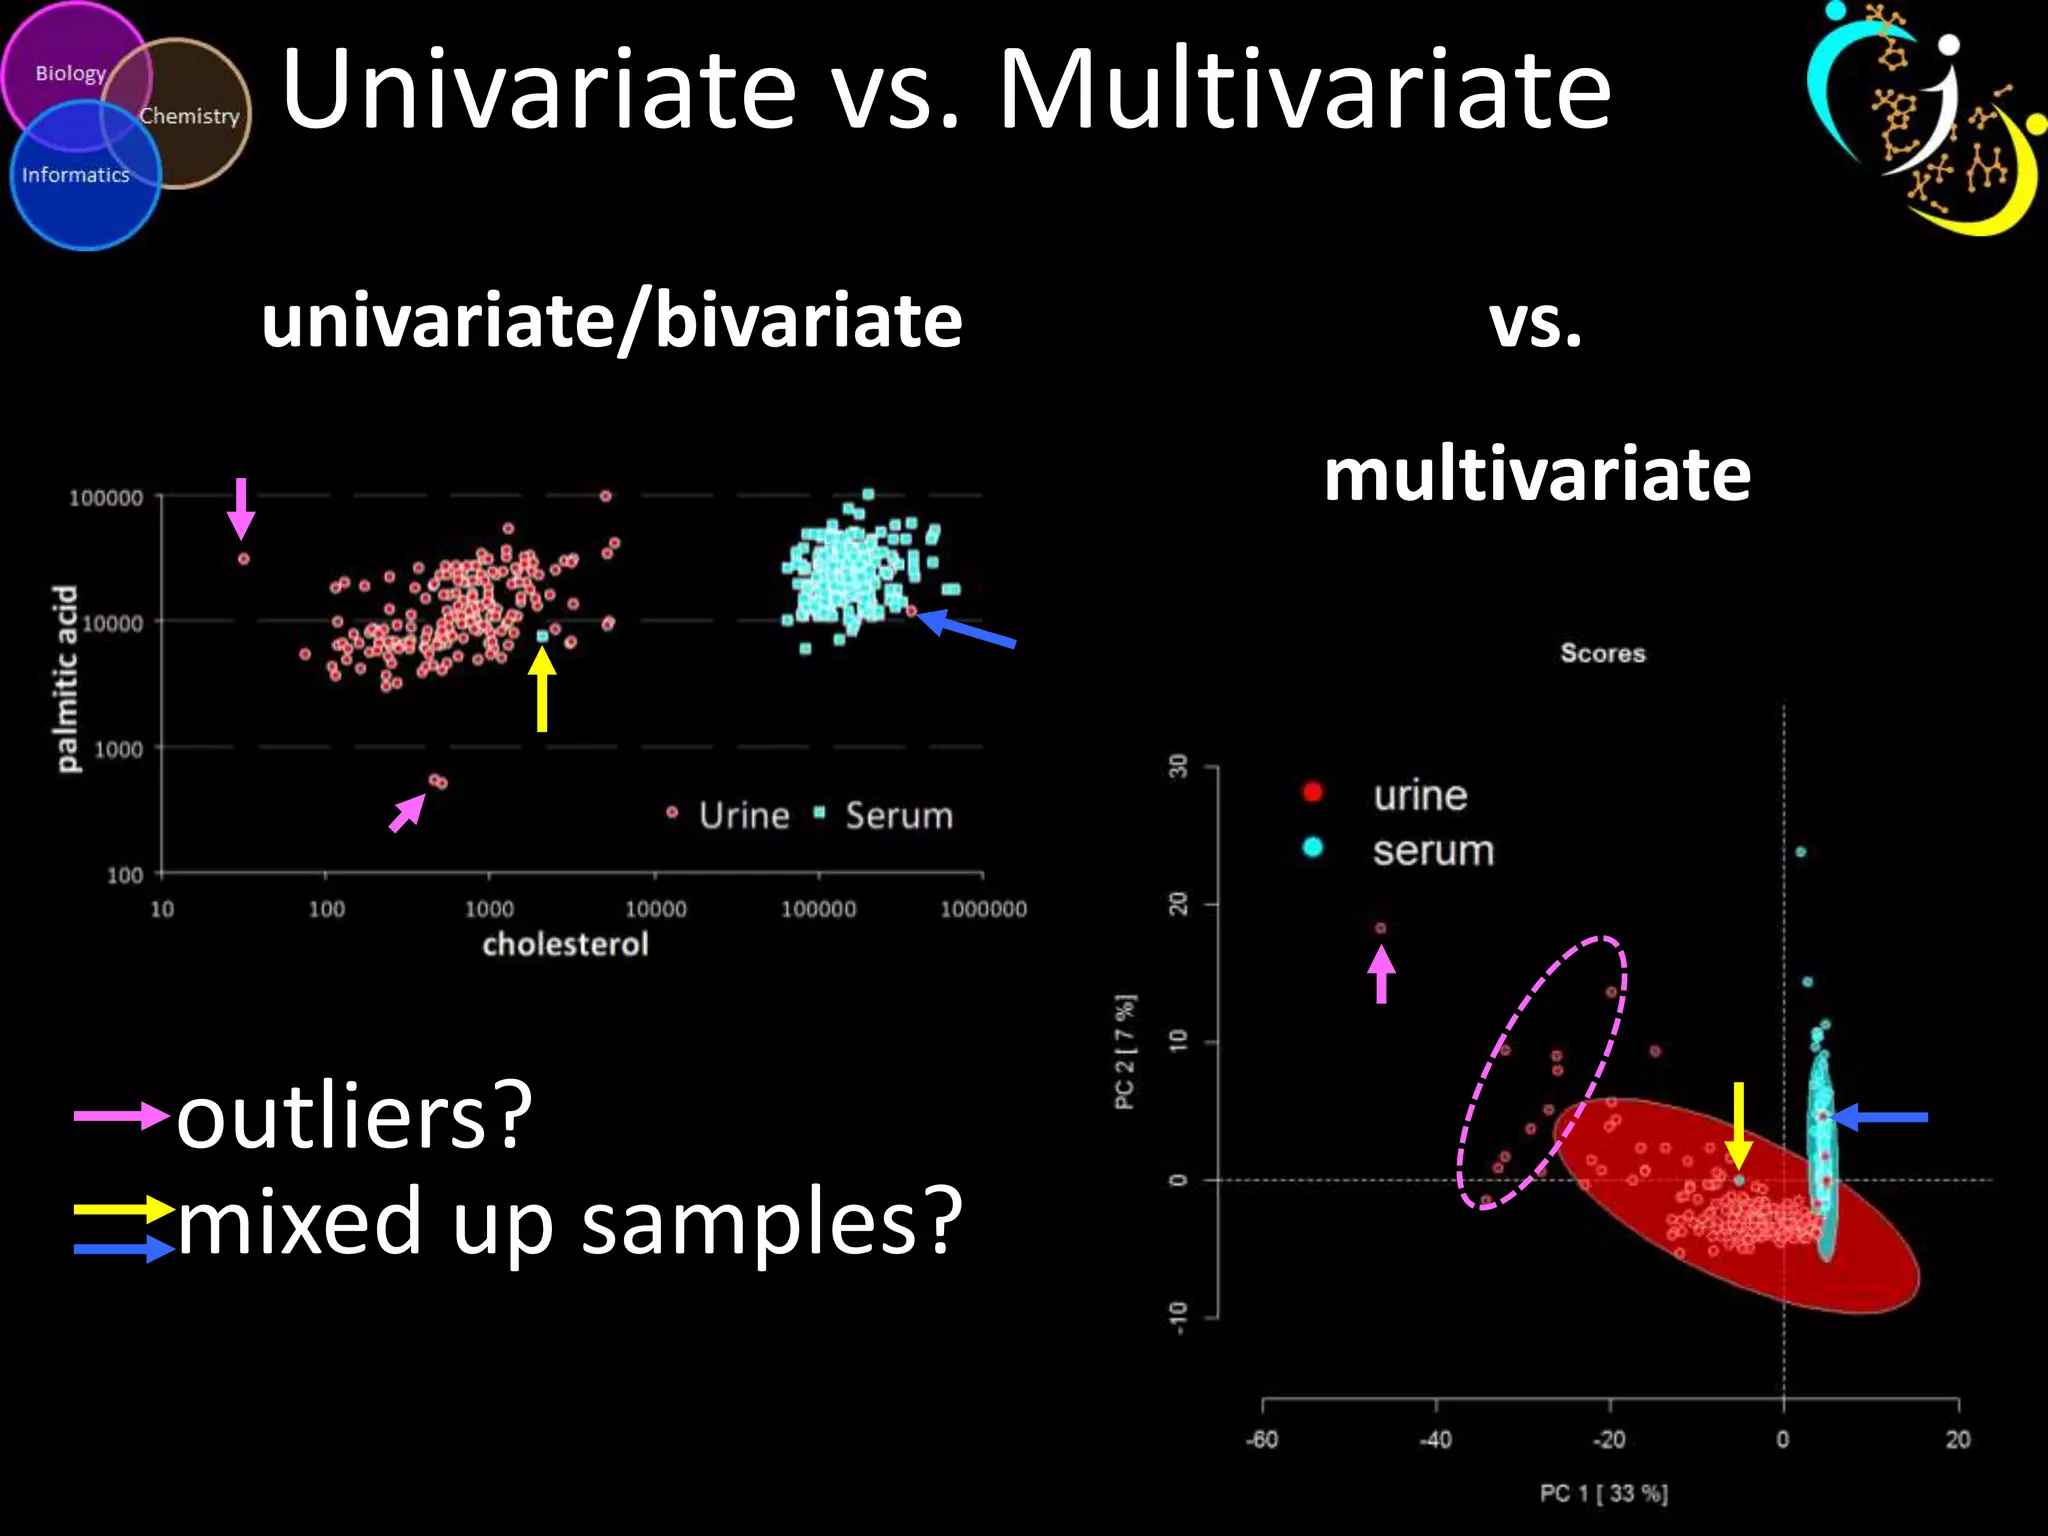
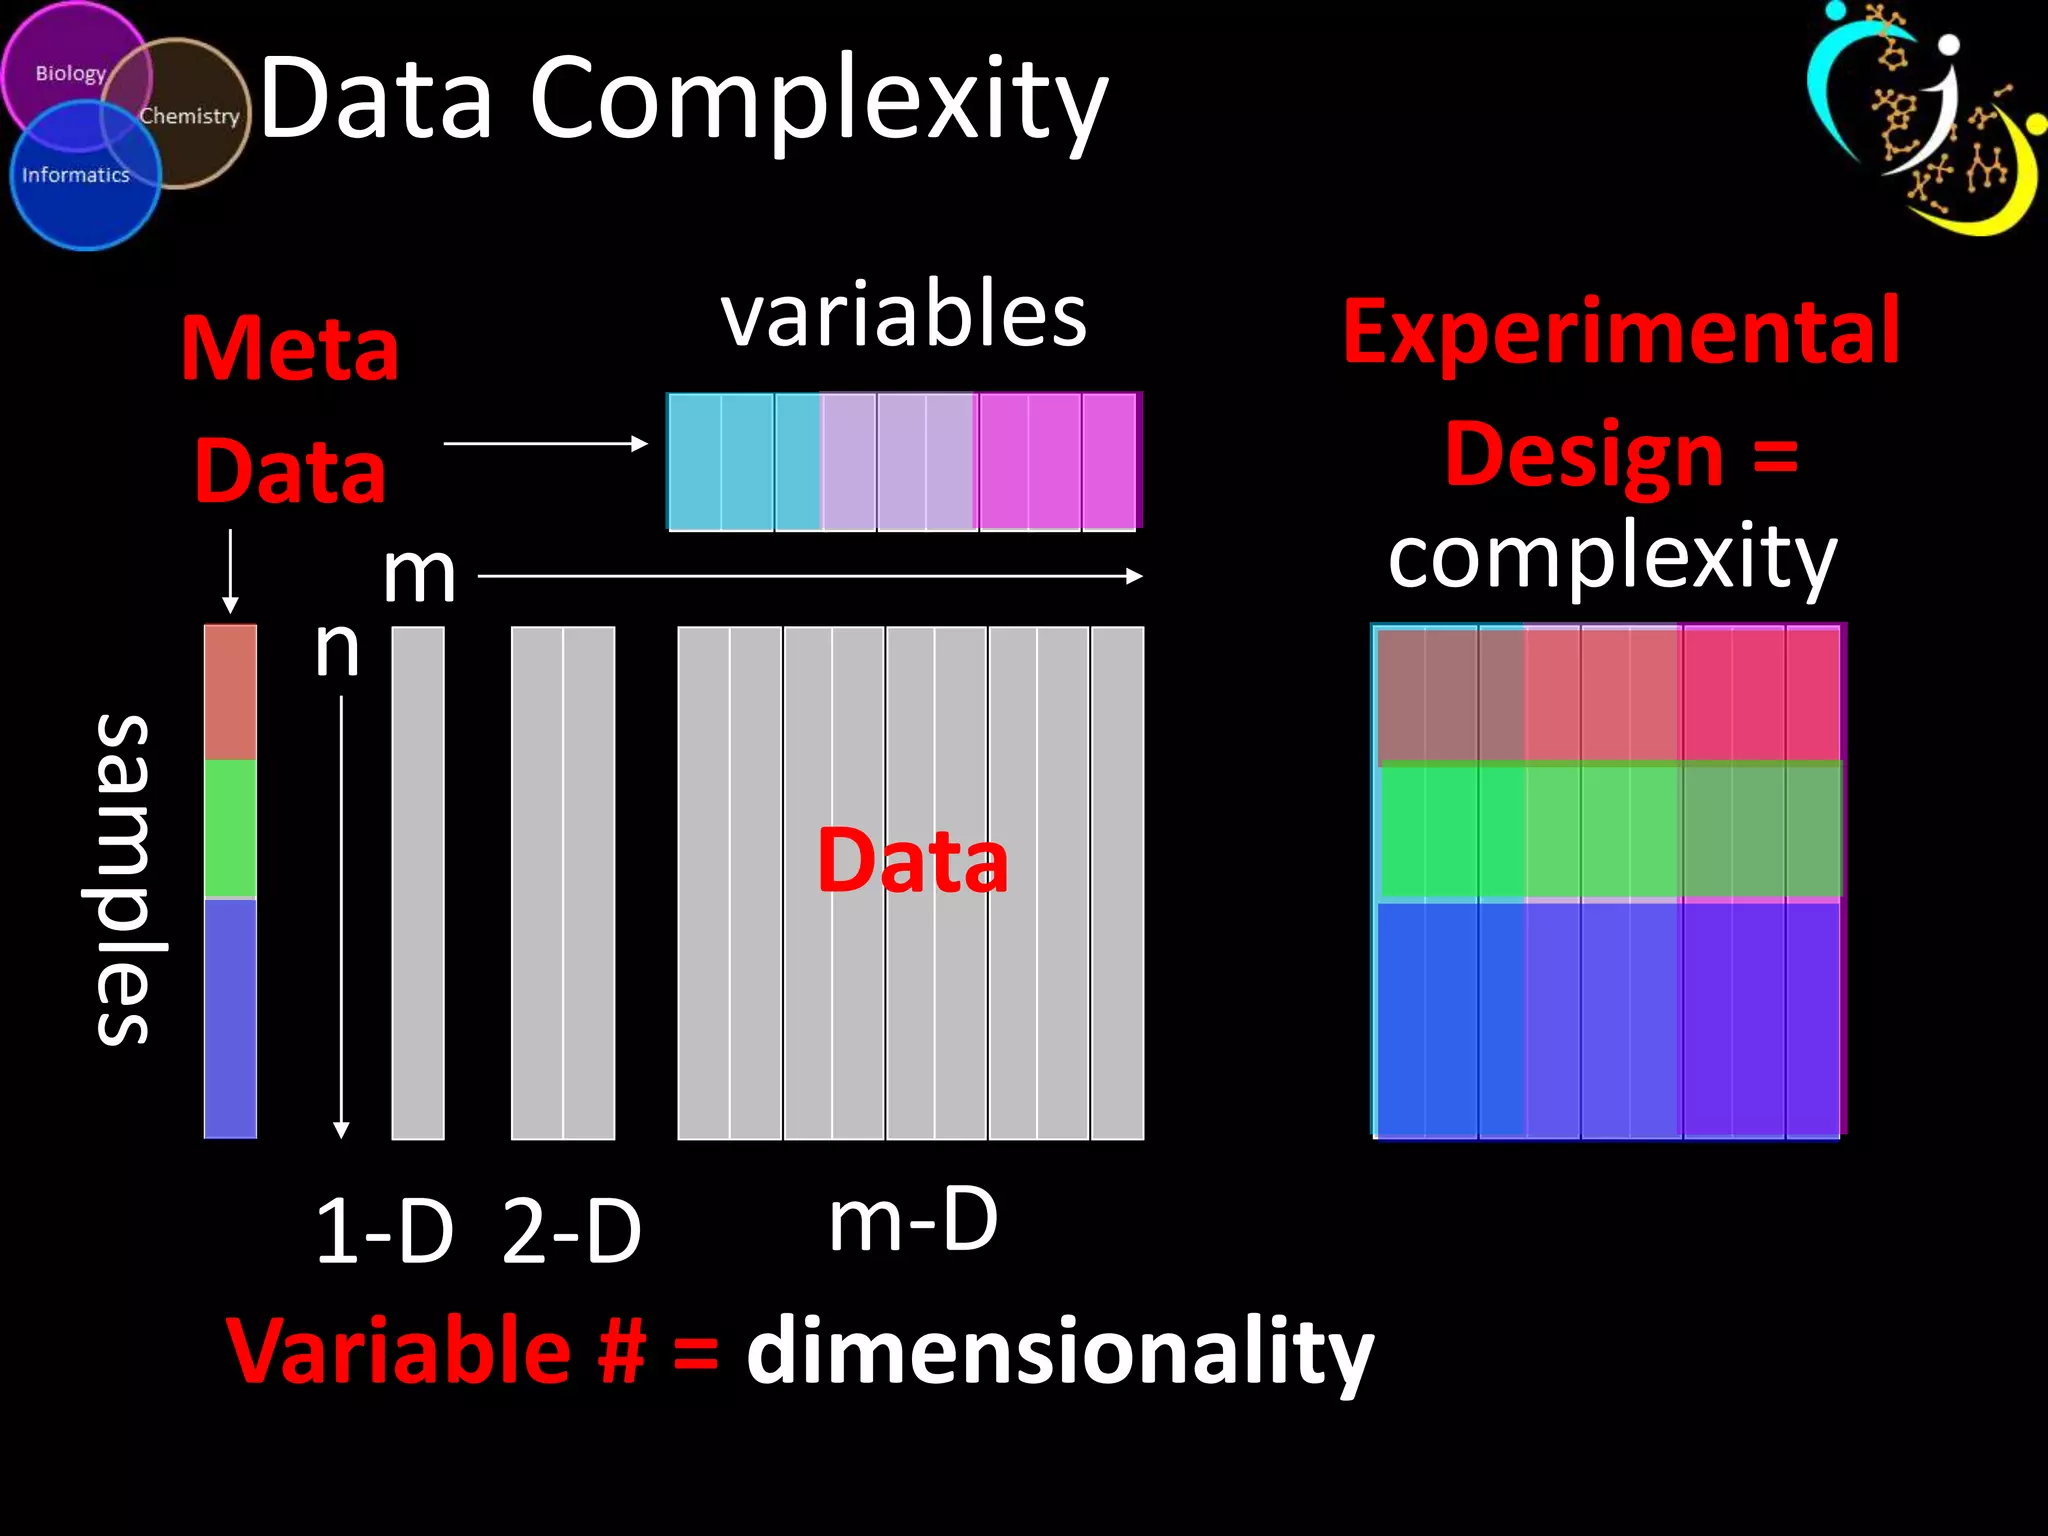
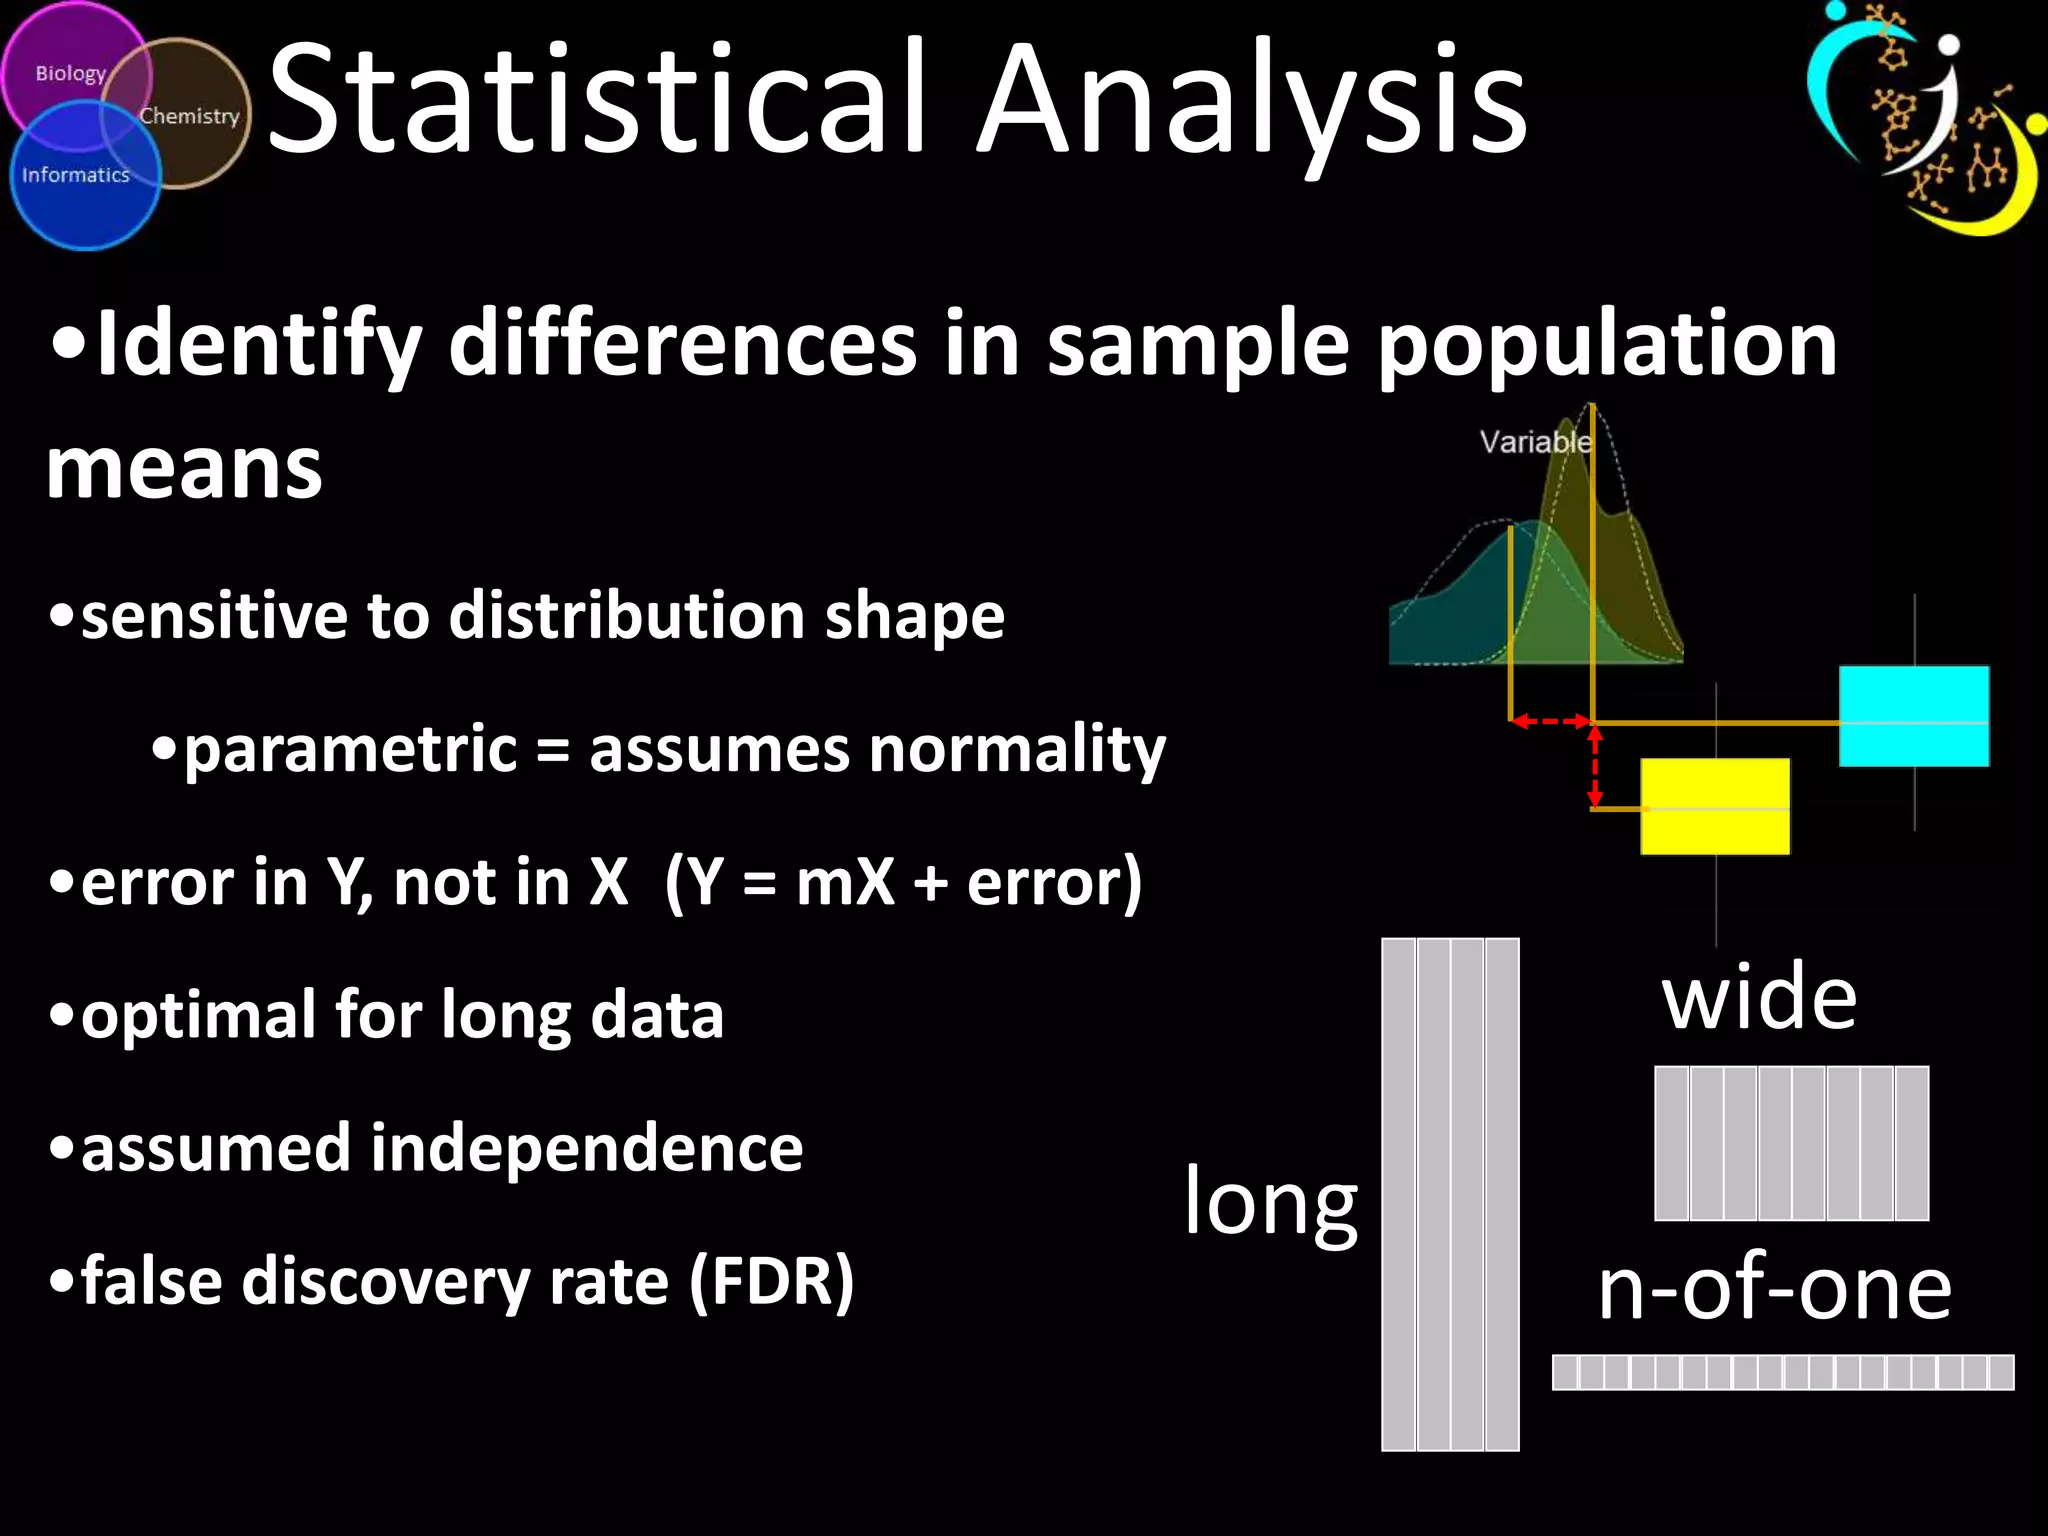
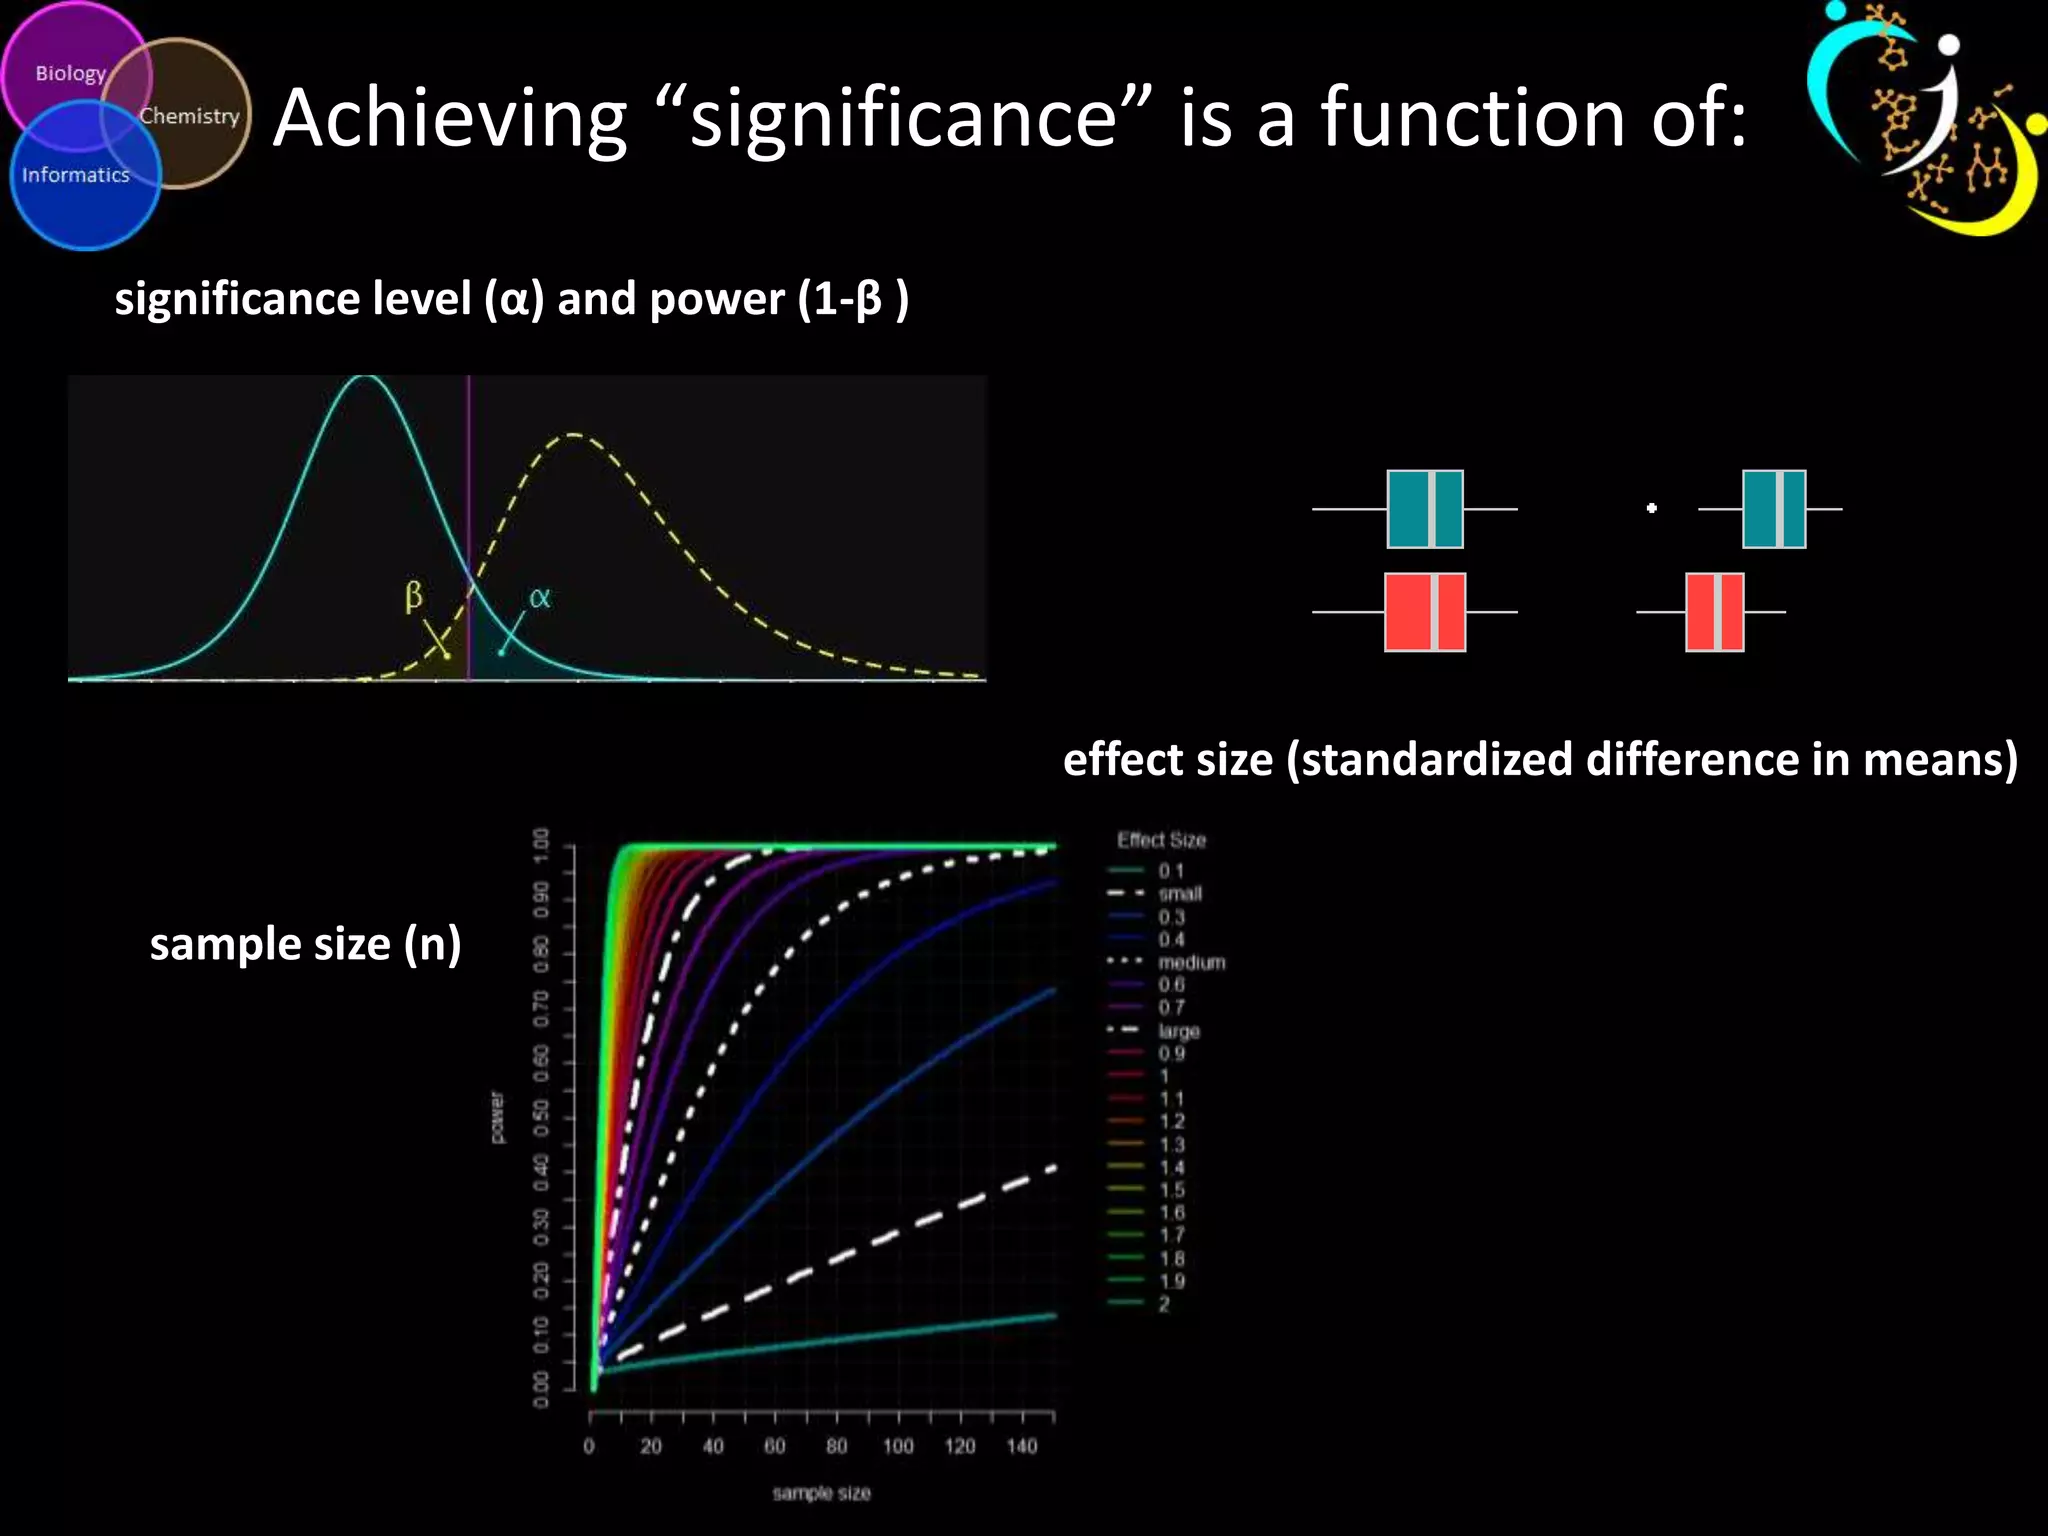
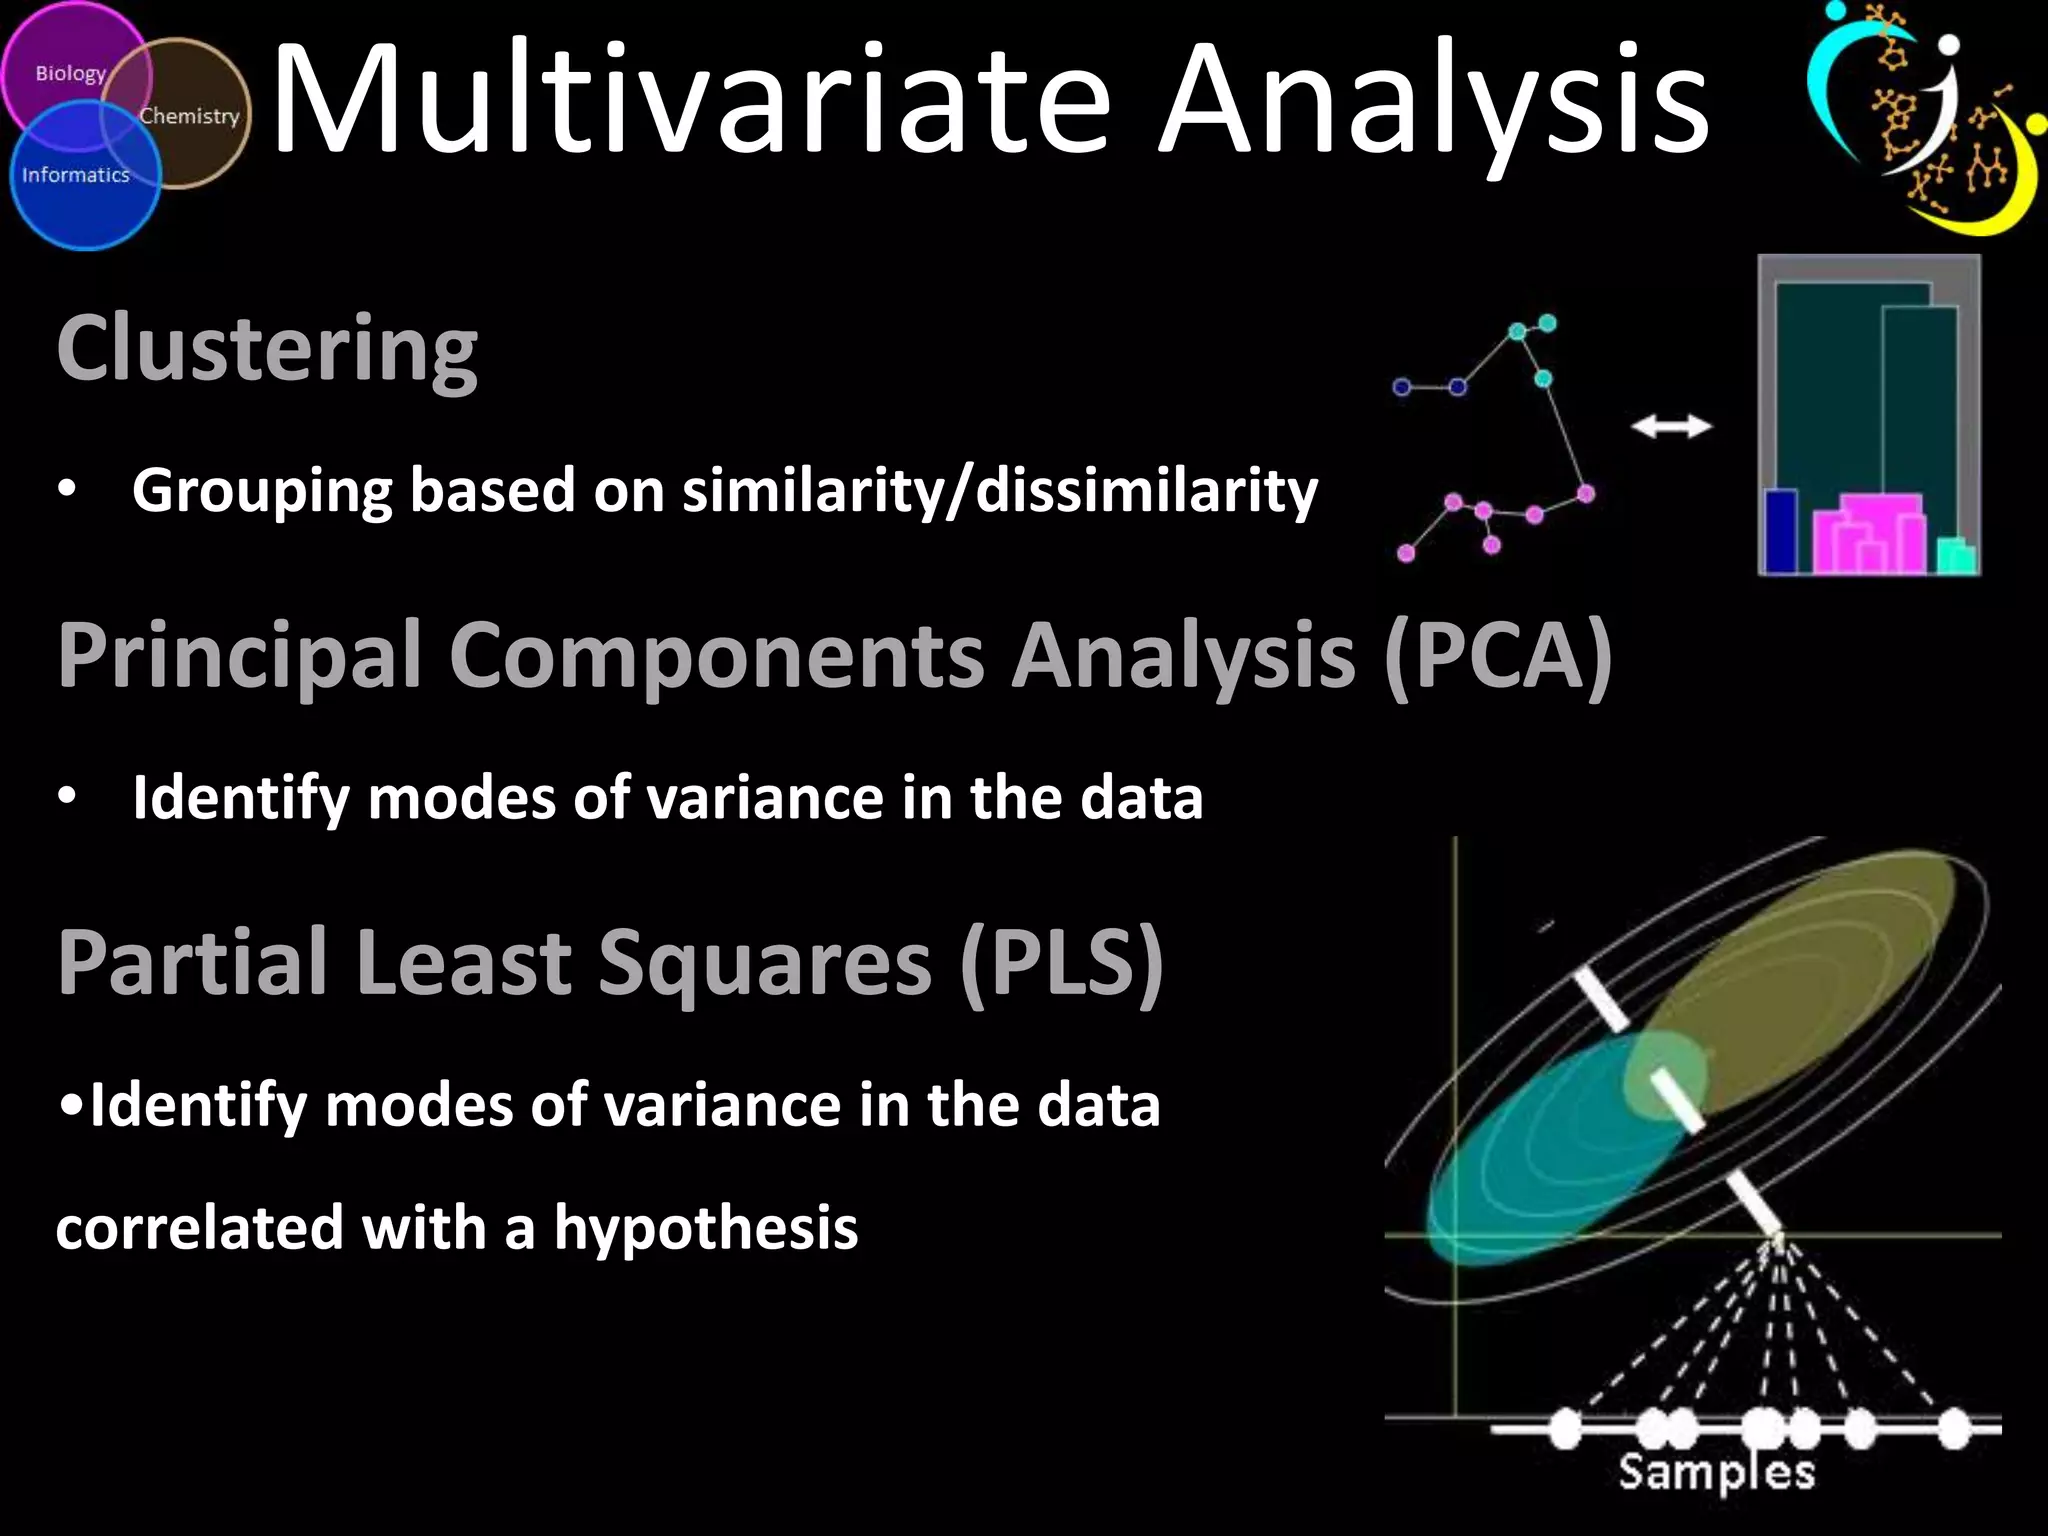
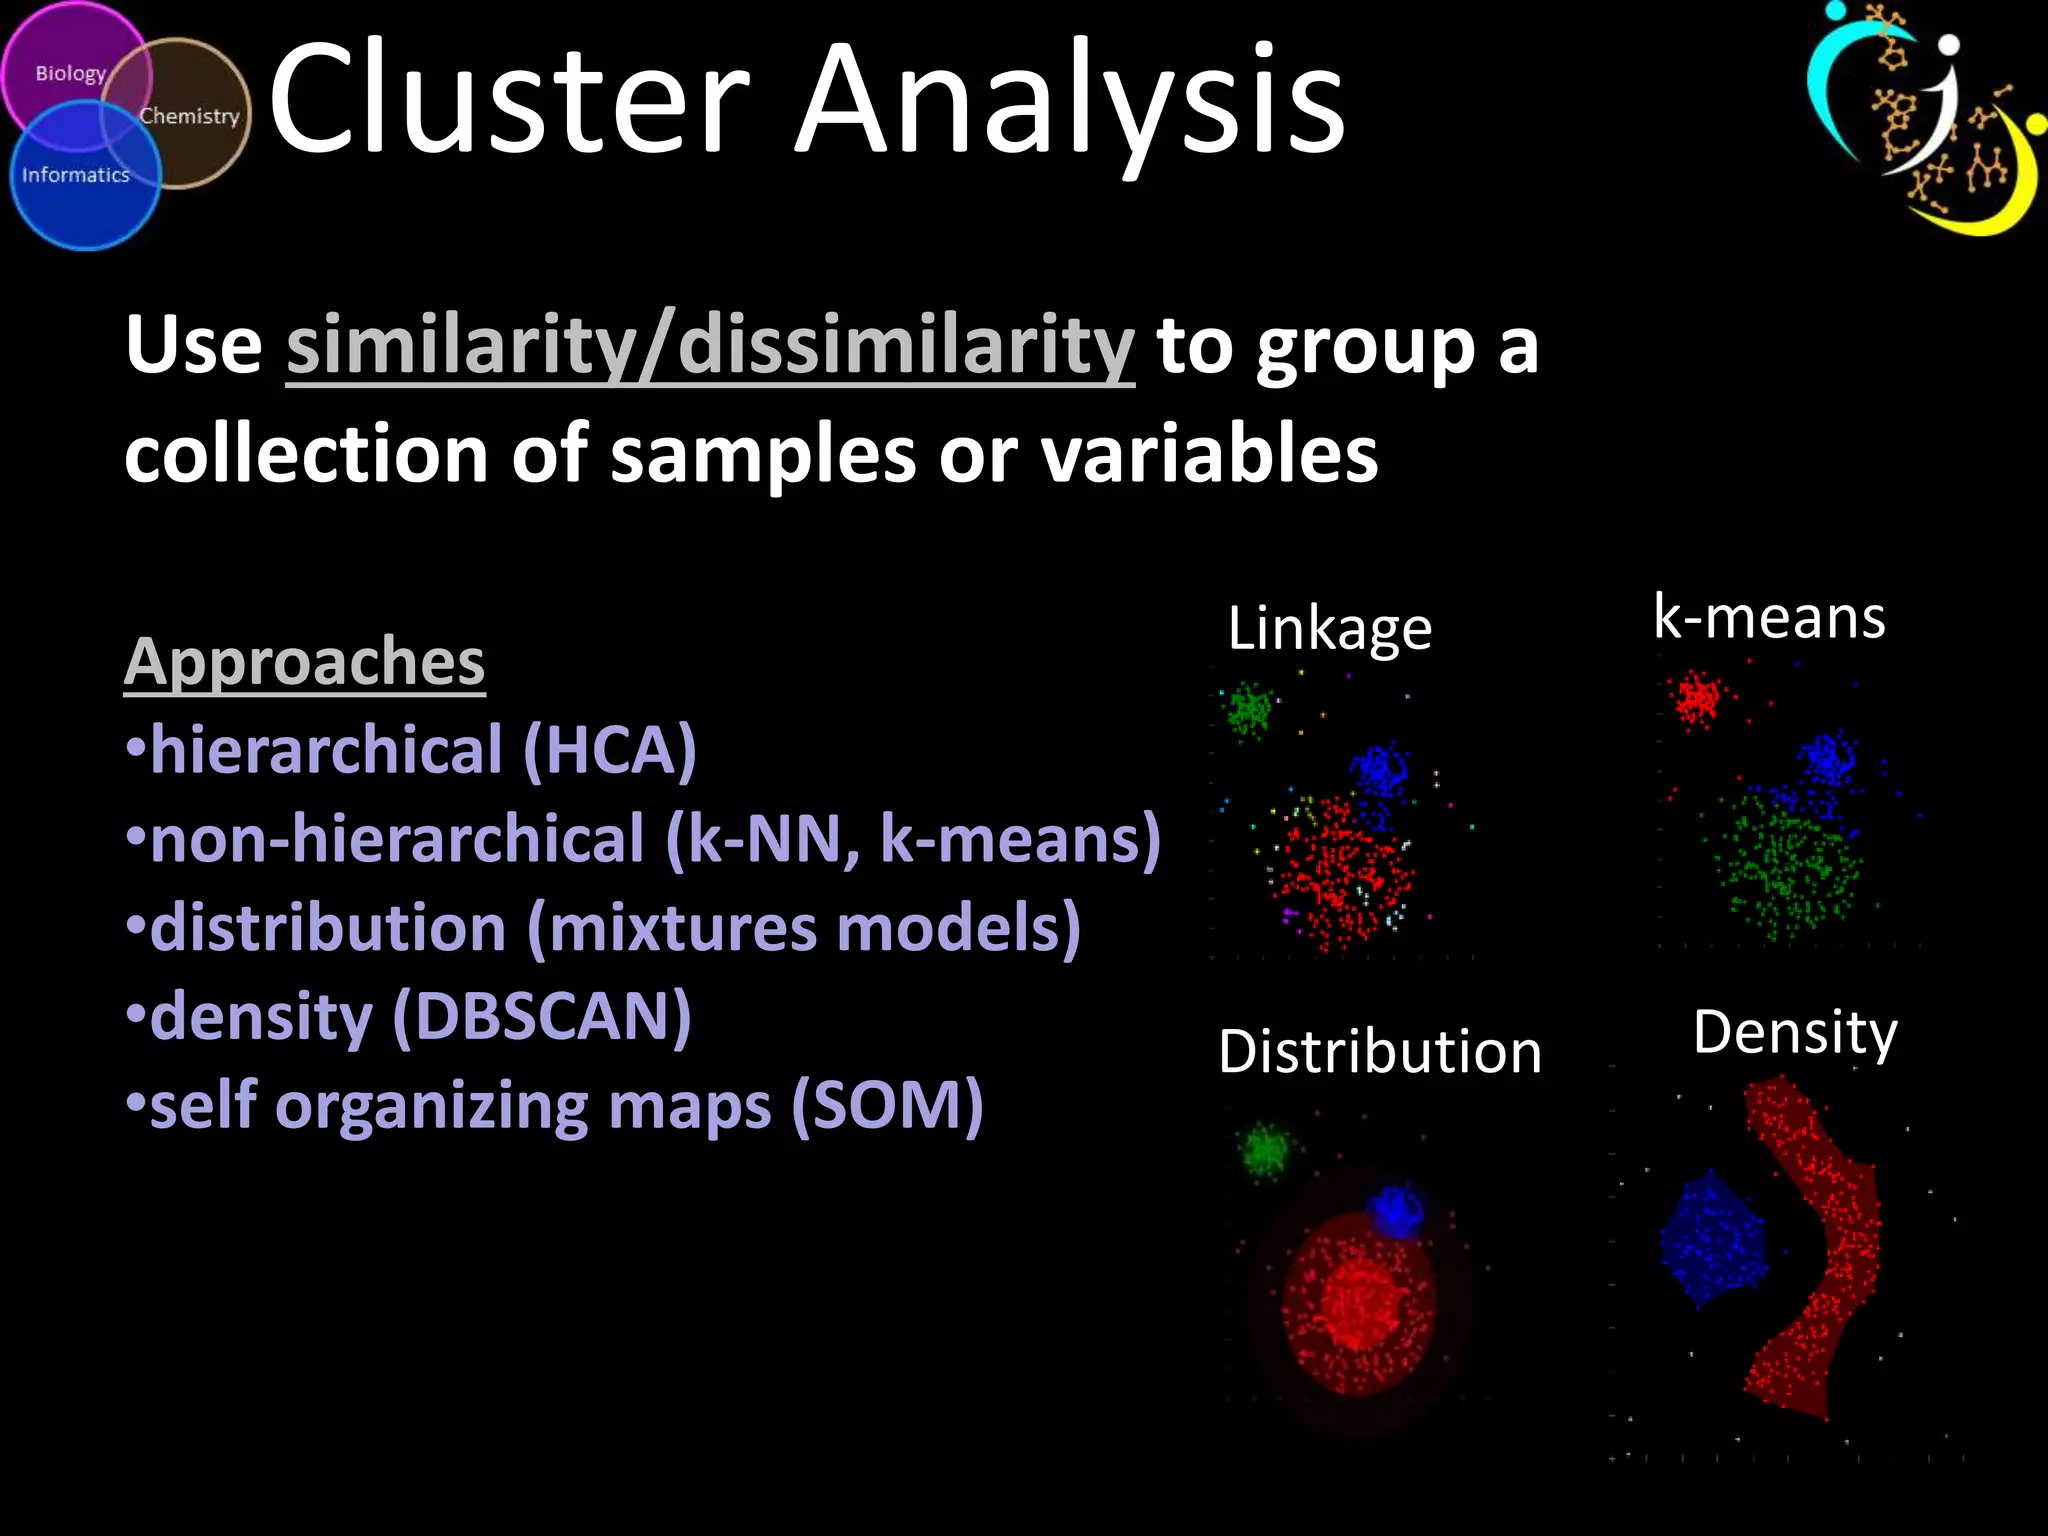
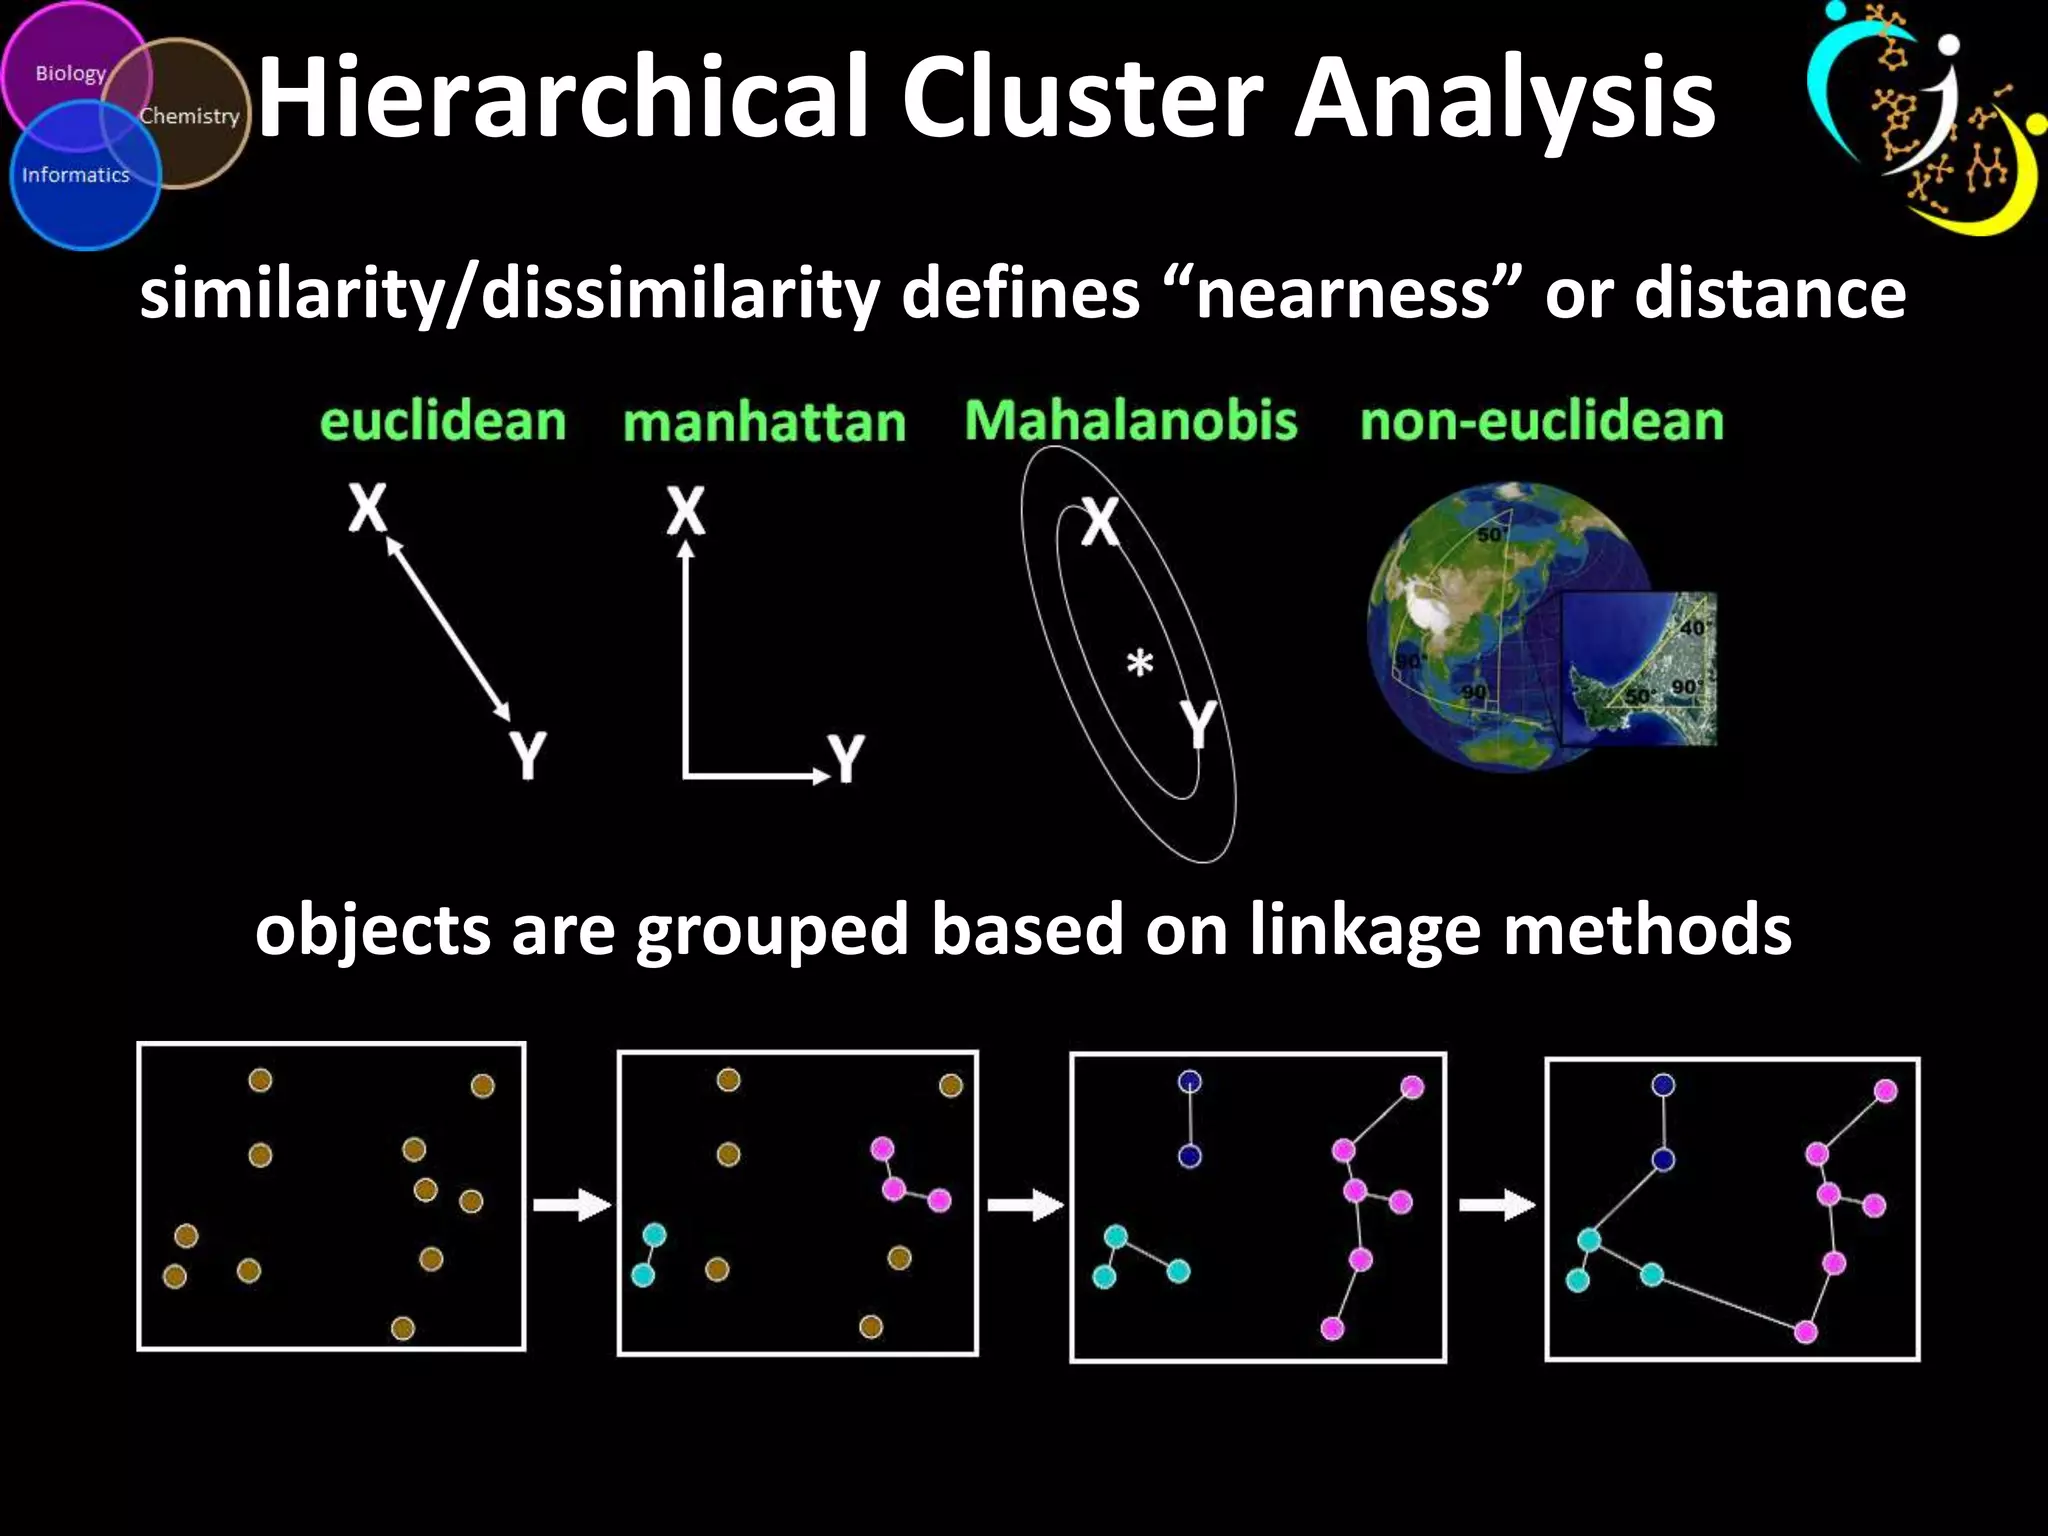
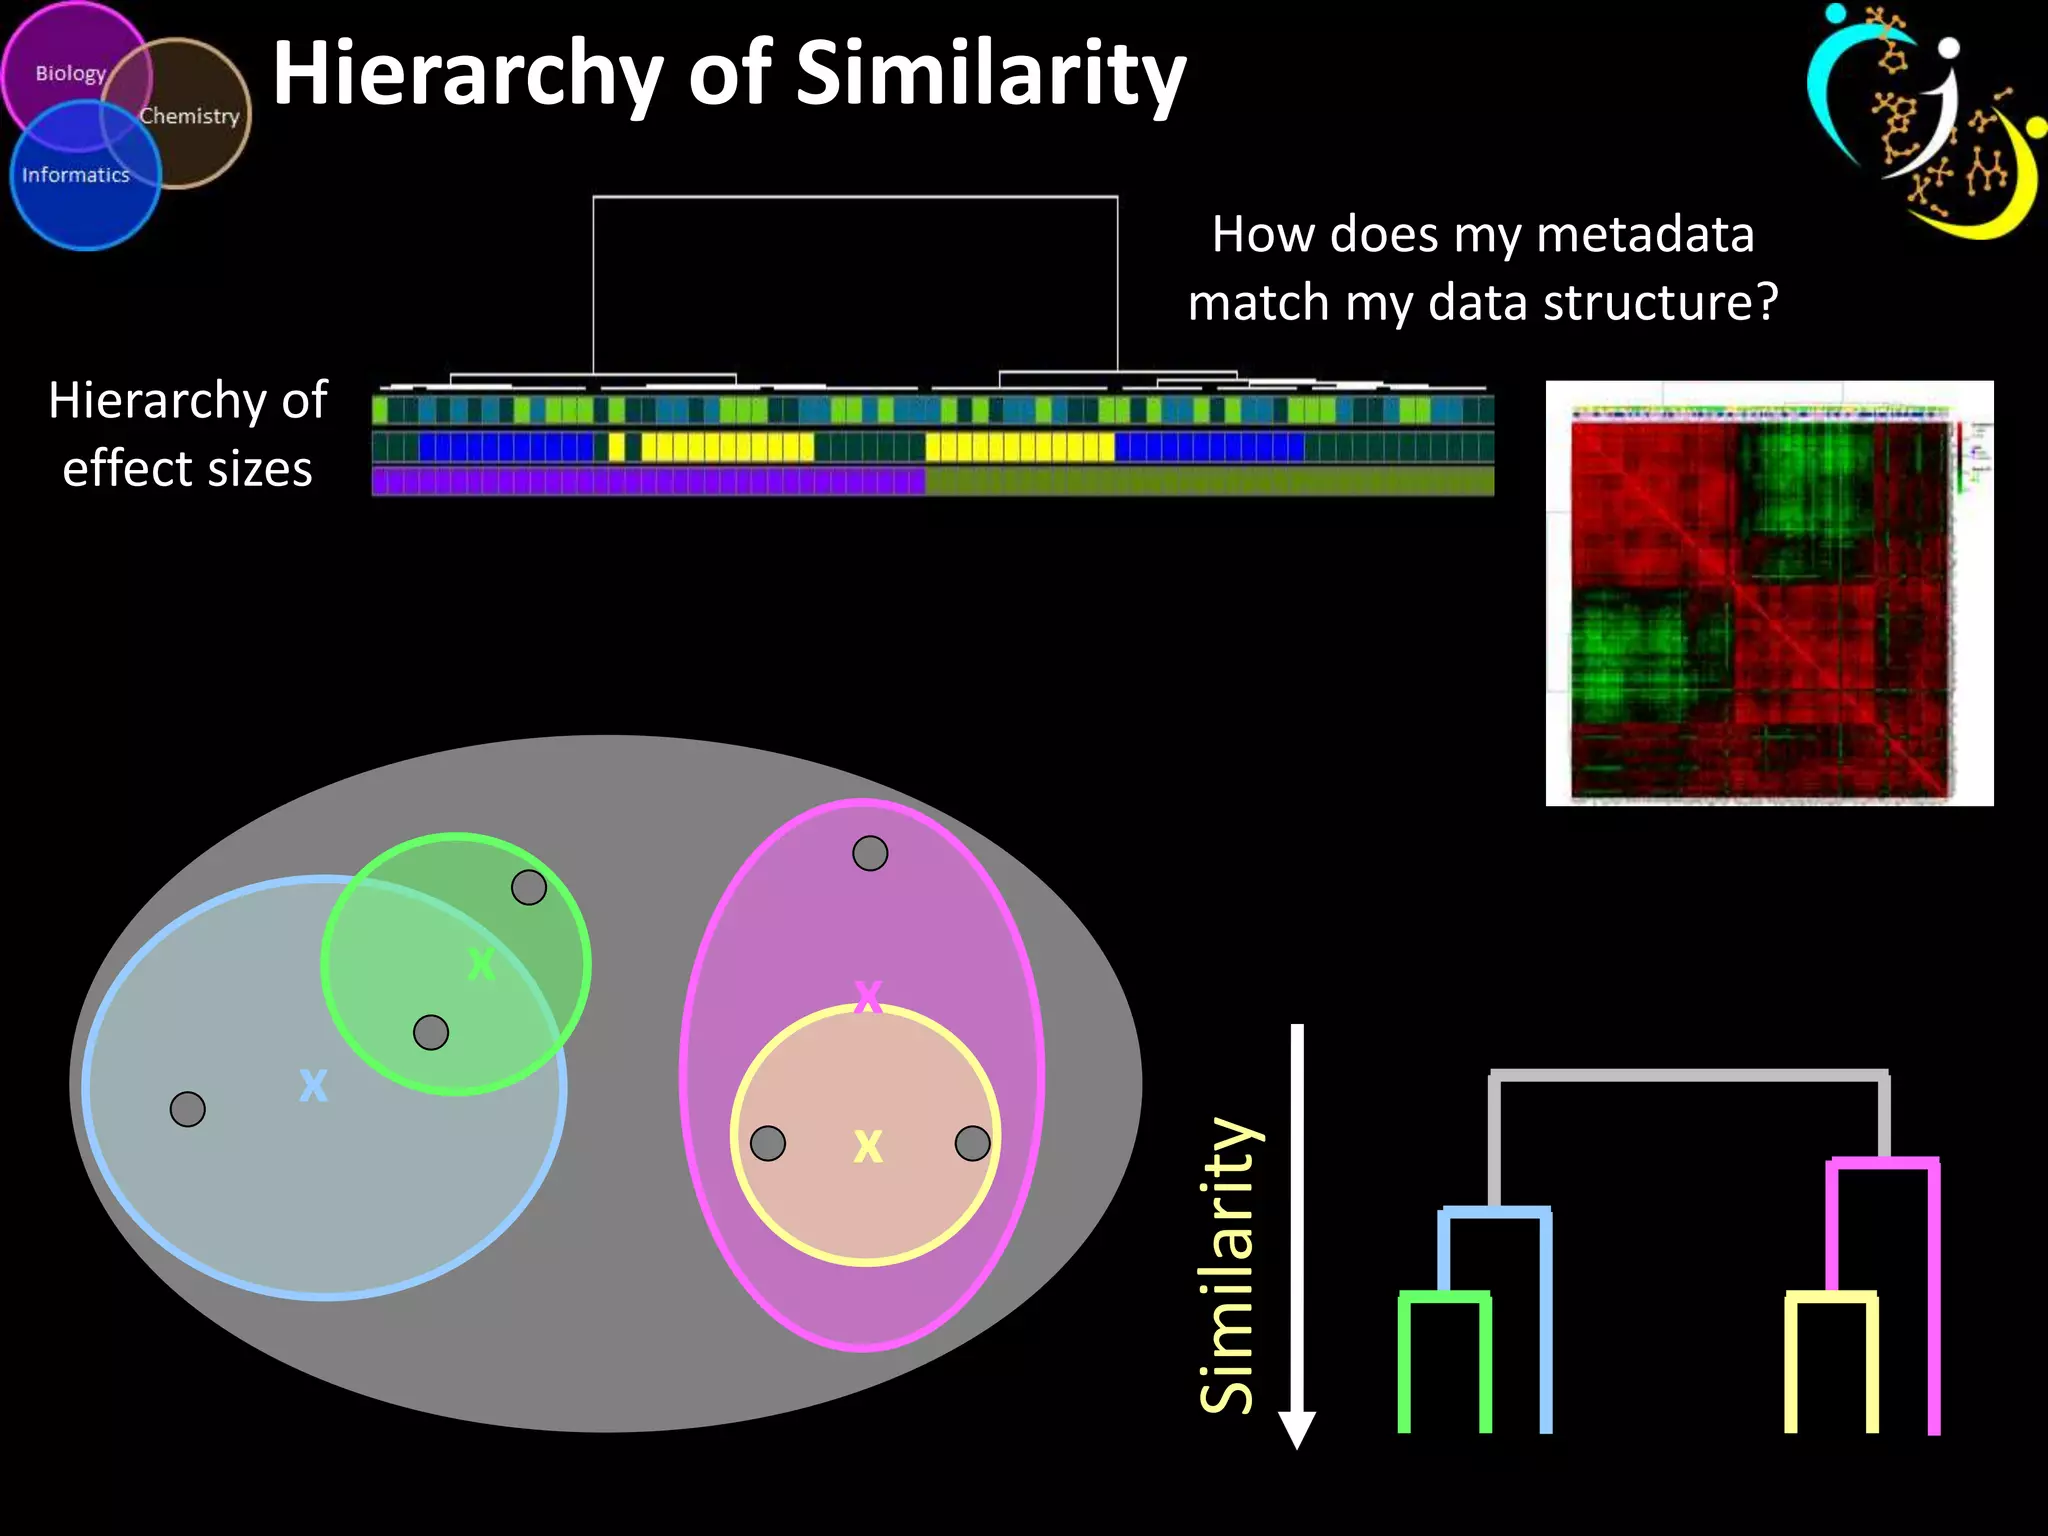
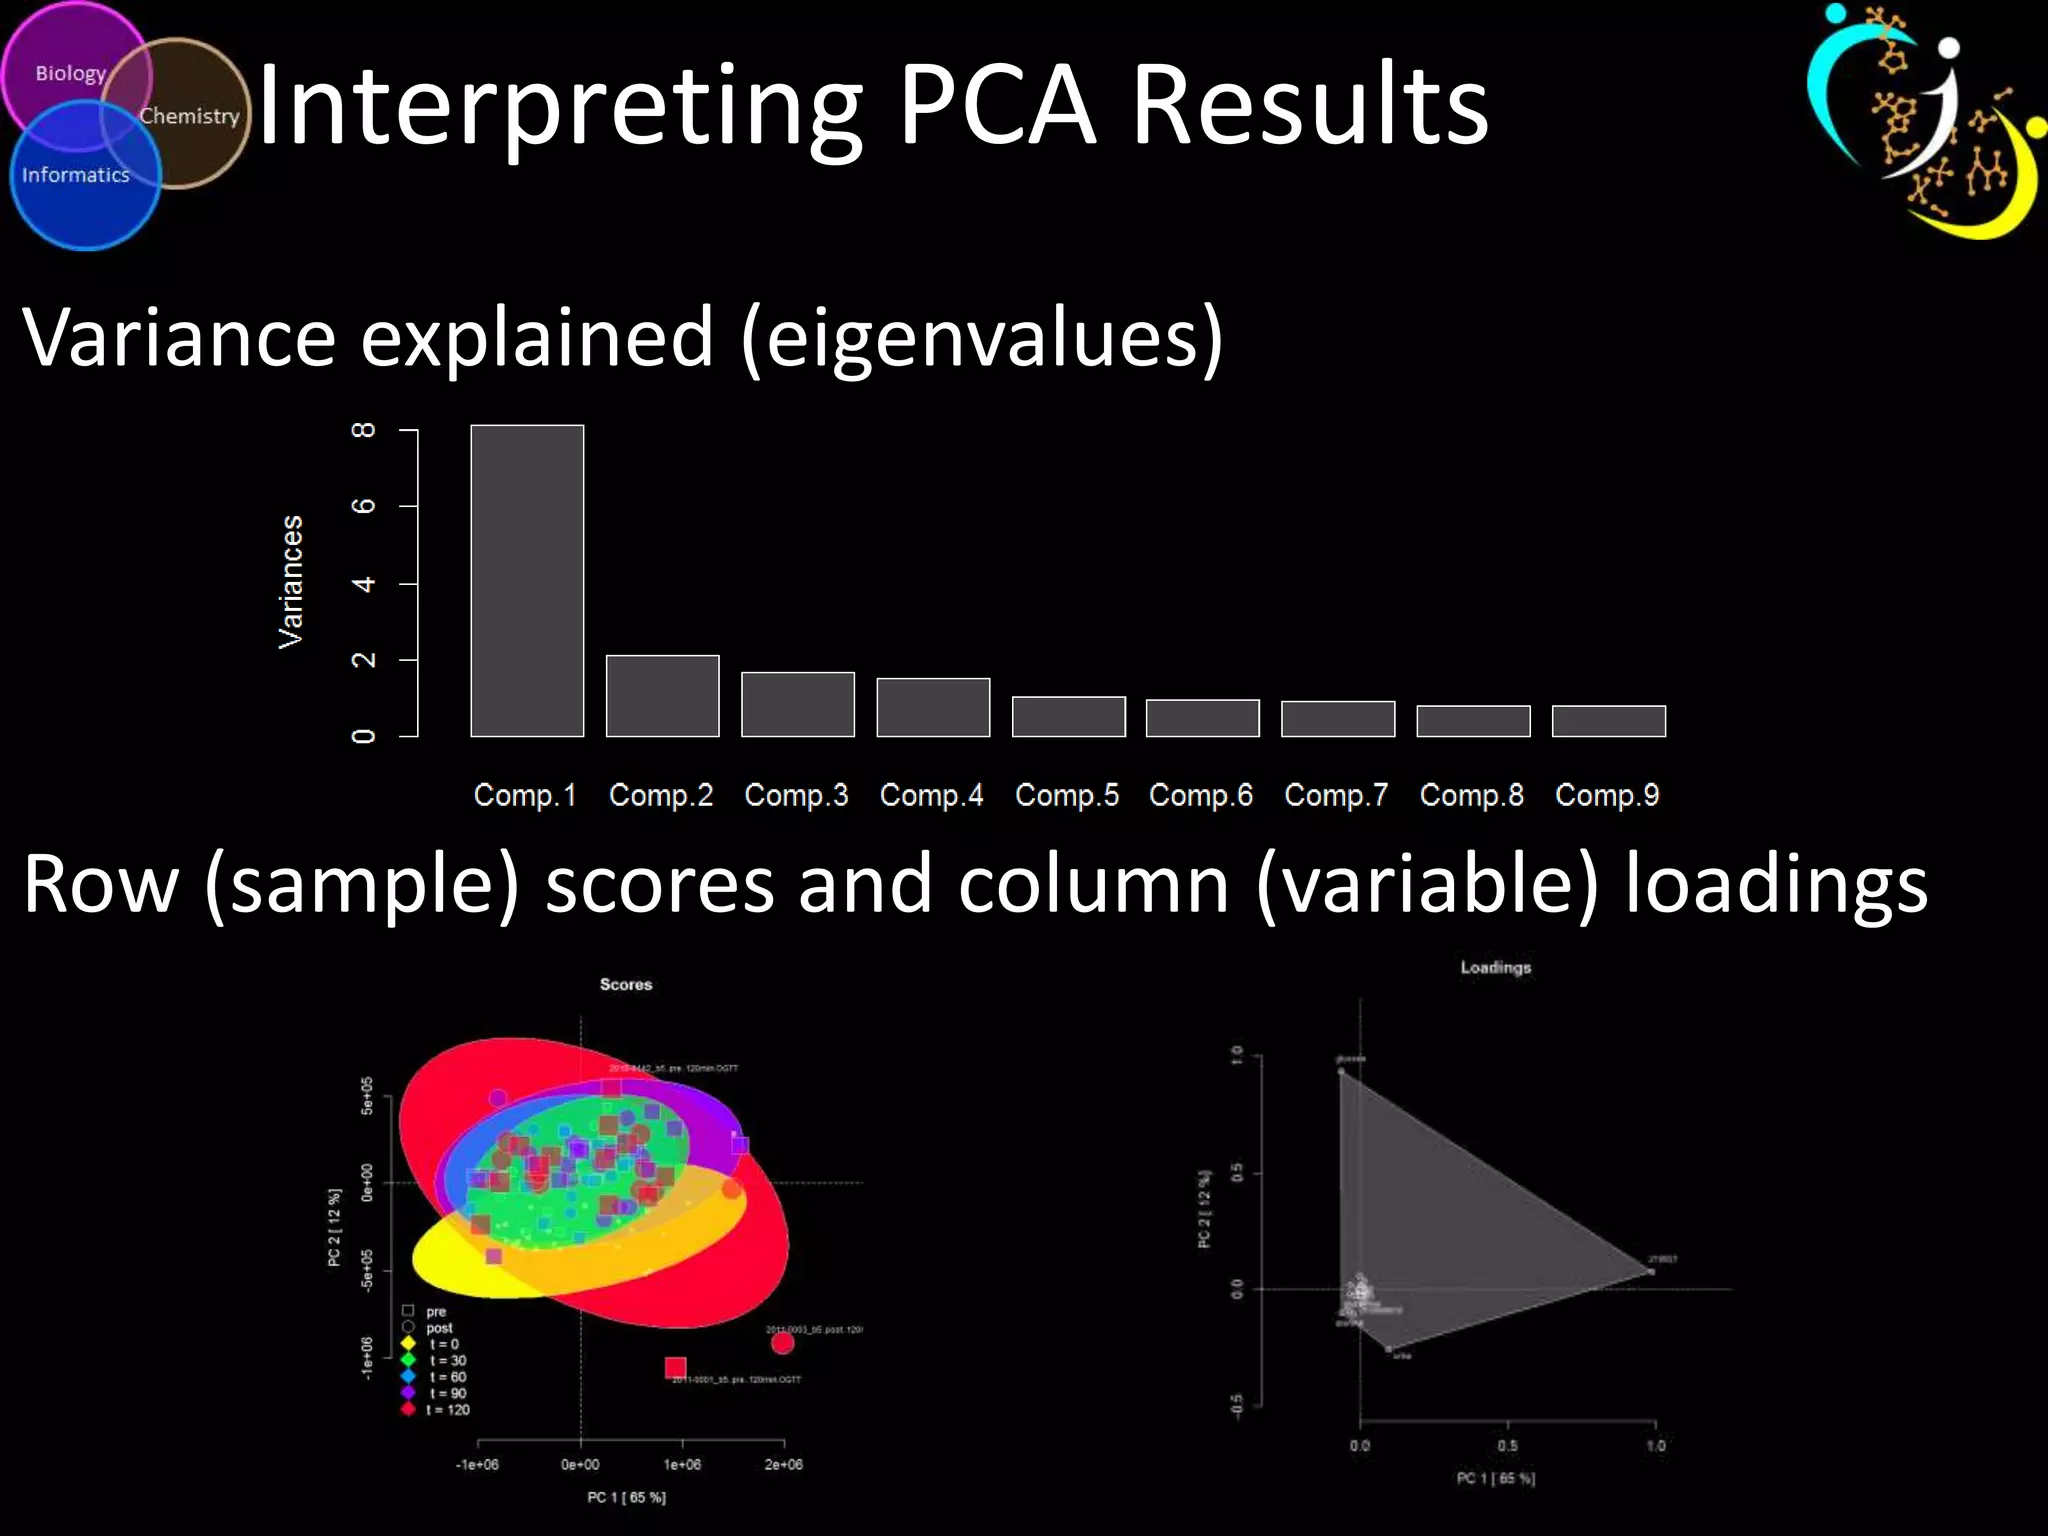
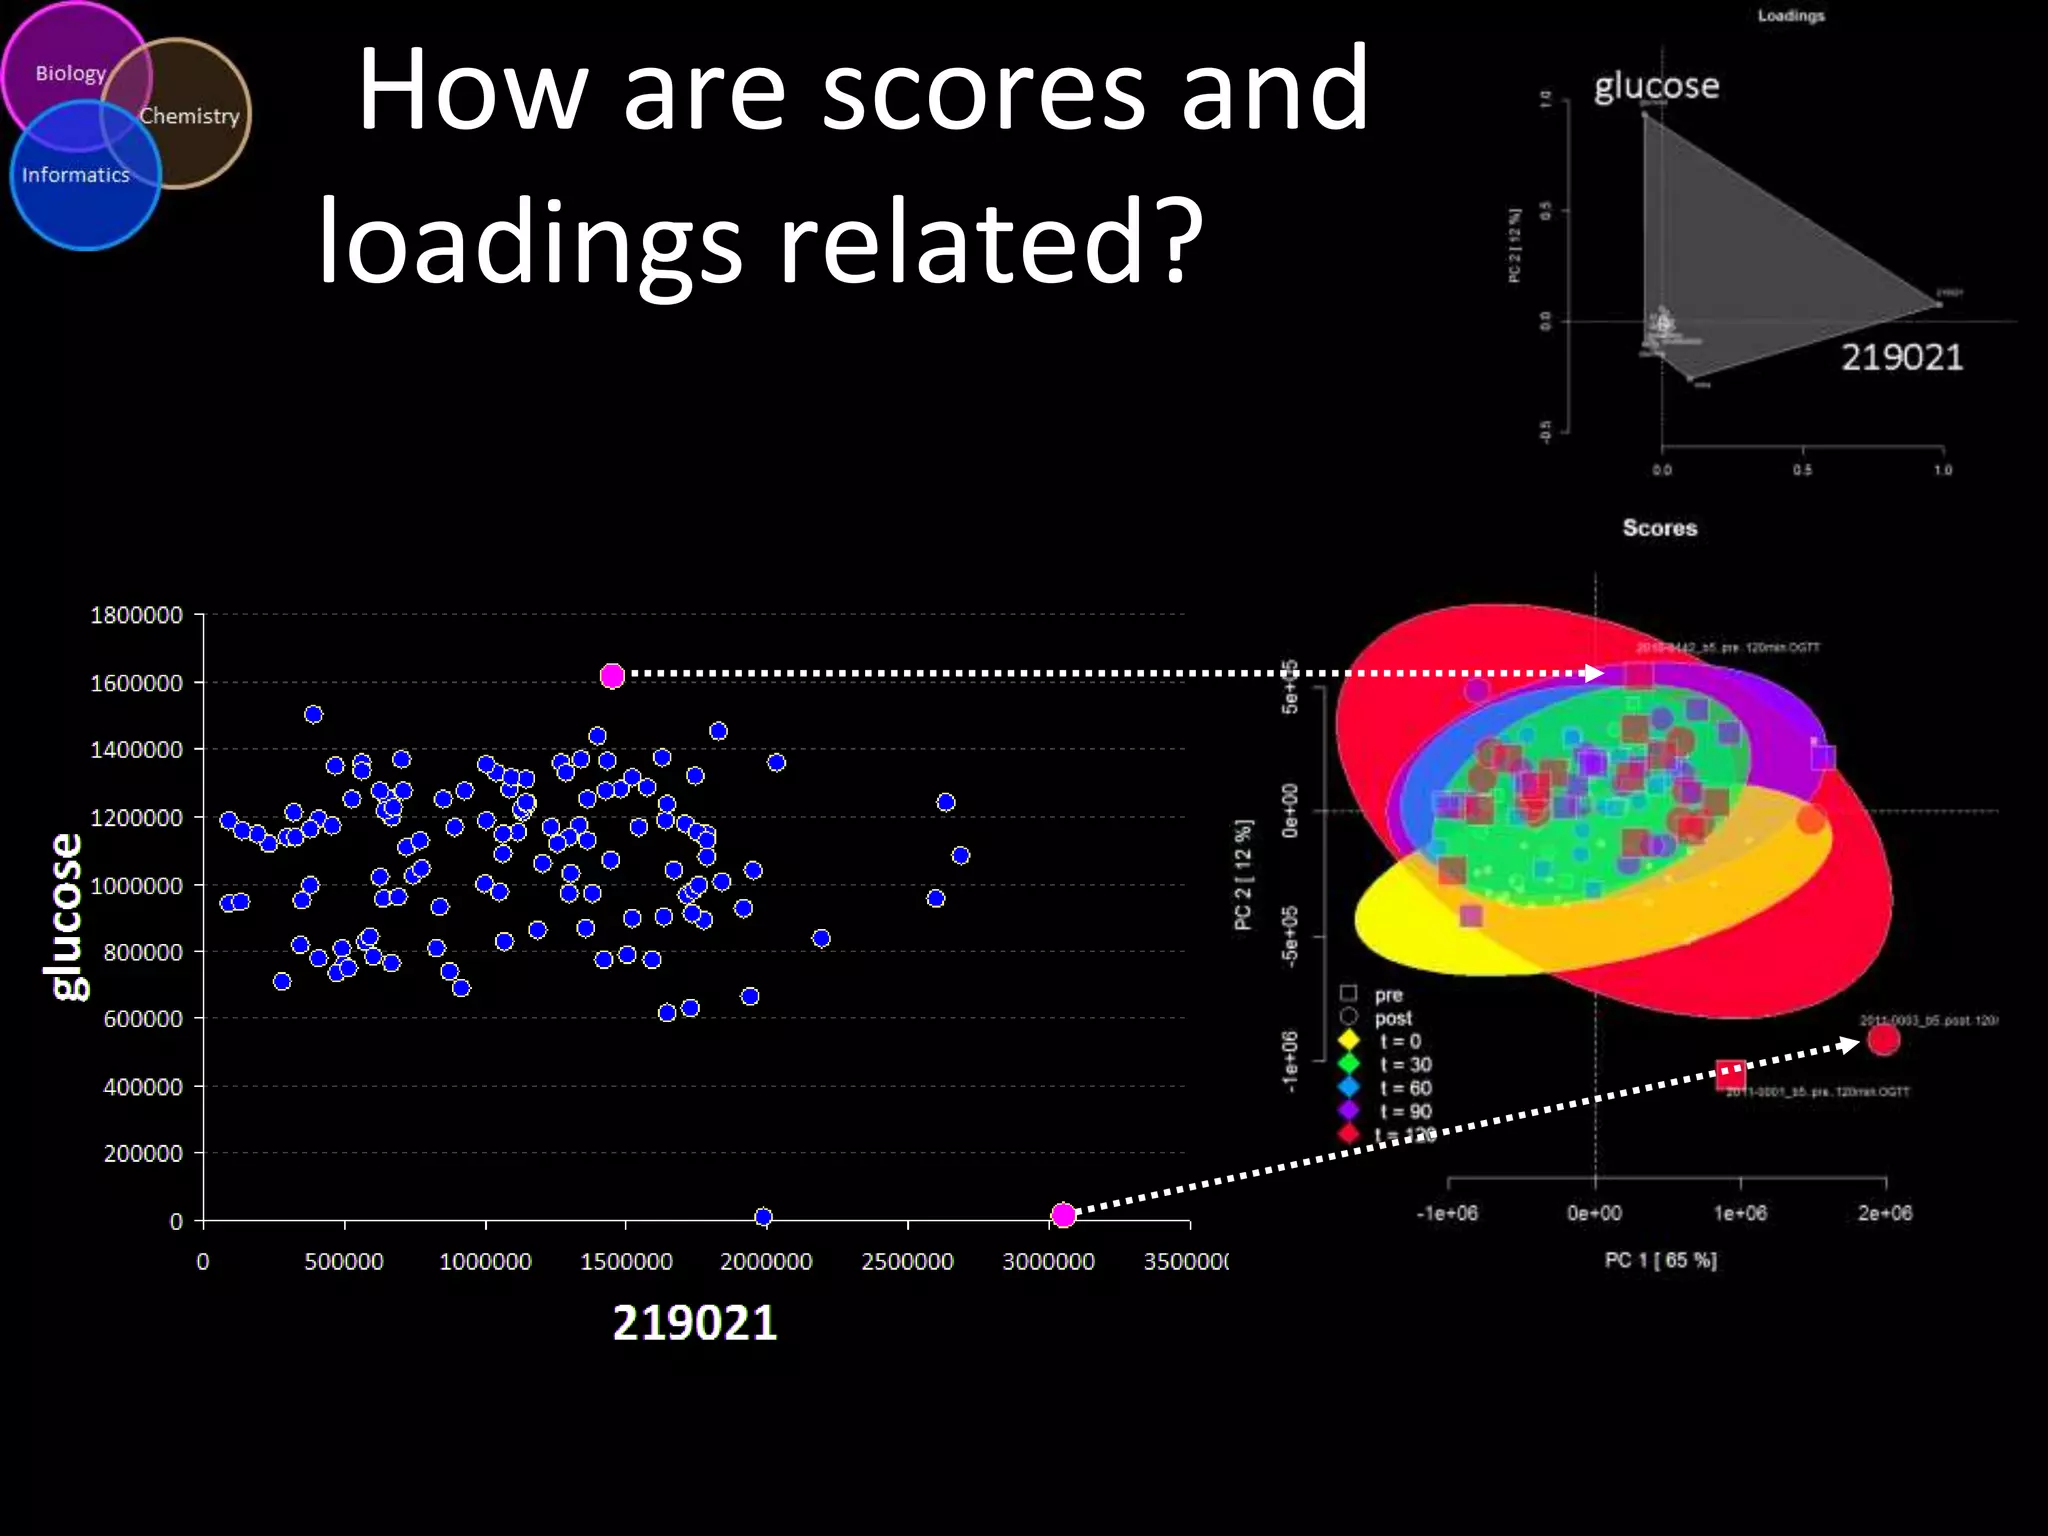
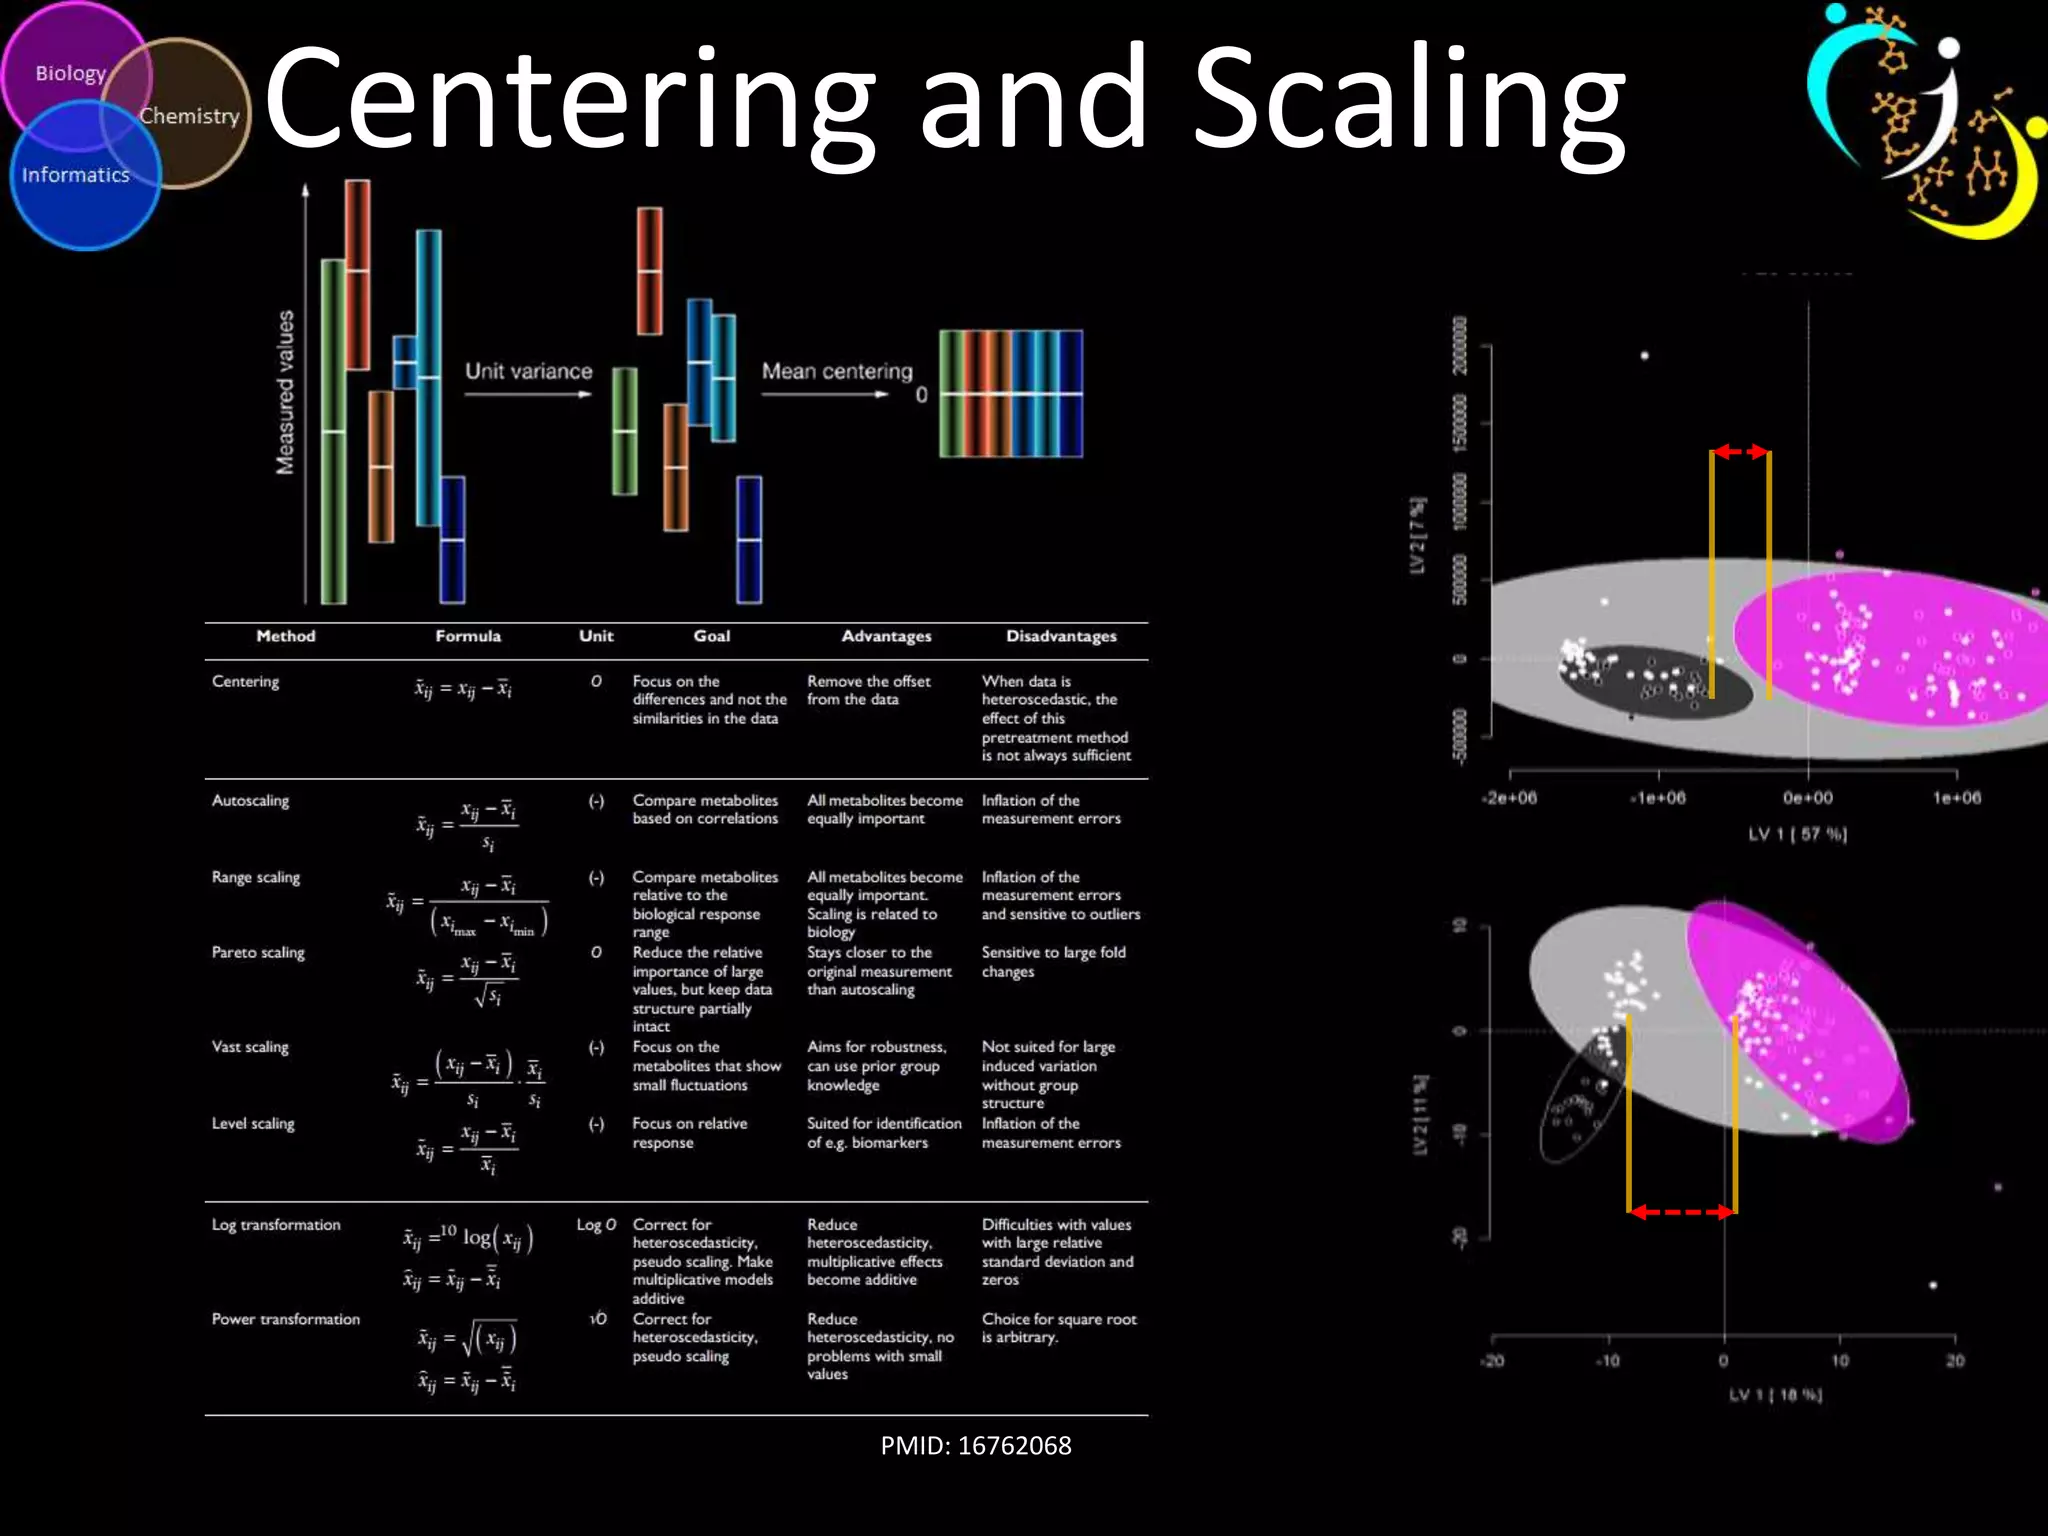
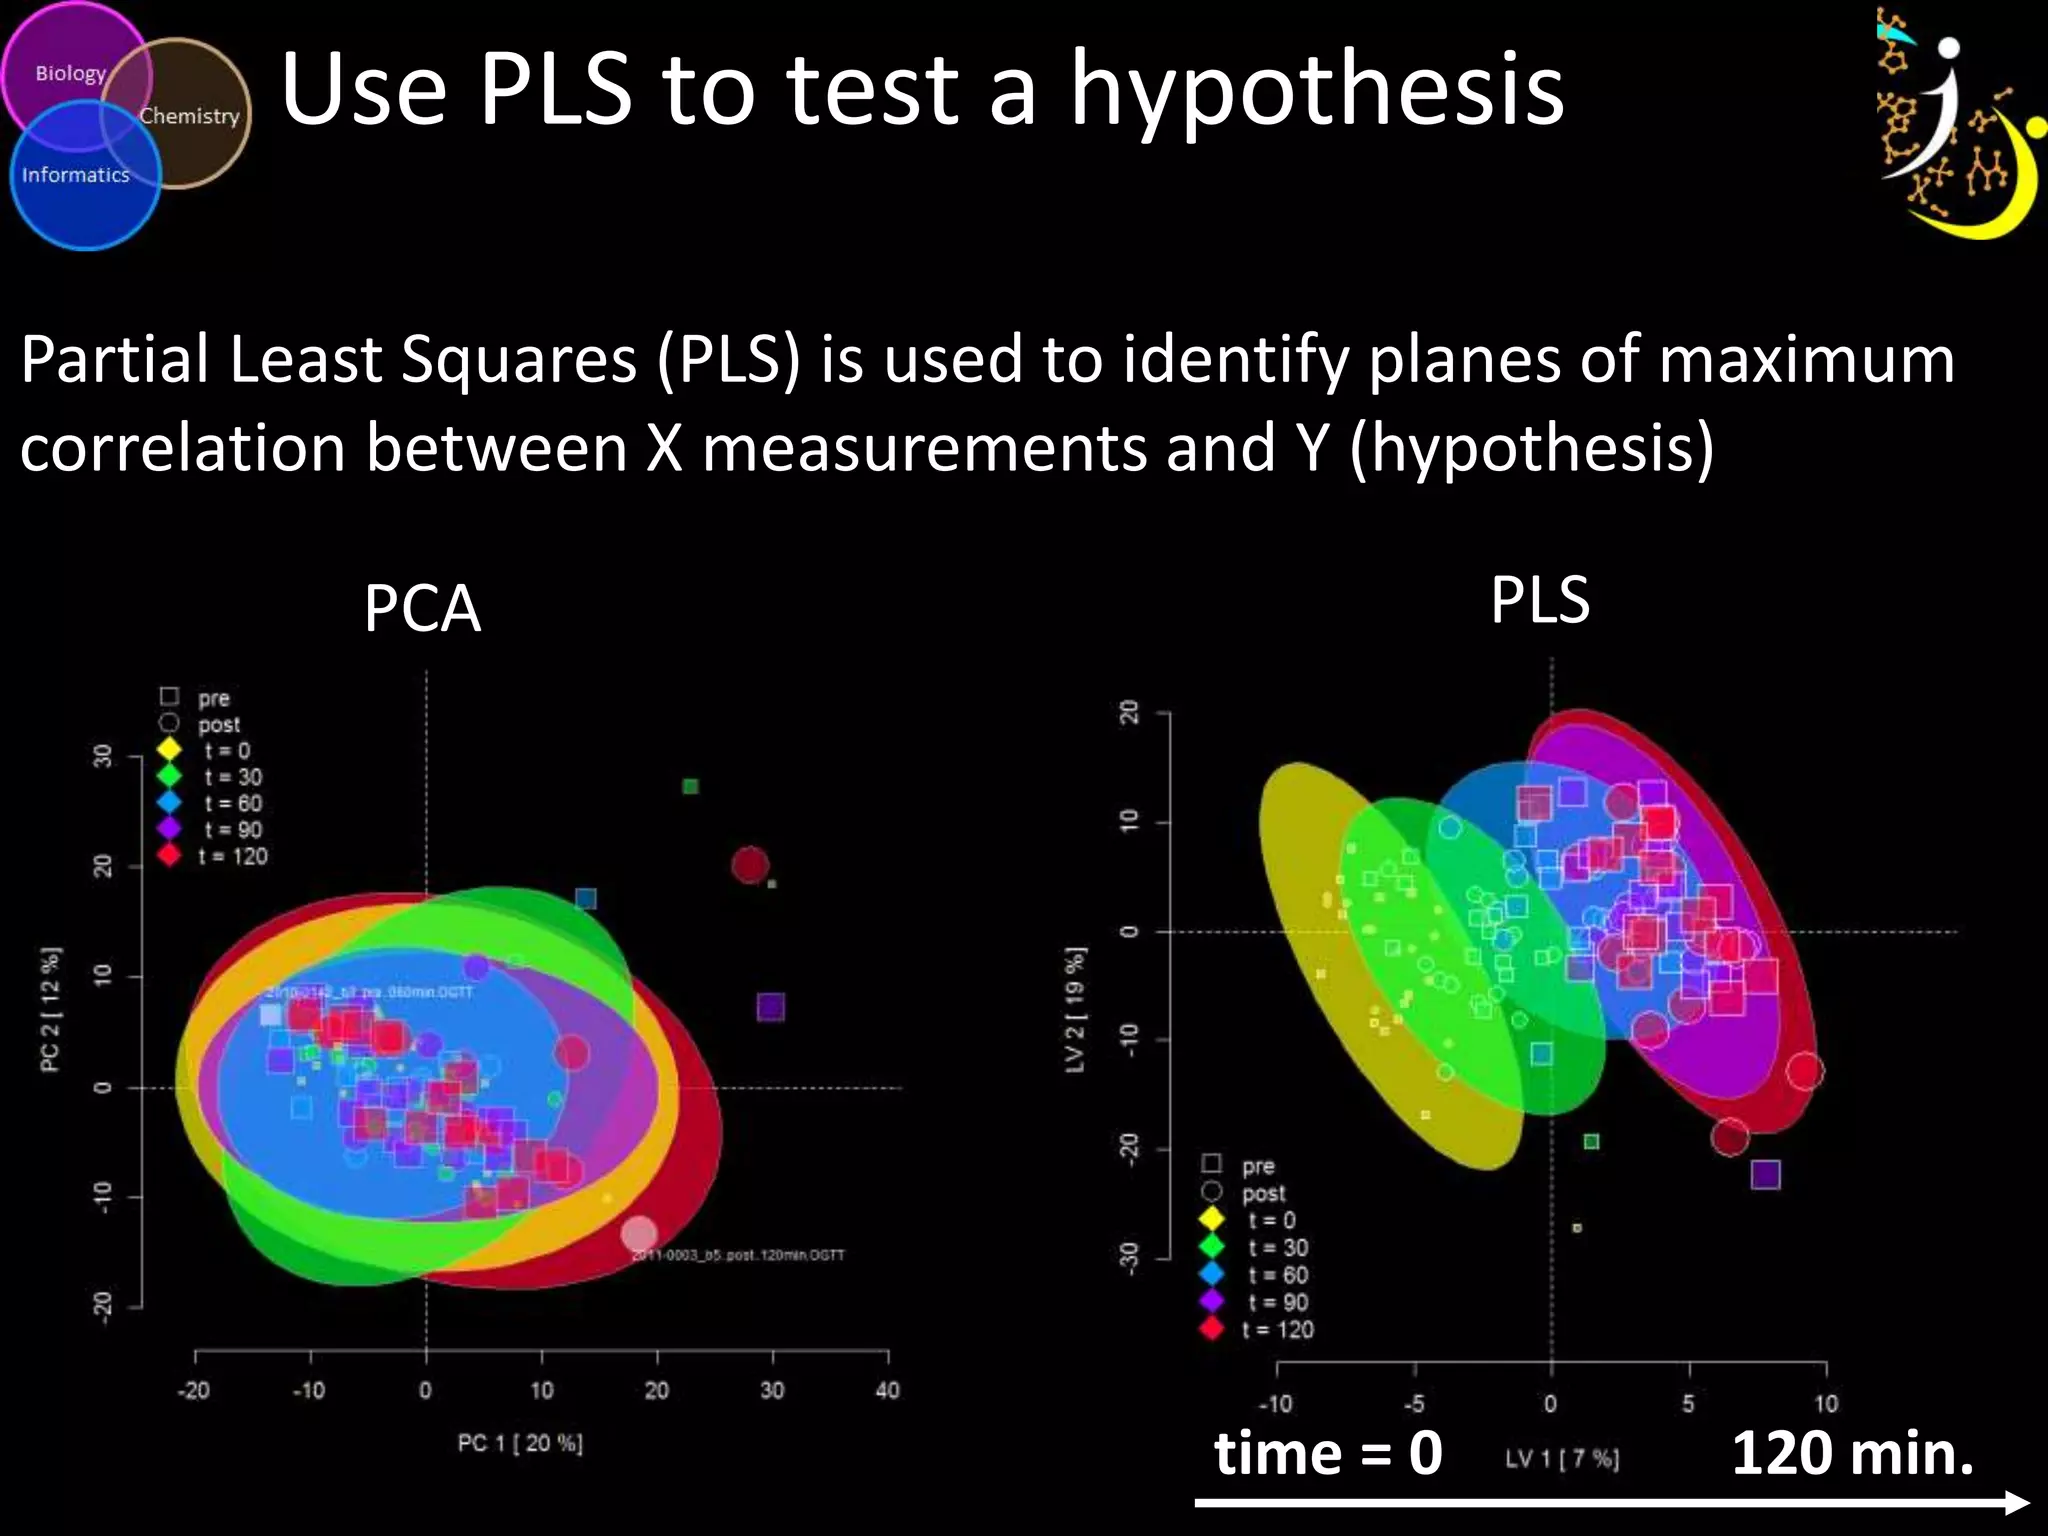
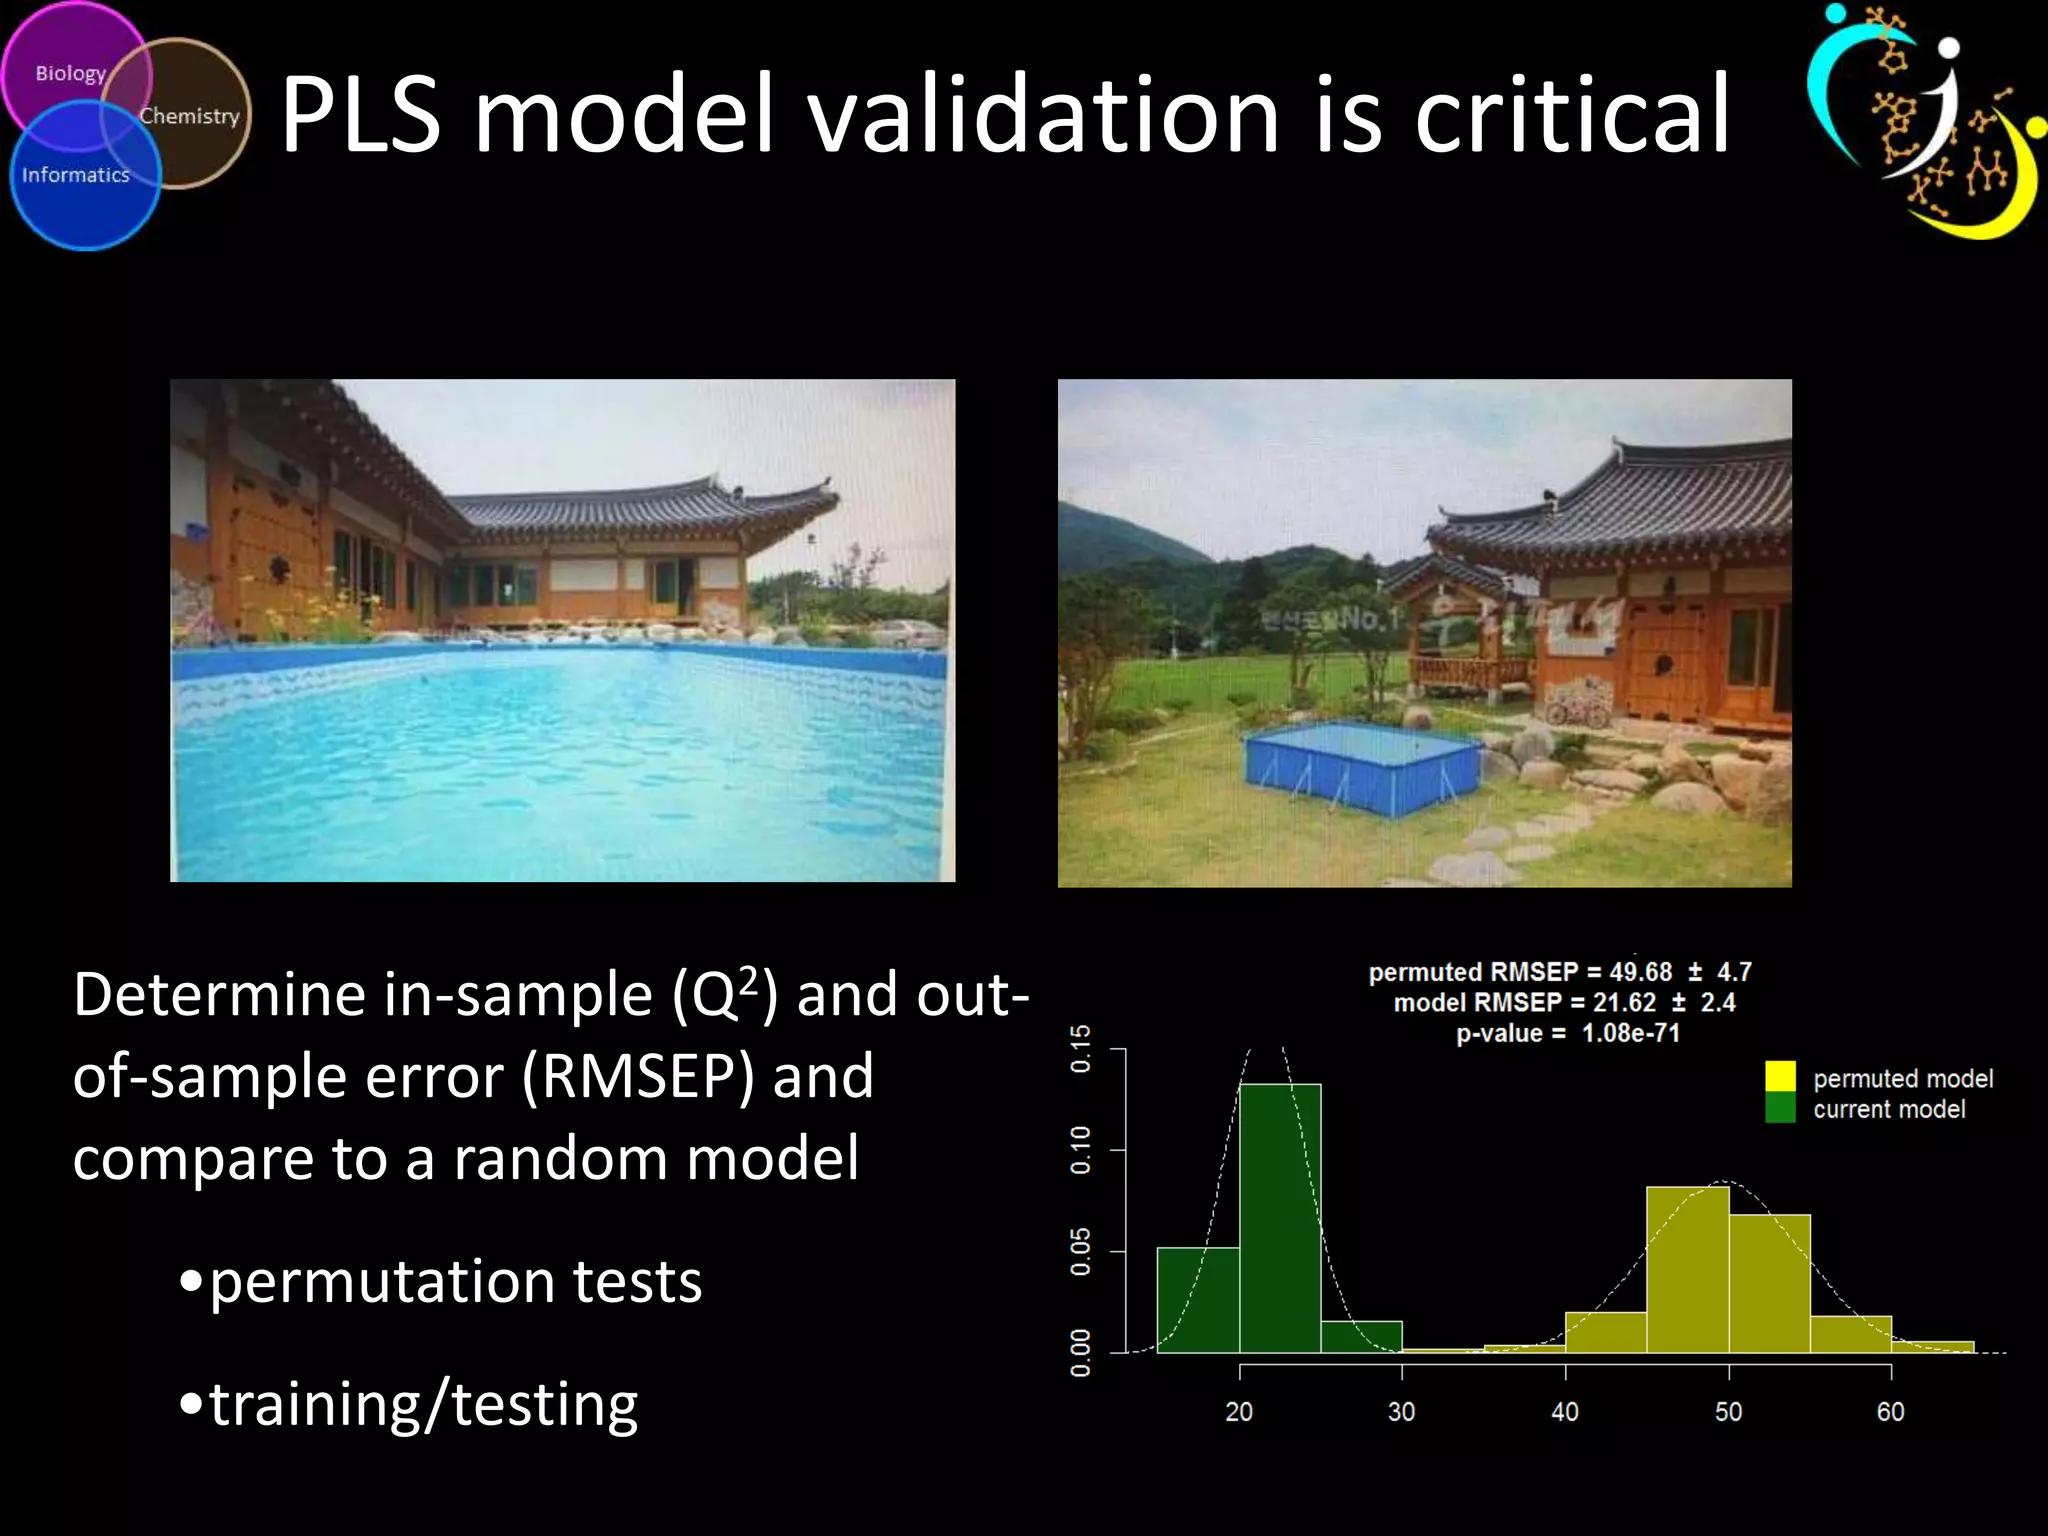
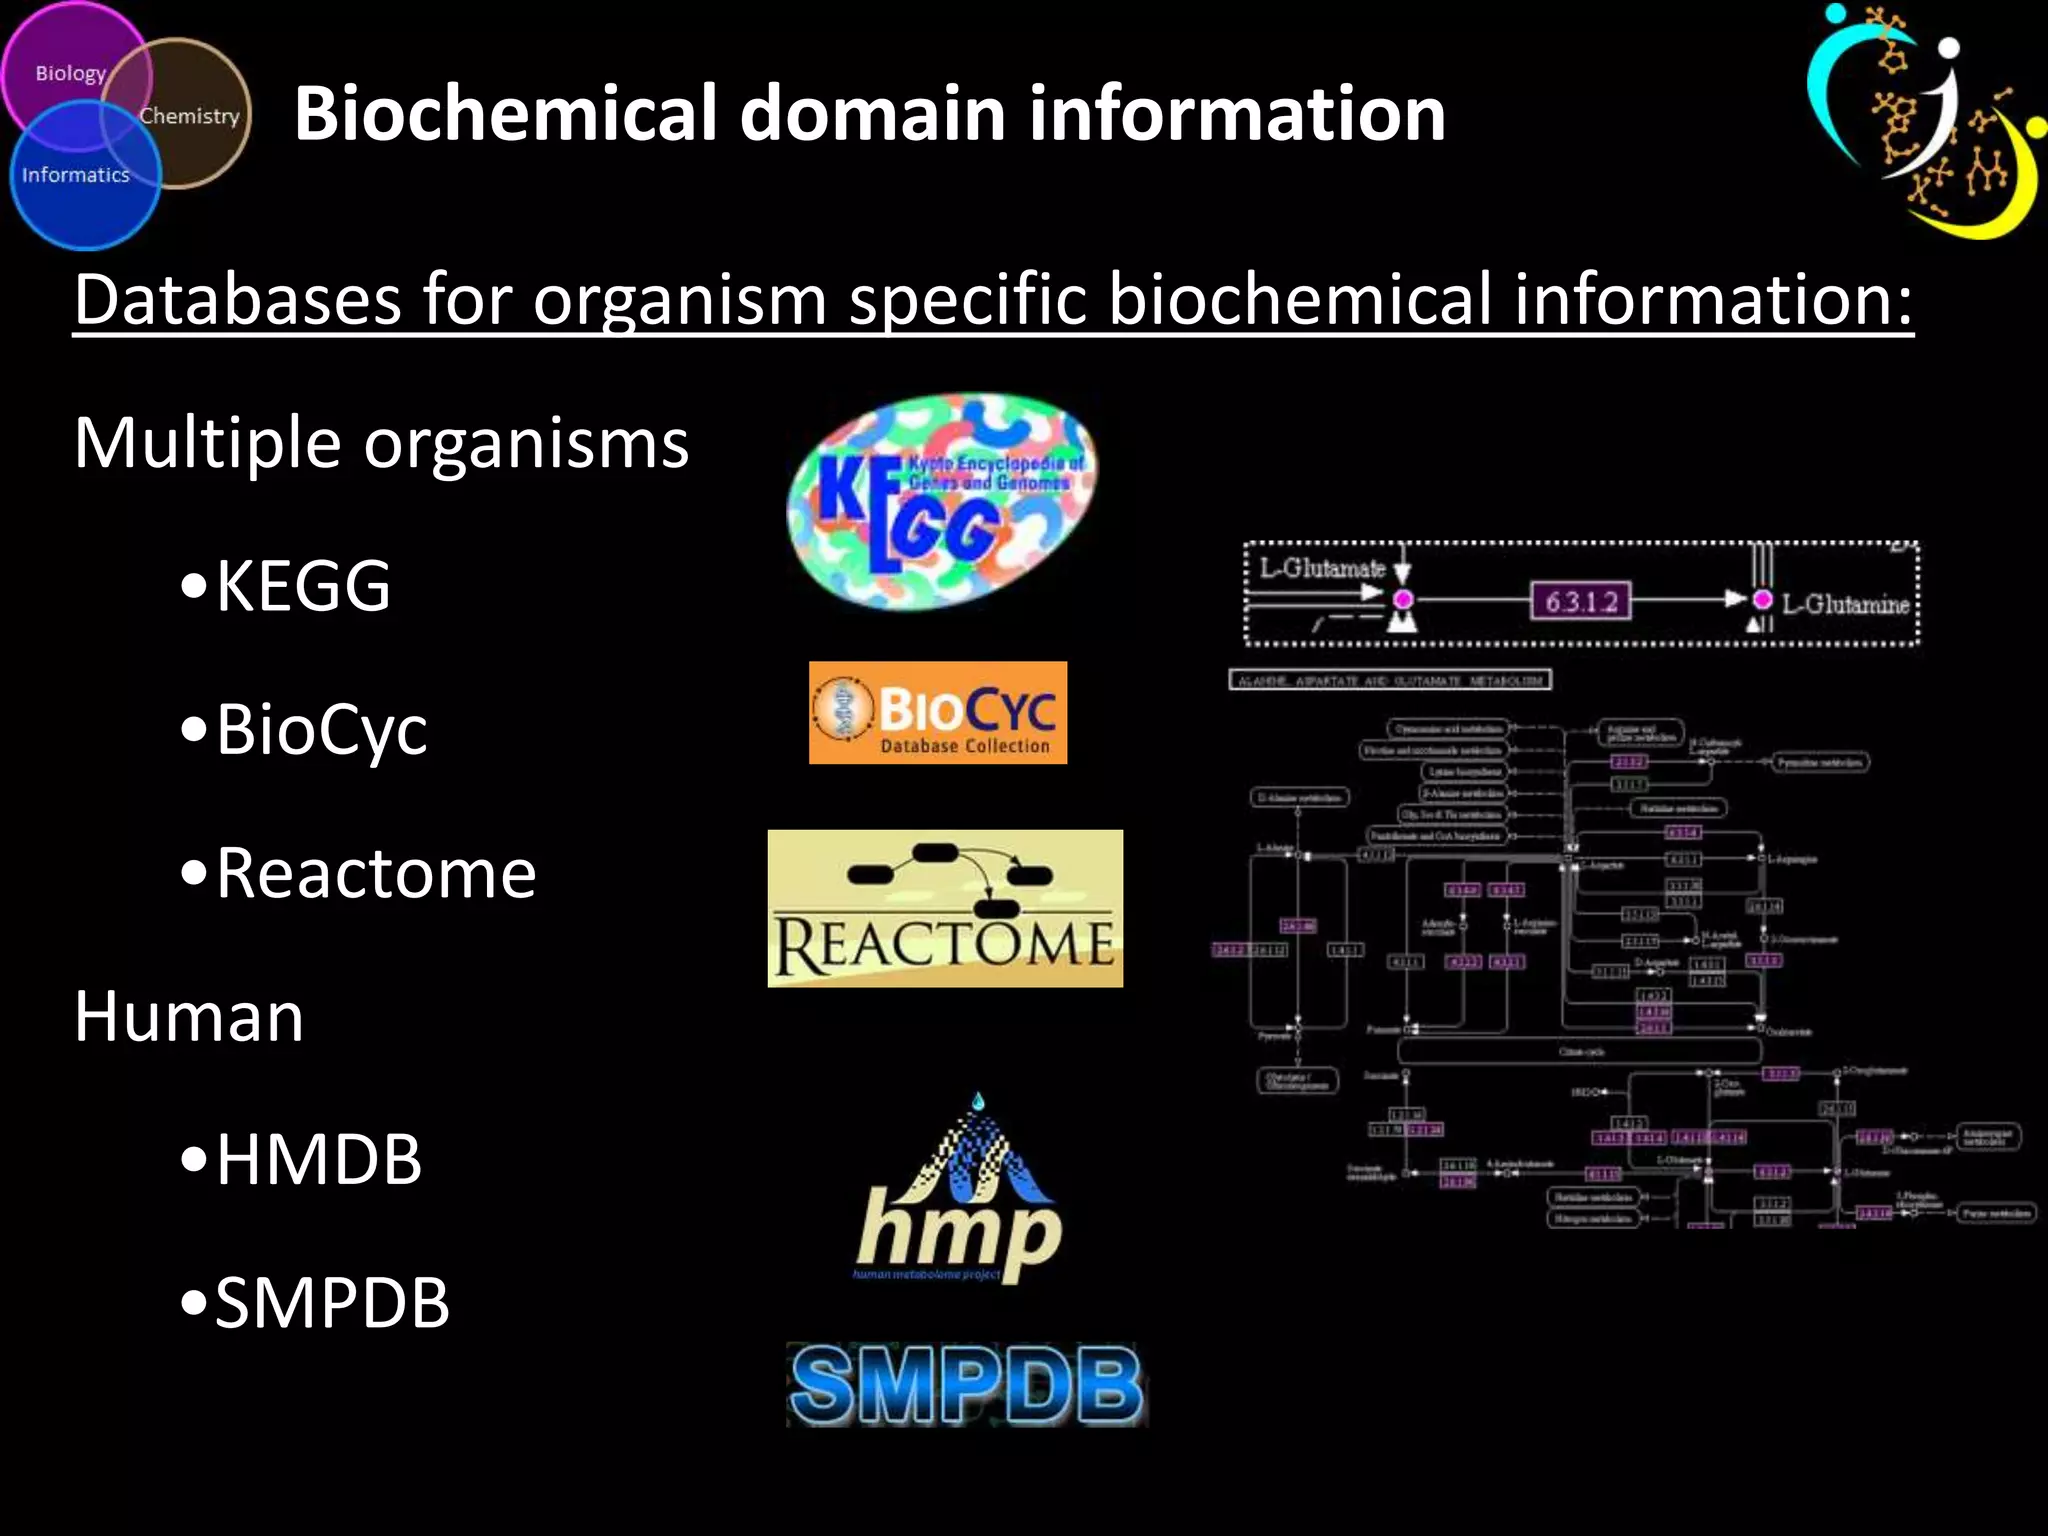
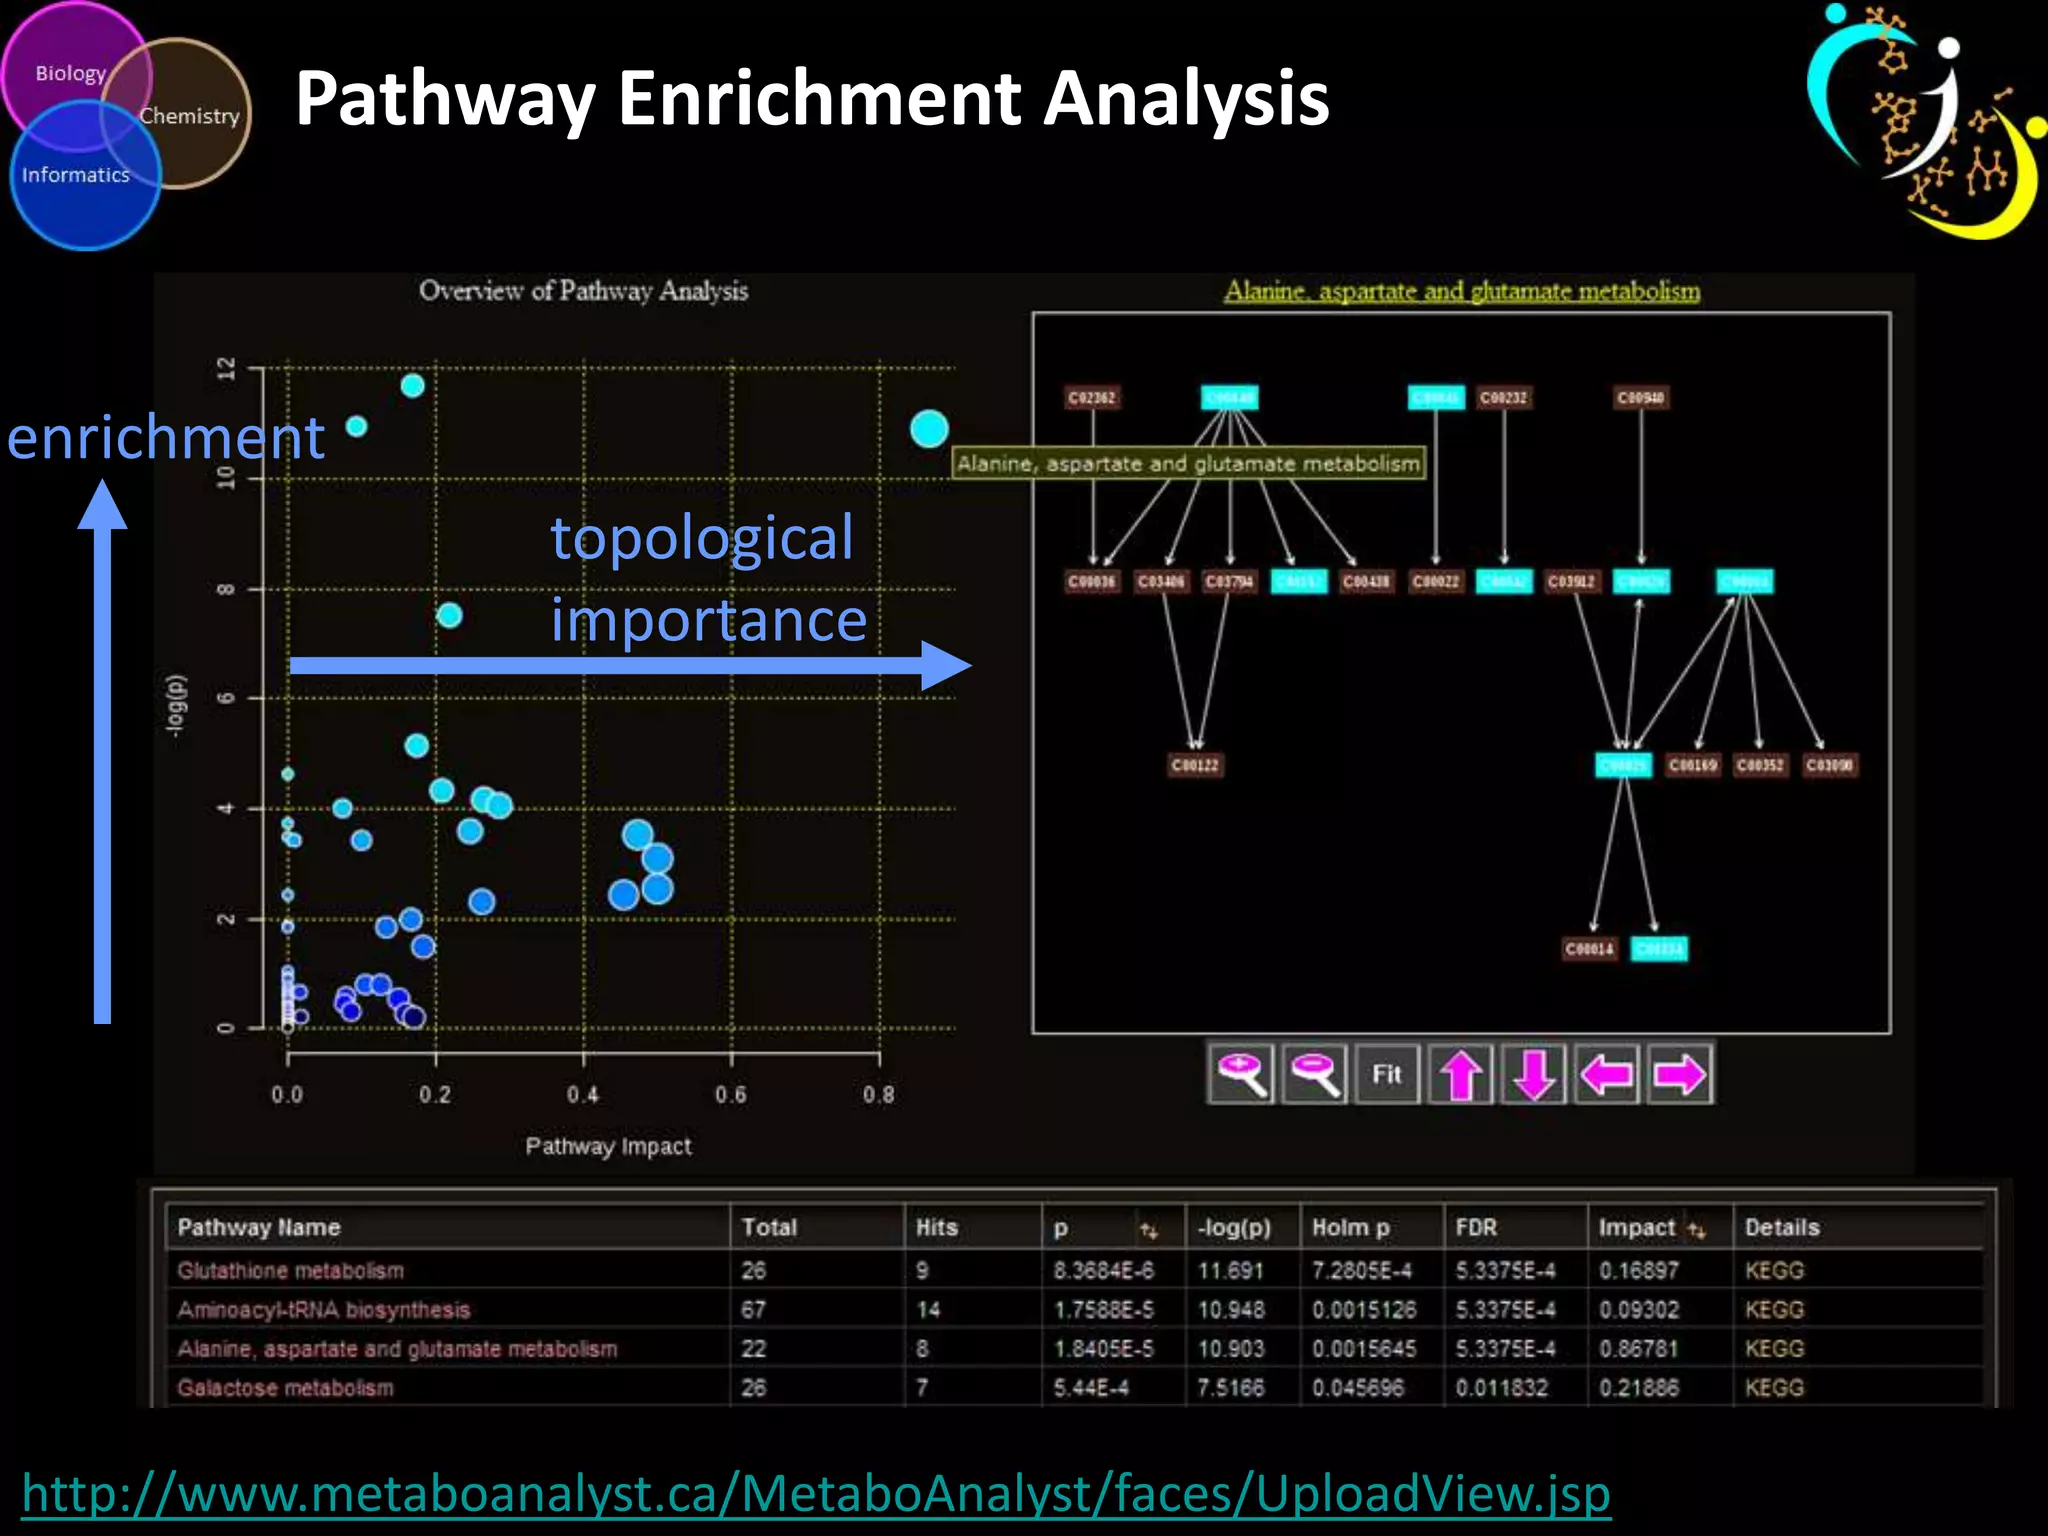
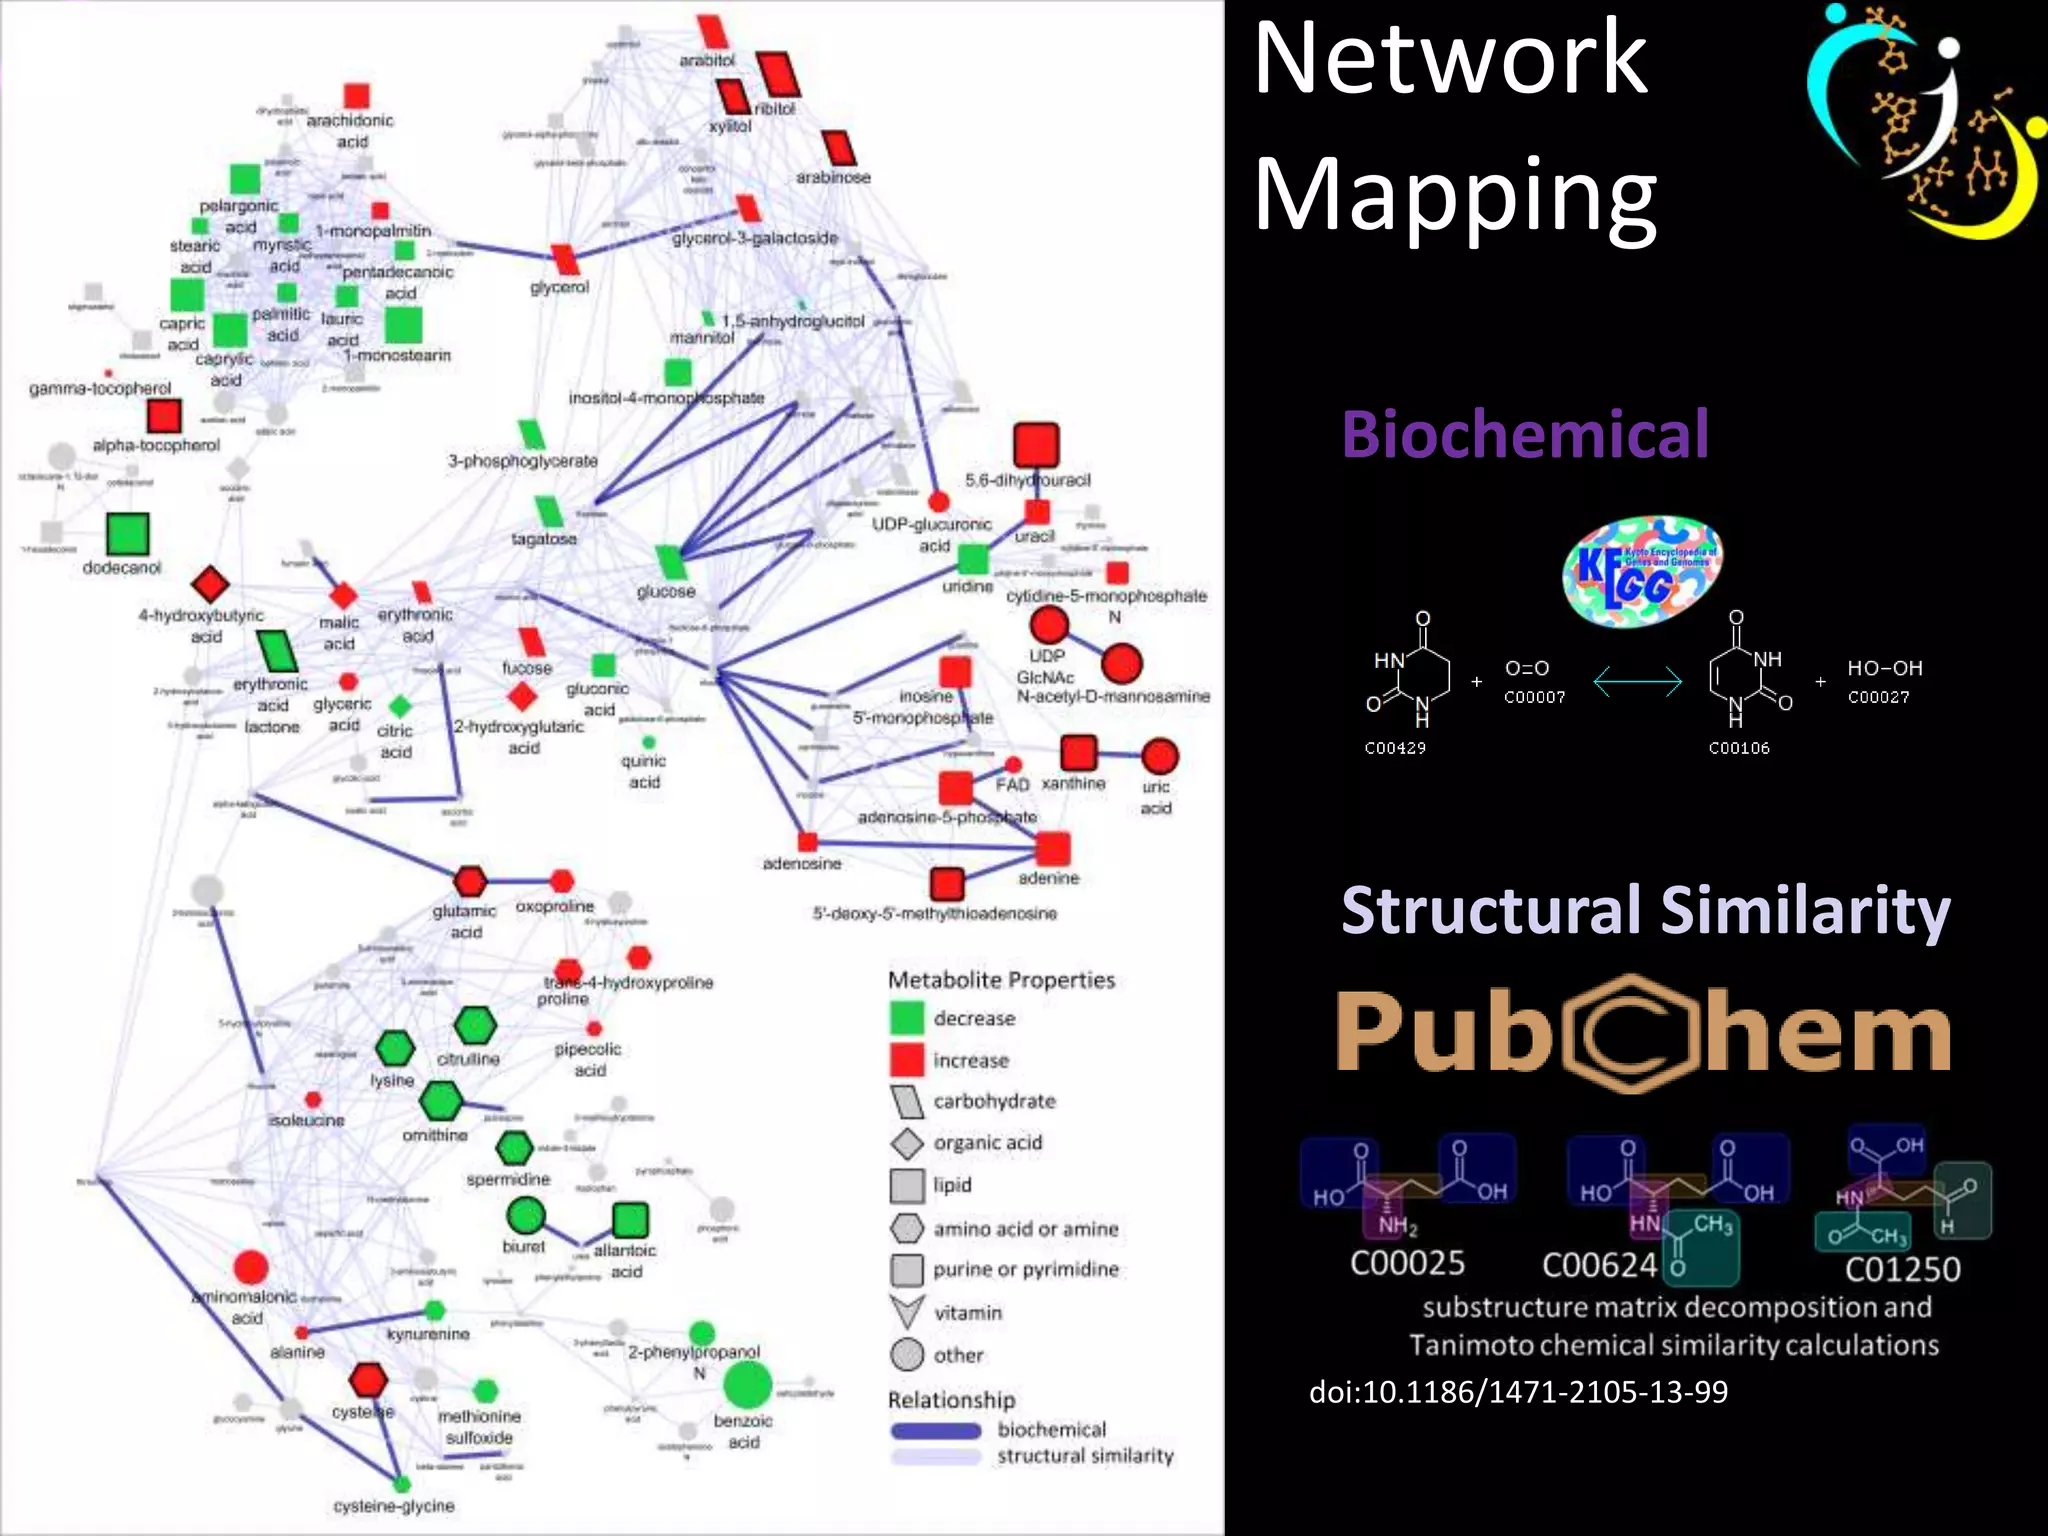
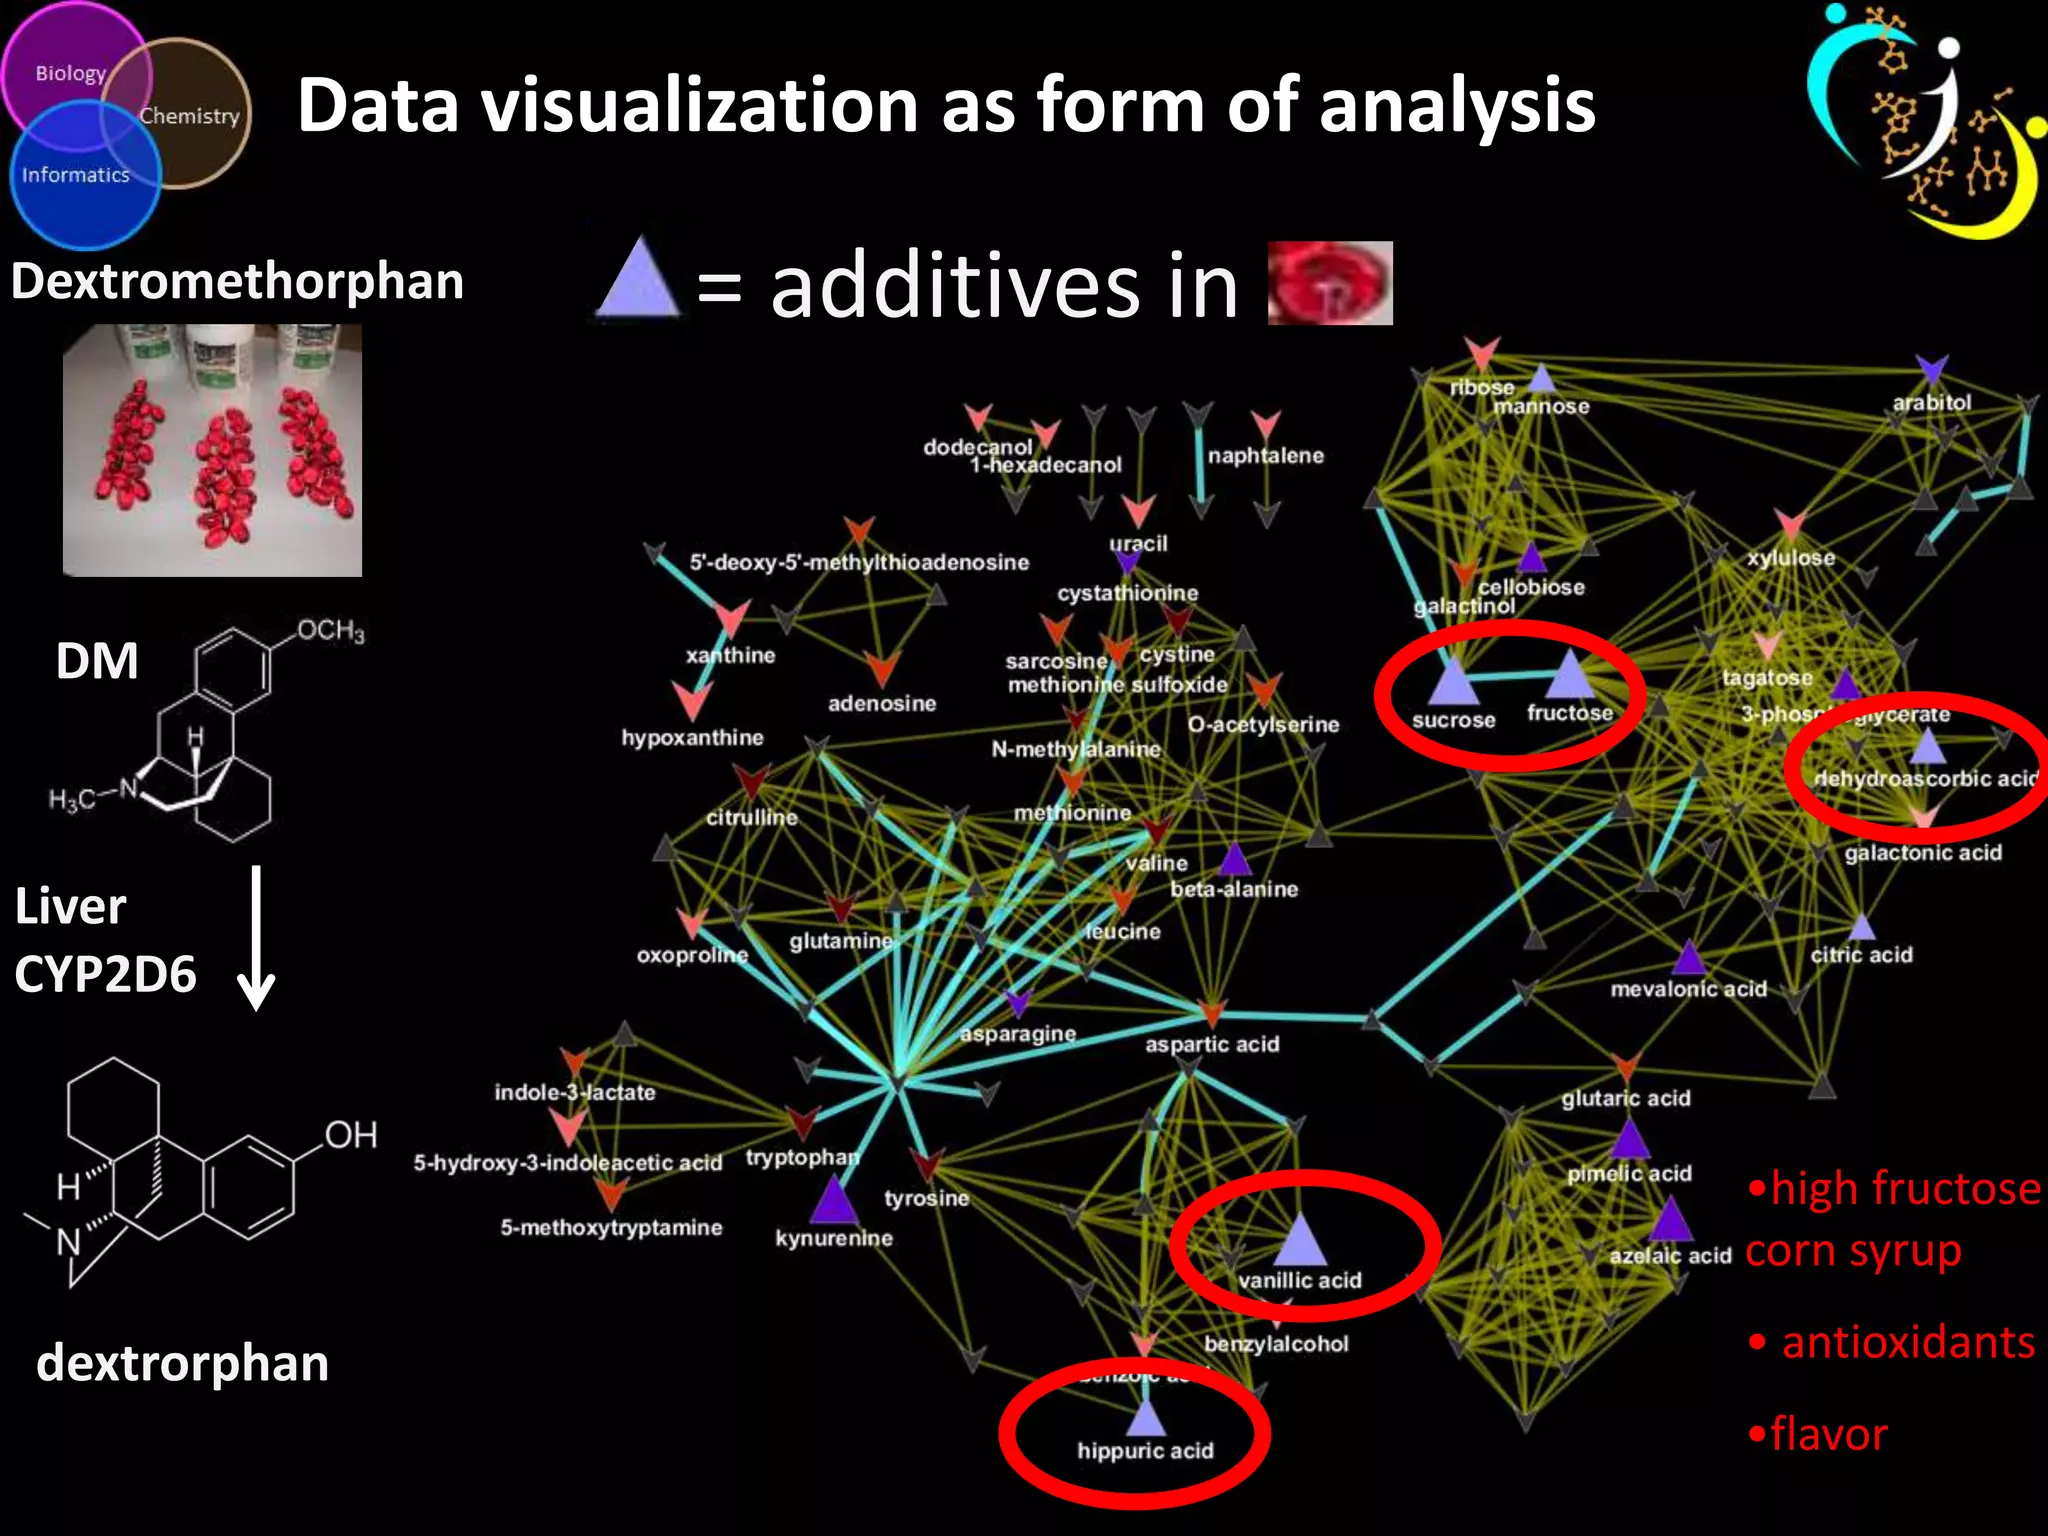
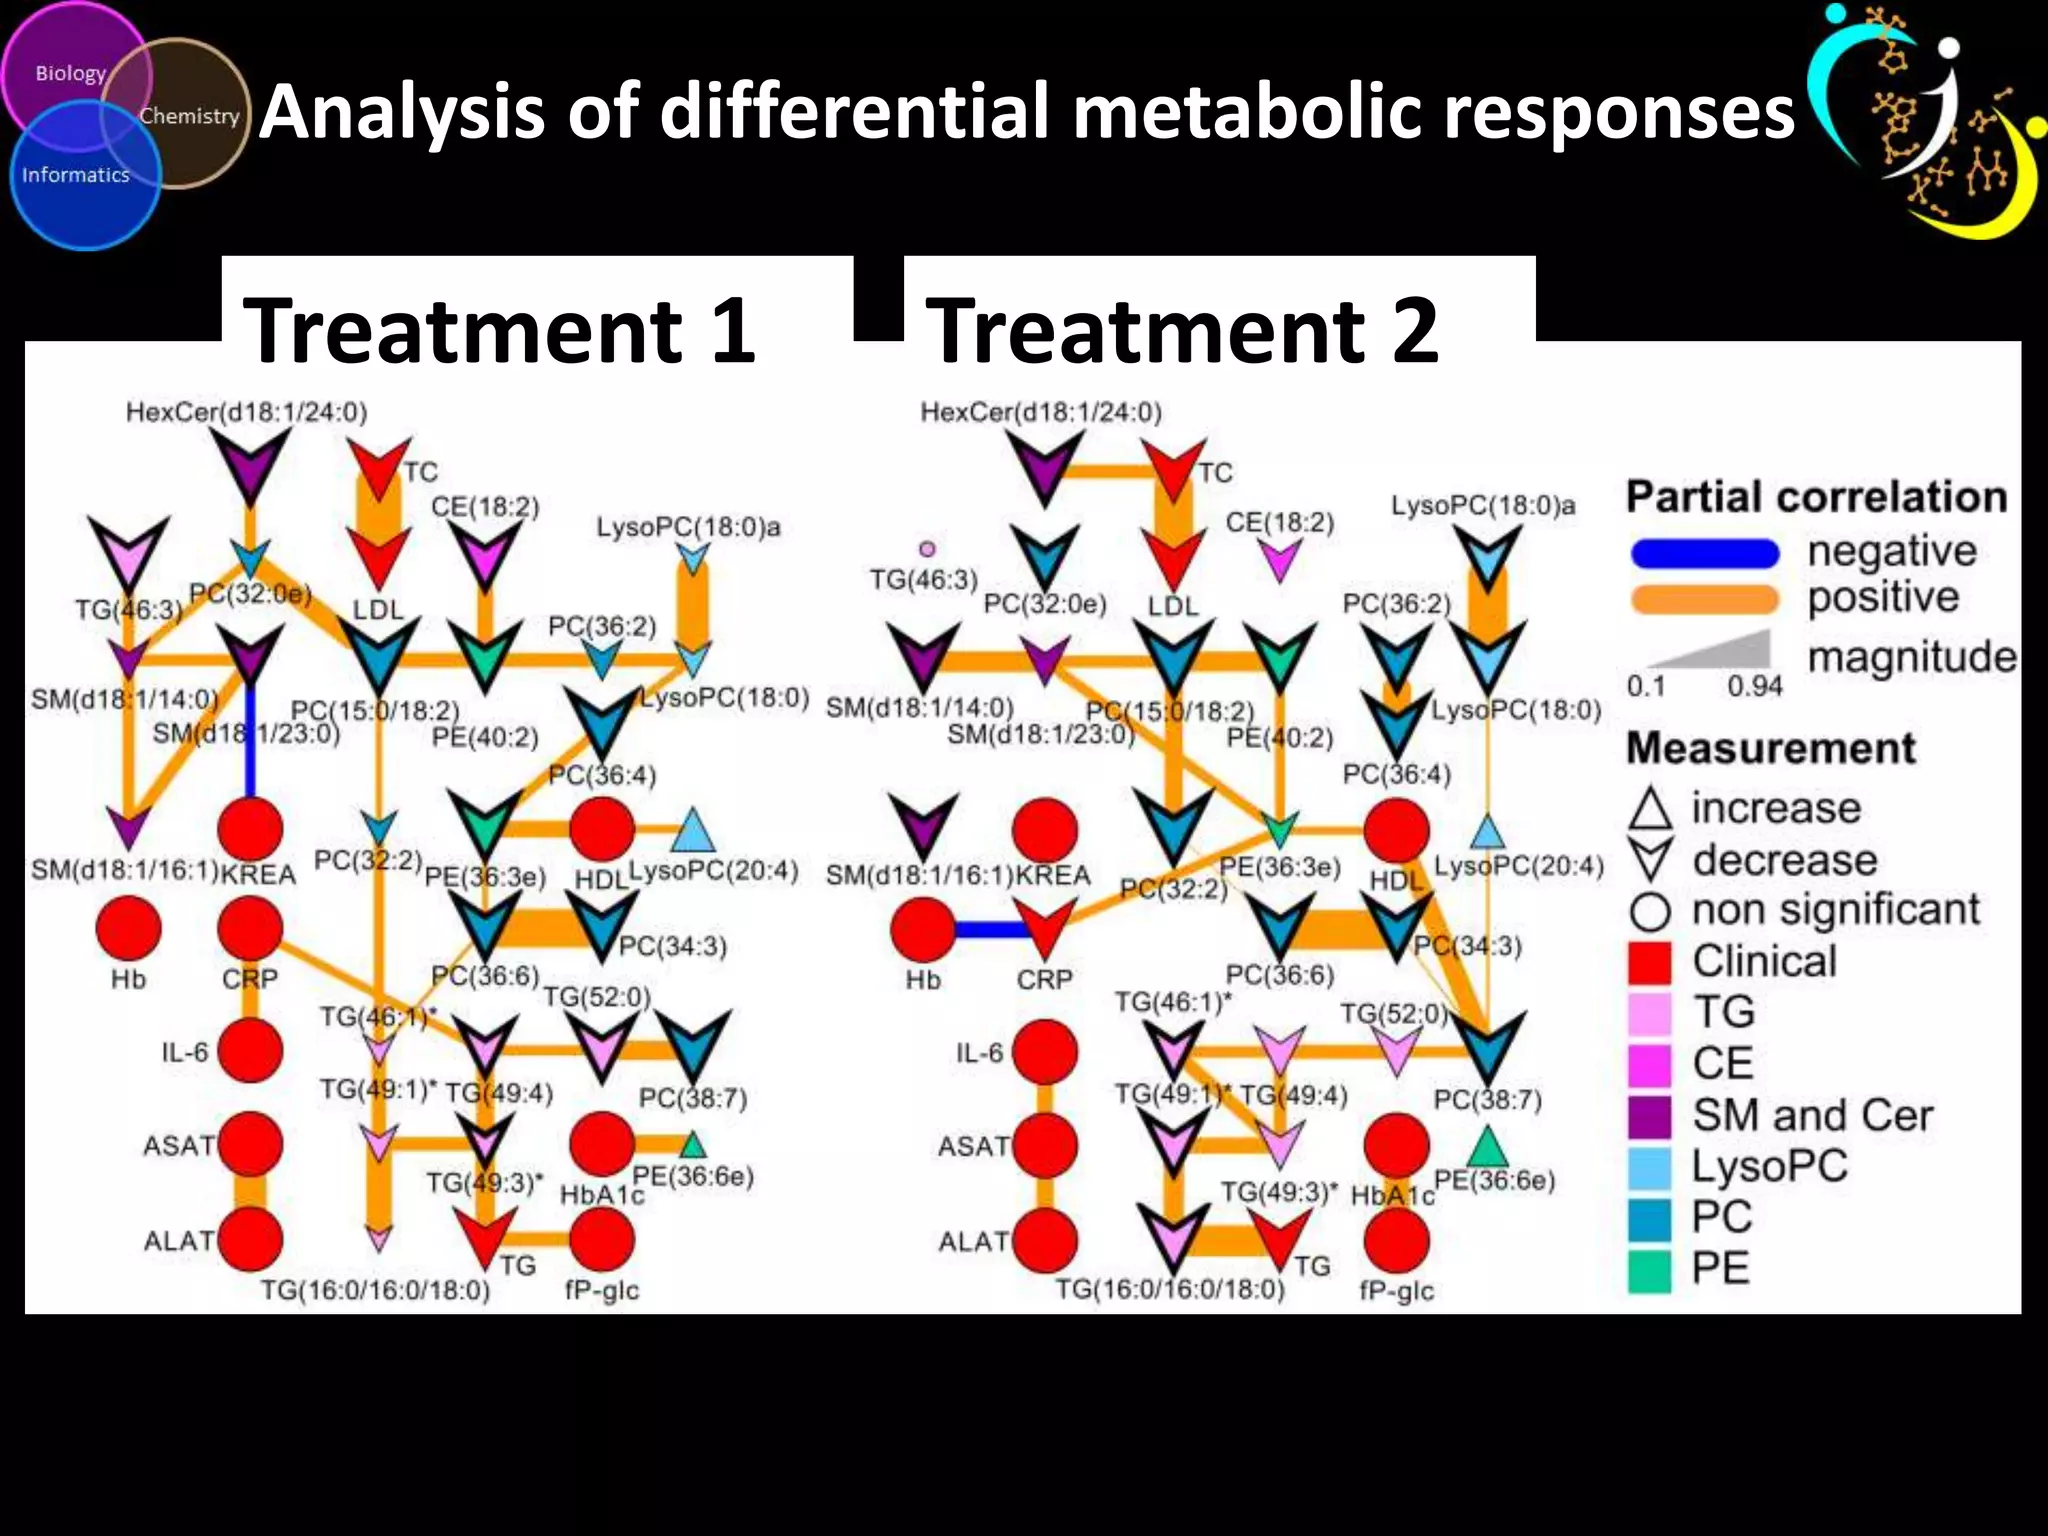
This document discusses metabolomic data analysis techniques for studying diseases. It analyzes over 13,000 biological samples per year using over 160,000 data points per study. Univariate and multivariate statistical analyses are described, with multivariate being preferred. Techniques include principal component analysis, partial least squares discriminant analysis, hierarchical clustering analysis, and pathway enrichment analysis. Visualization and network mapping tools are also discussed to identify relationships between altered metabolites and treatment effects.
Metabolomic Data Analysis Workshop and Tutorials (2014)Dmitry Grapov
Get more information:
http://imdevsoftware.wordpress.com/2014/10/11/2014-metabolomic-data-analysis-and-visualization-workshop-and-tutorials/
Recently I had the pleasure of teaching statistical and multivariate data analysis and visualization at the annual Summer Sessions in Metabolomics 2014, organized by the NIH West Coast Metabolomics Center.
Similar to last year, I’ve posted all the content (lectures, labs and software) for any one to follow along with at their own pace. I also plan to release videos for all the lectures and labs.
Data Normalization Approaches for Large-scale Biological StudiesDmitry Grapov
Overview of how to estimate data quality and validate normalization approaches to remove analytical variance.
See here for animations used in the presentation:
http://imdevsoftware.wordpress.com/2014/06/04/using-repeated-measures-to-remove-artifacts-from-longitudinal-data/
Part of a lectures series for the international summer course in metabolomics 2013 (http://metabolomics.ucdavis.edu/courses-and-seminars/courses). Get more material and information here (http://imdevsoftware.wordpress.com/2013/09/08/sessions-in-metabolomics-2013/).
Advanced strategies for Metabolomics Data AnalysisDmitry Grapov
Part of a lectures series for the international summer course in metabolomics 2013 (http://metabolomics.ucdavis.edu/courses-and-seminars/courses). Get more material and information here (http://imdevsoftware.wordpress.com/2013/09/08/sessions-in-metabolomics-2013/).
Strategies for Metabolomics Data AnalysisDmitry Grapov
Part of a lectures series for the international summer course in metabolomics 2013 (http://metabolomics.ucdavis.edu/courses-and-seminars/courses). Get more material and information here (http://imdevsoftware.wordpress.com/2013/09/08/sessions-in-metabolomics-2013/).
Automation of (Biological) Data Analysis and Report GenerationDmitry Grapov
I've been experimenting with automating simple and complex data analysis and report generation tasks for biological data and mostly using R and LATEX. You can see some of my progress and challenges encountered.
Metabolomic data analysis and visualization toolsDmitry Grapov
A description of data analysis and visualization tools for metabolomic and other high dimensional data sets, developed at the NIH West Coast Metabolomics Center.
Case Study: Overview of Metabolomic Data Normalization StrategiesDmitry Grapov
Five normalization methods were compared, of which the combination of qc-LOESS and cubic splines showed the best performance based on within-batch and between-batch variable relative standard deviations for QCs. This approach was used to normalize sample measurements the results of which were analyzed using principal components analysis.
3 data normalization (2014 lab tutorial)Dmitry Grapov
Get more information:
http://imdevsoftware.wordpress.com/2014/10/11/2014-metabolomic-data-analysis-and-visualization-workshop-and-tutorials/
Recently I had the pleasure of teaching statistical and multivariate data analysis and visualization at the annual Summer Sessions in Metabolomics 2014, organized by the NIH West Coast Metabolomics Center.
The International Journal of Engineering and Science (The IJES)theijes
The International Journal of Engineering & Science is aimed at providing a platform for researchers, engineers, scientists, or educators to publish their original research results, to exchange new ideas, to disseminate information in innovative designs, engineering experiences and technological skills. It is also the Journal's objective to promote engineering and technology education. All papers submitted to the Journal will be blind peer-reviewed. Only original articles will be published.
Prote-OMIC Data Analysis and VisualizationDmitry Grapov
Introductory lecture to multivariate analysis of proteomic data.
Material from the UC Davis 2014 Proteomics Workshop.
See more at: http://sourceforge.net/projects/teachingdemos/files/2014%20UC%20Davis%20Proteomics%20Workshop/
Vahid Taslimitehrani's Dissertation Defense: Friday, February 19 2015.
Ph.D. Committee: Drs. Guozhu Dong, Advisor, T.K. Prasad, Amit Sheth, Keke Chen
and Jyotishman Pathak, Division of Health Informatics, Weill Cornell Medical College, Cornell University.
ABSTRACT:
Regression and classification techniques play an essential role in many data mining tasks and have broad applications. However, most of the state-of-the-art regression and classification techniques are often unable to adequately model the interactions among predictor variables in highly heterogeneous datasets. New techniques that can effectively model such complex and heterogeneous structures are needed to significantly improve prediction accuracy.
In this dissertation, we propose a novel type of accurate and interpretable regression and classification models, named as Pattern Aided Regression (PXR) and Pattern Aided Classification (PXC) respectively. Both PXR and PXC rely on identifying regions in the data space where a given baseline model has large modeling errors, characterizing such regions using patterns, and learning specialized models for those regions. Each PXR/PXC model contains several pairs of contrast patterns and local models, where a local classifier is applied only to data instances matching its associated pattern. We also propose a class of classification and regression techniques called Contrast Pattern Aided Regression (CPXR) and Contrast Pattern Aided Classification (CPXC) to build accurate and interpretable PXR and PXC models.
We have conducted a set of comprehensive performance studies to evaluate the performance of CPXR and CPXC. The results show that CPXR and CPXC outperform state-of-the-art regression and classification algorithms, often by significant margins. The results also show that CPXR and CPXC are especially effective for heterogeneous and high dimensional datasets. Besides being new types of modeling, PXR and PXC models can also provide insights into data heterogeneity and diverse predictor-response relationships.
We have also adapted CPXC to handle classifying imbalanced datasets and introduced a new algorithm called Contrast Pattern Aided Classification for Imbalanced Datasets (CPXCim). In CPXCim, we applied a weighting method to boost minority instances as well as a new filtering method to prune patterns with imbalanced matching datasets.
Finally, we applied our techniques on three real applications, two in the healthcare domain and one in the soil mechanic domain. PXR and PXC models are significantly more accurate than other learning algorithms in those three applications.
Part of a lectures series for the international summer course in metabolomics 2013 (http://metabolomics.ucdavis.edu/courses-and-seminars/courses). Get more material and information here (http://imdevsoftware.wordpress.com/2013/09/08/sessions-in-metabolomics-2013/).
Advanced strategies for Metabolomics Data AnalysisDmitry Grapov
Part of a lectures series for the international summer course in metabolomics 2013 (http://metabolomics.ucdavis.edu/courses-and-seminars/courses). Get more material and information here (http://imdevsoftware.wordpress.com/2013/09/08/sessions-in-metabolomics-2013/).
Strategies for Metabolomics Data AnalysisDmitry Grapov
Part of a lectures series for the international summer course in metabolomics 2013 (http://metabolomics.ucdavis.edu/courses-and-seminars/courses). Get more material and information here (http://imdevsoftware.wordpress.com/2013/09/08/sessions-in-metabolomics-2013/).
Automation of (Biological) Data Analysis and Report GenerationDmitry Grapov
I've been experimenting with automating simple and complex data analysis and report generation tasks for biological data and mostly using R and LATEX. You can see some of my progress and challenges encountered.
Metabolomic data analysis and visualization toolsDmitry Grapov
A description of data analysis and visualization tools for metabolomic and other high dimensional data sets, developed at the NIH West Coast Metabolomics Center.
Case Study: Overview of Metabolomic Data Normalization StrategiesDmitry Grapov
Five normalization methods were compared, of which the combination of qc-LOESS and cubic splines showed the best performance based on within-batch and between-batch variable relative standard deviations for QCs. This approach was used to normalize sample measurements the results of which were analyzed using principal components analysis.
3 data normalization (2014 lab tutorial)Dmitry Grapov
Get more information:
http://imdevsoftware.wordpress.com/2014/10/11/2014-metabolomic-data-analysis-and-visualization-workshop-and-tutorials/
Recently I had the pleasure of teaching statistical and multivariate data analysis and visualization at the annual Summer Sessions in Metabolomics 2014, organized by the NIH West Coast Metabolomics Center.
The International Journal of Engineering and Science (The IJES)theijes
The International Journal of Engineering & Science is aimed at providing a platform for researchers, engineers, scientists, or educators to publish their original research results, to exchange new ideas, to disseminate information in innovative designs, engineering experiences and technological skills. It is also the Journal's objective to promote engineering and technology education. All papers submitted to the Journal will be blind peer-reviewed. Only original articles will be published.
Prote-OMIC Data Analysis and VisualizationDmitry Grapov
Introductory lecture to multivariate analysis of proteomic data.
Material from the UC Davis 2014 Proteomics Workshop.
See more at: http://sourceforge.net/projects/teachingdemos/files/2014%20UC%20Davis%20Proteomics%20Workshop/
Vahid Taslimitehrani's Dissertation Defense: Friday, February 19 2015.
Ph.D. Committee: Drs. Guozhu Dong, Advisor, T.K. Prasad, Amit Sheth, Keke Chen
and Jyotishman Pathak, Division of Health Informatics, Weill Cornell Medical College, Cornell University.
ABSTRACT:
Regression and classification techniques play an essential role in many data mining tasks and have broad applications. However, most of the state-of-the-art regression and classification techniques are often unable to adequately model the interactions among predictor variables in highly heterogeneous datasets. New techniques that can effectively model such complex and heterogeneous structures are needed to significantly improve prediction accuracy.
In this dissertation, we propose a novel type of accurate and interpretable regression and classification models, named as Pattern Aided Regression (PXR) and Pattern Aided Classification (PXC) respectively. Both PXR and PXC rely on identifying regions in the data space where a given baseline model has large modeling errors, characterizing such regions using patterns, and learning specialized models for those regions. Each PXR/PXC model contains several pairs of contrast patterns and local models, where a local classifier is applied only to data instances matching its associated pattern. We also propose a class of classification and regression techniques called Contrast Pattern Aided Regression (CPXR) and Contrast Pattern Aided Classification (CPXC) to build accurate and interpretable PXR and PXC models.
We have conducted a set of comprehensive performance studies to evaluate the performance of CPXR and CPXC. The results show that CPXR and CPXC outperform state-of-the-art regression and classification algorithms, often by significant margins. The results also show that CPXR and CPXC are especially effective for heterogeneous and high dimensional datasets. Besides being new types of modeling, PXR and PXC models can also provide insights into data heterogeneity and diverse predictor-response relationships.
We have also adapted CPXC to handle classifying imbalanced datasets and introduced a new algorithm called Contrast Pattern Aided Classification for Imbalanced Datasets (CPXCim). In CPXCim, we applied a weighting method to boost minority instances as well as a new filtering method to prune patterns with imbalanced matching datasets.
Finally, we applied our techniques on three real applications, two in the healthcare domain and one in the soil mechanic domain. PXR and PXC models are significantly more accurate than other learning algorithms in those three applications.
The use of data and its modelling in science provides meaningful interpretation of real world problems. This presentation provides an easy to understand overview of data visualization and analytics , and snippets of data science applications using R - programming.
- What is Clustering, Honeypots and Density Based Clustering?
- What is Optics Clustering and how is it different than DB Clustering? …and how
can it be used for outlier detection.
- What is so-called soft clustering and how is it different than clustering? …and how
can it be used for outlier detection.
Data Tactics Data Science Brown Bag (April 2014)Rich Heimann
This is a presentation we perform internally every quarter as part of our Data Science Brown Bag Series. This presentation was talking about different types of soft clustering techniques - all of which the team currently performs depending on the complexity of the data and the complexity of customer problems. If you are interested in learning more about working with L-3 Data Tactics or interested in working for the L-3 Data Tactics Data Science team please contact us soon! Thank you.
Full course: https://creativedatasolutions.github.io/CDS.courses/courses/network_mapping_101/docs/
The course covered all of the steps required to go from `raw data` to a rich `mapped biochemical network` incorporating statistical, multivariate and machine learning results. This included [examples](https://creativedatasolutions.github.io/CDS.courses/courses/network_mapping_101/docs/#topics) and tutorials for:
* Preparing raw data for analysis
* Multivariate data exploration
* Supervised clustering
* Machine learning – classification model validation and feature selection
* Network analysis - biochemical, structural similarity and correlation networks
* Network mapping – putting it all together to create a publication quality network
url:
https://github.com/CreativeDataSolutions/CDS.courses/blob/gh-pages/courses/network_mapping_101/materials/lectures/tutorial.pdf
Rise of Deep Learning for Genomic, Proteomic, and Metabolomic Data Integratio...Dmitry Grapov
Machine learning (ML) is being ubiquitously incorporated into everyday products such as Internet search, email spam filters, product recommendations, image classification, and speech recognition. New approaches for highly integrated manufacturing and automation such as the Industry 4.0 and the Internet of things are also converging with ML methodologies. Many approaches incorporate complex artificial neural network architectures and are collectively referred to as deep learning (DL) applications. These methods have been shown capable of representing and learning predictable relationships in many diverse forms of data and hold promise for transforming the future of omics research and applications in precision medicine. Omics and electronic health record data pose considerable challenges for DL. This is due to many factors such as low signal to noise, analytical variance, and complex data integration requirements. However, DL models have already been shown capable of both improving the ease of data encoding and predictive model performance over alternative approaches. It may not be surprising that concepts encountered in DL share similarities with those observed in biological message relay systems such as gene, protein, and metabolite networks. This expert review examines the challenges and opportunities for DL at a systems and biological scale for a precision medicine readership.
current: https://drive.google.com/open?id=0B51AEMfo-fh9M3FmWXVlb05pdm8
I am always looking for the next data science, machine learning and visualization challenge.
Here is a link to my up to date
resume:
https://drive.google.com/open?id=0B51AEMfo-fh9M3FmWXVlb05pdm8
cv:
https://drive.google.com/open?id=0B51AEMfo-fh9Z05aM2p6XzFIOFE
https://www.youtube.com/watch?v=Y_-o-4rKxUk
Machine learning powered metabolomic network analysis
Dmitry Grapov PhD,
Director of Data Science and Bioinformatics,
CDS- Creative Data Solutions
www.createdatasol.com
Metabolomic network analysis can be used to interpret experimental results within a variety of contexts including: biochemical relationships, structural and spectral similarity and empirical correlation. Machine learning is useful for modeling relationships in the context of pattern recognition, clustering, classification and regression based predictive modeling. The combination of developed metabolomic networks and machine learning based predictive models offer a unique method to visualize empirical relationships while testing key experimental hypotheses. The following presentation focuses on data analysis, visualization, machine learning and network mapping approaches used to create richly mapped metabolomic networks. Learn more at www.createdatasol.com
Step by step tutorial for conducting GO enrichment analysis and then creating a network from the results.
Material from the UC Davis 2014 Proteomics Workshop.
See more at: http://sourceforge.net/projects/teachingdemos/files/2014%20UC%20Davis%20Proteomics%20Workshop/
Instructions for Submissions thorugh G- Classroom.pptxJheel Barad
This presentation provides a briefing on how to upload submissions and documents in Google Classroom. It was prepared as part of an orientation for new Sainik School in-service teacher trainees. As a training officer, my goal is to ensure that you are comfortable and proficient with this essential tool for managing assignments and fostering student engagement.
How to Split Bills in the Odoo 17 POS ModuleCeline George
Bills have a main role in point of sale procedure. It will help to track sales, handling payments and giving receipts to customers. Bill splitting also has an important role in POS. For example, If some friends come together for dinner and if they want to divide the bill then it is possible by POS bill splitting. This slide will show how to split bills in odoo 17 POS.
Students, digital devices and success - Andreas Schleicher - 27 May 2024..pptxEduSkills OECD
Andreas Schleicher presents at the OECD webinar ‘Digital devices in schools: detrimental distraction or secret to success?’ on 27 May 2024. The presentation was based on findings from PISA 2022 results and the webinar helped launch the PISA in Focus ‘Managing screen time: How to protect and equip students against distraction’ https://www.oecd-ilibrary.org/education/managing-screen-time_7c225af4-en and the OECD Education Policy Perspective ‘Students, digital devices and success’ can be found here - https://oe.cd/il/5yV
The Roman Empire A Historical Colossus.pdfkaushalkr1407
The Roman Empire, a vast and enduring power, stands as one of history's most remarkable civilizations, leaving an indelible imprint on the world. It emerged from the Roman Republic, transitioning into an imperial powerhouse under the leadership of Augustus Caesar in 27 BCE. This transformation marked the beginning of an era defined by unprecedented territorial expansion, architectural marvels, and profound cultural influence.
The empire's roots lie in the city of Rome, founded, according to legend, by Romulus in 753 BCE. Over centuries, Rome evolved from a small settlement to a formidable republic, characterized by a complex political system with elected officials and checks on power. However, internal strife, class conflicts, and military ambitions paved the way for the end of the Republic. Julius Caesar’s dictatorship and subsequent assassination in 44 BCE created a power vacuum, leading to a civil war. Octavian, later Augustus, emerged victorious, heralding the Roman Empire’s birth.
Under Augustus, the empire experienced the Pax Romana, a 200-year period of relative peace and stability. Augustus reformed the military, established efficient administrative systems, and initiated grand construction projects. The empire's borders expanded, encompassing territories from Britain to Egypt and from Spain to the Euphrates. Roman legions, renowned for their discipline and engineering prowess, secured and maintained these vast territories, building roads, fortifications, and cities that facilitated control and integration.
The Roman Empire’s society was hierarchical, with a rigid class system. At the top were the patricians, wealthy elites who held significant political power. Below them were the plebeians, free citizens with limited political influence, and the vast numbers of slaves who formed the backbone of the economy. The family unit was central, governed by the paterfamilias, the male head who held absolute authority.
Culturally, the Romans were eclectic, absorbing and adapting elements from the civilizations they encountered, particularly the Greeks. Roman art, literature, and philosophy reflected this synthesis, creating a rich cultural tapestry. Latin, the Roman language, became the lingua franca of the Western world, influencing numerous modern languages.
Roman architecture and engineering achievements were monumental. They perfected the arch, vault, and dome, constructing enduring structures like the Colosseum, Pantheon, and aqueducts. These engineering marvels not only showcased Roman ingenuity but also served practical purposes, from public entertainment to water supply.
Unit 8 - Information and Communication Technology (Paper I).pdfThiyagu K
This slides describes the basic concepts of ICT, basics of Email, Emerging Technology and Digital Initiatives in Education. This presentations aligns with the UGC Paper I syllabus.
8. Statistical Analysis
•Identify differences in sample population
means
•sensitive to distribution shape
•parametric = assumes normality
•error in Y, not in X (Y = mX + error)
wide
•optimal for long data
•assumed independence
•false discovery rate (FDR)
long
n-of-one
9. Achieving “significance” is a function of:
significance level (α) and power (1-β )
effect size (standardized difference in means)
sample size (n)
10. False Discovery Rate (FDR)
Type I Error: False Positives
•Type II Error: False Negatives
•Type I risk =
•1-(1-p.value)m
m = number of variables tested
FDR correction
• p-value adjustment or estimate of FDR (Fdr, q-value)
Bioinformatics (2008) 24 (12):1461-1462
12. Multivariate Analysis
Clustering
• Grouping based on similarity/dissimilarity
Principal Components Analysis (PCA)
• Identify modes of variance in the data
Partial Least Squares (PLS)
•Identify modes of variance in the data
correlated with a hypothesis
13. Cluster Analysis
Use similarity/dissimilarity to group a
collection of samples or variables
Linkage
Approaches
•hierarchical (HCA)
•non-hierarchical (k-NN, k-means)
•distribution (mixtures models)
•density (DBSCAN)
Distribution
•self organizing maps (SOM)
k-means
Density
15. Hierarchy of Similarity
How does my metadata
match my data structure?
Hierarchy of
effect sizes
x
x
x
Similarity
x
16. Projection of Data
Raw data
PCA dimensions
http://www.scholarpedia.org/article/Eigenfaces
The algorithm defines the position of the light source
Principal Components Analysis (PCA)
• unsupervised
• maximize variance (X)
Partial Least Squares Projection to
Latent Structures (PLS)
• supervised
• maximize covariance (Y ~ X)
PC1
PC2
James X. Li, 2009, VisuMap Tech.
20. Use PLS to test a hypothesis
Partial Least Squares (PLS) is used to identify planes of maximum
correlation between X measurements and Y (hypothesis)
PLS
PCA
time = 0
120 min.
21. PLS model validation is critical
Determine in-sample (Q2) and outof-sample error (RMSEP) and
compare to a random model
•permutation tests
•training/testing
25. Data visualization as form of analysis
Dextromethorphan
= additives in
DM
Liver
CYP2D6
•high fructose
corn syrup
dextrorphan
• antioxidants
•flavor