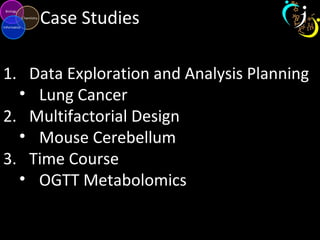
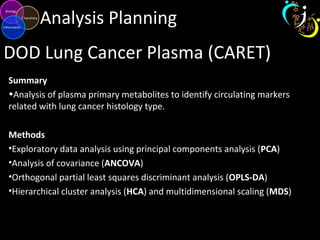
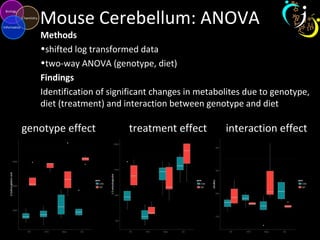
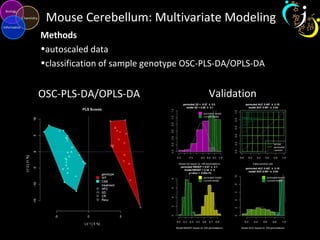
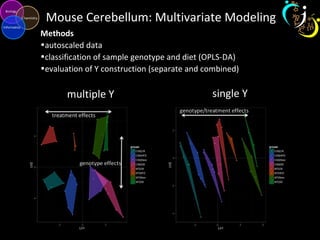
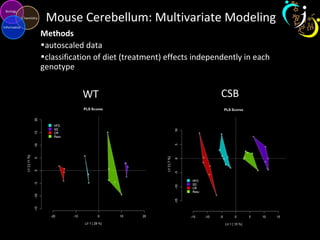
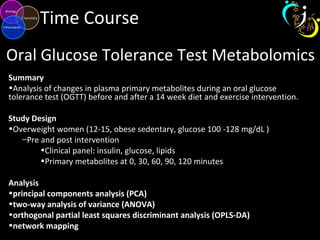
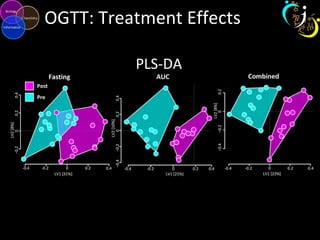
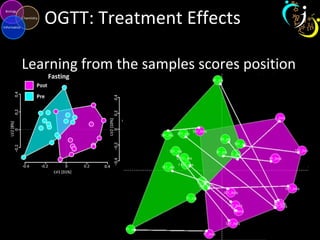
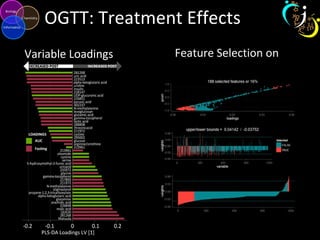
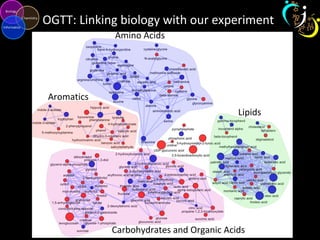
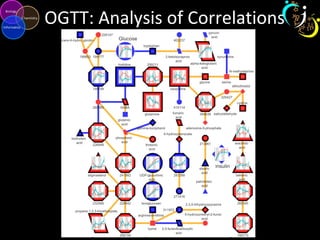
Metabolomic Data Analysis
Case Studies
Dmitry Grapov, PhD
CaseStudies
Case Studies
1. Data Exploration and Analysis Planning
• Lung Cancer
2. Multifactorial Design
• Mouse Cerebellum
3. Time Course
• OGTT Metabolomics
Analysis Planning
DOD Lung Cancer Plasma (CARET)
Summary
•Analysis of plasma primary metabolites to identify circulating markers
related with lung cancer histology type.
Methods
•Exploratory data analysis using principal components analysis (PCA)
•Analysis of covariance (ANCOVA)
•Orthogonal partial least squares discriminant analysis (OPLS-DA)
•Hierarchical cluster analysis (HCA) and multidimensional scaling (MDS)
Lung Cancer: Exploratory Analysis
Purpose
•Overview data variance structure
Methods
•Singular value decomposition (SVD) on autoscaled data
PC1 and 2 (14% variance
explained) display 2
clusters of points
Cluster structure could not be
explained by histology or any
other metadata
Cluster structure is best
explained by instrumental
acquisition date
Black - 110629 to 110701
Red - 110702 to 110705
Lung Cancer: Analysis Planning
Purpose
•Identify significant changes in metabolites while adjusting for the noted batch effect, gender and
smoking status covariates.
Methods
•Shifted logarithm (natural) transformed data
•ANCOVA: batch + gender + smoking
•False Discovery Rate correction and estimation
PCA used to overview covariate
adjusted data structure
Cluster structure in the adjusted data suggests
that there is another unexplained covariate
OPLS-DA was used to evaluate covariate adjustments and
hypothesis testing strategies
Modeling histology (control in green) Modeling control/cancer and histology
Lung Cancer: ANCOVA
• Summary
• Optimal testing strategy was identified as :
• Using covariate adjusted data ( ~batch +gender +smoking) to test for differences between control and
cancer (adenocarcinoma, NSCLC and squamous)
OPLS-DA overview of optimized
modeling strategy
Identified 24 (8%) significantly changes species (3 post
FDR)
Lung Cancer: Correlation Analysis
Purpose
Identify relationships between
known and unknown metabolic
features.
Methods
•Hierarchical cluster analysis
(euclidean distances from
spearmans correlations, linked
by wards method)
Summary
•Top features could be grouped
into 8 major correlated clusters
Top changed unknown metabolites could
be linked to named species
•223566 tryptophan∝
•225405 1/ beta-alanine∝
•274174 methionine, glucuronic acid∝
•228377 tryptophan∝
•362112 tryptophan∝
Lung Cancer
Conclusions
• Metabolic data contained batch effects, which could be in part
explained by data acquisition date
• Univariate analyses were limited by the effects of outliers
• Multivariate modeling was used to identify 64 features (21%) which best
explain differences in plasma metabolites from patients with or without
lung cancer
• hydroxylamine, aspartic acid, and tryptophan displayed patterns of
change consistent with differences in patient cancer histology
• Correlation analysis was used to link many significant changes in
unknowns to tryptophan
Multifactorial Design
Mouse Cerebellum Metabolomics
Summary
•Analysis of mice carrying a gene mutation in ERCC8. Cockayne Syndrome B, rare
autosomal recessive congenital disorder, which is related to premature aging.
Mutant animals display altered glycolytic and mitochondrial metabolism which is
benefited by a high fat diet.
Study Design
•2 genotypes (WT, CSB; n=20)
•4 diets per genotype (SD, Resv, CR, HFD; n=5)
Analysis
•principal components analysis (PCA)
•two-way analysis of variance (ANOVA)
•orthogonal partial least squares discriminant analysis (OPLS-DA)
•network mapping
Mouse Cerebellum: PCA
Method
Conducted on autoscaled data
using SVD.
Findings
Identified 6 possible outliers all
of which are in the WT genotype
Mouse Cerebellum: Outliers
methods
Use PLS-DA to determine if
outlier samples hold when trying
to maximize the difference
between WT and CSB animals.
Findings
Noted outliers in WT should be
removed or analyzed separately
PCA
PLS-DA
Mouse Cerebellum: ANOVA
Methods
•shifted log transformed data
•two-way ANOVA (genotype, diet)
Findings
Identification of significant changes in metabolites due to genotype,
diet (treatment) and interaction between genotype and diet
genotype effect treatment effect interaction effect
Mouse Cerebellum: Multivariate Modeling
Methods
•autoscaled data
•classification of sample genotype OSC-PLS-DA/OPLS-DA
OSC-PLS-DA/OPLS-DA Validation
Mouse Cerebellum: Multivariate Modeling
Methods
•autoscaled data
•classification of sample genotype and diet (OPLS-DA)
•evaluation of Y construction (separate and combined)
multiple Y single Y
Mouse Cerebellum: Multivariate Modeling
Methods
•autoscaled data
•classification of diet (treatment) effects independently in each
genotype
WT CSB
Mouse Cerebellum: Network Analysis
Methods
•generate biochemical and chemical similarity network
•map statistical and OPLS-DA model results to network
•Analyze
– genotype network
– Treatment networks in WT and CSB separately
Mouse Cerebellum: Genotype Network
Mouse Cerebellum: WT Treatment Network
Mouse Cerebellum: CSB Treatment Network
Mouse Cerebellum
Conclusions
Major differences between CSB and WT :
• elevation of 2-hydroxyglutaric acid in CSB
• 2-hydroxyglutaric aciduria is either autosomal recessive or autosomal
dominant
• perturbations in methionine and (potentially) single-carbon
metabolisms.
– Increase in the related species methionine, homoserine and serine and
decrease in adenosine-5'phosphate may point to decreases in s-
adenosyl methionine (SAM-e) synthesis. Reduction in SAM-e could have
detrimental effects on single carbon metabolism and methylation
reactions, which through a systemic reduction in choline would impact
phospotidylcholine synthesis.
•Independent of genotype, treatment effects can be classified on a
continuum of metabolic change from CR >HFD > Resv > SD.
– Treatment-related changes in citrulline were modified based on genotype
(strong genotype/treatment interaction).
•Similar changes due to treatment in both genotypes (e.g. 1,5-
anhydroglycitol) may be an outcome of diet composition and not
biology.
Time Course
Oral Glucose Tolerance Test Metabolomics
Summary
•Analysis of changes in plasma primary metabolites during an oral glucose
tolerance test (OGTT) before and after a 14 week diet and exercise intervention.
Study Design
•Overweight women (12-15, obese sedentary, glucose 100 -128 mg/dL )
–Pre and post intervention
•Clinical panel: insulin, glucose, lipids
•Primary metabolites at 0, 30, 60, 90, 120 minutes
Analysis
•principal components analysis (PCA)
•two-way analysis of variance (ANOVA)
•orthogonal partial least squares discriminant analysis (OPLS-DA)
•network mapping
OGTT: Data Properties
Excursion
Baseline and Area
Under the Curve
(AUC)
Time Course: Options
Baseline adjusted vs AUC
Raw (top) vs Baseline
adjusted (bottom)
OGTT: Data Analysis
• Identification of OGTT effects
– significant metabolomic excursions (one sample t-Test on AUC)
• pre, post or both
– intervention-adjusted PLS model
– OGTT biochemical/chemical similarity network
• Identification of treatment effects
– Univariate statics
• Two-way ANOVA time and intervention
• Mixed effects modeling (intervention as the main effect and individual subjects
as random effects)
– PLS-DA modeling and feature selection of changes in
• Baseline (t =0)
• AUC
• Combined baseline and AUC
– Analysis of correlations
OGTT: effects on primary metabolism
PCA
PLS-DA
(intervention adjusted data
modeling time)
OGTT: effects network
OGTT: Treatment Effects
PLS-DA
OGTT: Treatment Effects
Learning from the samples scores position
OGTT: Treatment Effects
Feature Selection on
Loadings
Variable Loadings
OGTT: Linking biology with our experiment
OGTT: Analysis of Correlations
Conclusion
• Each data analysis is unique
• Which method “should” be used is
defined by how the data “looks” and the
goal of the analysis
• Different analysis techniques are used to
get independent perspectives of the data
• Combination of similar evidence from
different techniques is used to define the
robust explanation of the experiment

Metabolomic Data Analysis Case Studies

  • 1.
    Metabolomic Data Analysis CaseStudies Dmitry Grapov, PhD CaseStudies
  • 2.
    Case Studies 1. DataExploration and Analysis Planning • Lung Cancer 2. Multifactorial Design • Mouse Cerebellum 3. Time Course • OGTT Metabolomics
  • 3.
    Analysis Planning DOD LungCancer Plasma (CARET) Summary •Analysis of plasma primary metabolites to identify circulating markers related with lung cancer histology type. Methods •Exploratory data analysis using principal components analysis (PCA) •Analysis of covariance (ANCOVA) •Orthogonal partial least squares discriminant analysis (OPLS-DA) •Hierarchical cluster analysis (HCA) and multidimensional scaling (MDS)
  • 4.
    Lung Cancer: ExploratoryAnalysis Purpose •Overview data variance structure Methods •Singular value decomposition (SVD) on autoscaled data PC1 and 2 (14% variance explained) display 2 clusters of points Cluster structure could not be explained by histology or any other metadata Cluster structure is best explained by instrumental acquisition date Black - 110629 to 110701 Red - 110702 to 110705
  • 5.
    Lung Cancer: AnalysisPlanning Purpose •Identify significant changes in metabolites while adjusting for the noted batch effect, gender and smoking status covariates. Methods •Shifted logarithm (natural) transformed data •ANCOVA: batch + gender + smoking •False Discovery Rate correction and estimation PCA used to overview covariate adjusted data structure Cluster structure in the adjusted data suggests that there is another unexplained covariate OPLS-DA was used to evaluate covariate adjustments and hypothesis testing strategies Modeling histology (control in green) Modeling control/cancer and histology
  • 6.
    Lung Cancer: ANCOVA •Summary • Optimal testing strategy was identified as : • Using covariate adjusted data ( ~batch +gender +smoking) to test for differences between control and cancer (adenocarcinoma, NSCLC and squamous) OPLS-DA overview of optimized modeling strategy Identified 24 (8%) significantly changes species (3 post FDR)
  • 7.
    Lung Cancer: CorrelationAnalysis Purpose Identify relationships between known and unknown metabolic features. Methods •Hierarchical cluster analysis (euclidean distances from spearmans correlations, linked by wards method) Summary •Top features could be grouped into 8 major correlated clusters Top changed unknown metabolites could be linked to named species •223566 tryptophan∝ •225405 1/ beta-alanine∝ •274174 methionine, glucuronic acid∝ •228377 tryptophan∝ •362112 tryptophan∝
  • 8.
    Lung Cancer Conclusions • Metabolicdata contained batch effects, which could be in part explained by data acquisition date • Univariate analyses were limited by the effects of outliers • Multivariate modeling was used to identify 64 features (21%) which best explain differences in plasma metabolites from patients with or without lung cancer • hydroxylamine, aspartic acid, and tryptophan displayed patterns of change consistent with differences in patient cancer histology • Correlation analysis was used to link many significant changes in unknowns to tryptophan
  • 9.
    Multifactorial Design Mouse CerebellumMetabolomics Summary •Analysis of mice carrying a gene mutation in ERCC8. Cockayne Syndrome B, rare autosomal recessive congenital disorder, which is related to premature aging. Mutant animals display altered glycolytic and mitochondrial metabolism which is benefited by a high fat diet. Study Design •2 genotypes (WT, CSB; n=20) •4 diets per genotype (SD, Resv, CR, HFD; n=5) Analysis •principal components analysis (PCA) •two-way analysis of variance (ANOVA) •orthogonal partial least squares discriminant analysis (OPLS-DA) •network mapping
  • 10.
    Mouse Cerebellum: PCA Method Conductedon autoscaled data using SVD. Findings Identified 6 possible outliers all of which are in the WT genotype
  • 11.
    Mouse Cerebellum: Outliers methods UsePLS-DA to determine if outlier samples hold when trying to maximize the difference between WT and CSB animals. Findings Noted outliers in WT should be removed or analyzed separately PCA PLS-DA
  • 12.
    Mouse Cerebellum: ANOVA Methods •shiftedlog transformed data •two-way ANOVA (genotype, diet) Findings Identification of significant changes in metabolites due to genotype, diet (treatment) and interaction between genotype and diet genotype effect treatment effect interaction effect
  • 13.
    Mouse Cerebellum: MultivariateModeling Methods •autoscaled data •classification of sample genotype OSC-PLS-DA/OPLS-DA OSC-PLS-DA/OPLS-DA Validation
  • 14.
    Mouse Cerebellum: MultivariateModeling Methods •autoscaled data •classification of sample genotype and diet (OPLS-DA) •evaluation of Y construction (separate and combined) multiple Y single Y
  • 15.
    Mouse Cerebellum: MultivariateModeling Methods •autoscaled data •classification of diet (treatment) effects independently in each genotype WT CSB
  • 16.
    Mouse Cerebellum: NetworkAnalysis Methods •generate biochemical and chemical similarity network •map statistical and OPLS-DA model results to network •Analyze – genotype network – Treatment networks in WT and CSB separately
  • 17.
  • 18.
    Mouse Cerebellum: WTTreatment Network
  • 19.
    Mouse Cerebellum: CSBTreatment Network
  • 20.
    Mouse Cerebellum Conclusions Major differencesbetween CSB and WT : • elevation of 2-hydroxyglutaric acid in CSB • 2-hydroxyglutaric aciduria is either autosomal recessive or autosomal dominant • perturbations in methionine and (potentially) single-carbon metabolisms. – Increase in the related species methionine, homoserine and serine and decrease in adenosine-5'phosphate may point to decreases in s- adenosyl methionine (SAM-e) synthesis. Reduction in SAM-e could have detrimental effects on single carbon metabolism and methylation reactions, which through a systemic reduction in choline would impact phospotidylcholine synthesis. •Independent of genotype, treatment effects can be classified on a continuum of metabolic change from CR >HFD > Resv > SD. – Treatment-related changes in citrulline were modified based on genotype (strong genotype/treatment interaction). •Similar changes due to treatment in both genotypes (e.g. 1,5- anhydroglycitol) may be an outcome of diet composition and not biology.
  • 21.
    Time Course Oral GlucoseTolerance Test Metabolomics Summary •Analysis of changes in plasma primary metabolites during an oral glucose tolerance test (OGTT) before and after a 14 week diet and exercise intervention. Study Design •Overweight women (12-15, obese sedentary, glucose 100 -128 mg/dL ) –Pre and post intervention •Clinical panel: insulin, glucose, lipids •Primary metabolites at 0, 30, 60, 90, 120 minutes Analysis •principal components analysis (PCA) •two-way analysis of variance (ANOVA) •orthogonal partial least squares discriminant analysis (OPLS-DA) •network mapping
  • 22.
    OGTT: Data Properties Excursion Baselineand Area Under the Curve (AUC)
  • 23.
    Time Course: Options Baselineadjusted vs AUC Raw (top) vs Baseline adjusted (bottom)
  • 24.
    OGTT: Data Analysis •Identification of OGTT effects – significant metabolomic excursions (one sample t-Test on AUC) • pre, post or both – intervention-adjusted PLS model – OGTT biochemical/chemical similarity network • Identification of treatment effects – Univariate statics • Two-way ANOVA time and intervention • Mixed effects modeling (intervention as the main effect and individual subjects as random effects) – PLS-DA modeling and feature selection of changes in • Baseline (t =0) • AUC • Combined baseline and AUC – Analysis of correlations
  • 25.
    OGTT: effects onprimary metabolism PCA PLS-DA (intervention adjusted data modeling time)
  • 26.
  • 27.
  • 28.
    OGTT: Treatment Effects Learningfrom the samples scores position
  • 29.
    OGTT: Treatment Effects FeatureSelection on Loadings Variable Loadings
  • 30.
    OGTT: Linking biologywith our experiment
  • 31.
    OGTT: Analysis ofCorrelations
  • 32.
    Conclusion • Each dataanalysis is unique • Which method “should” be used is defined by how the data “looks” and the goal of the analysis • Different analysis techniques are used to get independent perspectives of the data • Combination of similar evidence from different techniques is used to define the robust explanation of the experiment