
Recommended
More Related Content
What's hot
What's hot (20)
Viewers also liked
Viewers also liked (11)
Similar to RUCK 2017 김성환 R 패키지 메타주성분분석(MetaPCA)
Similar to RUCK 2017 김성환 R 패키지 메타주성분분석(MetaPCA) (20)
More from r-kor
More from r-kor (16)
Recently uploaded
Recently uploaded (20)
RUCK 2017 김성환 R 패키지 메타주성분분석(MetaPCA)
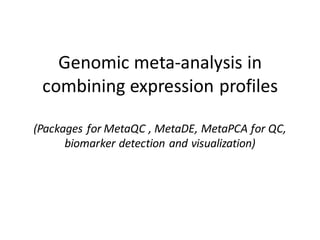
- 1. Genomic meta-analysis in combining expression profiles (Packages for MetaQC , MetaDE, MetaPCA for QC, biomarker detection and visualization)
- 2. Outline 1. Introduction 2. Quality control (MetaQC) 3. Meta-analysis for detecting differentially expressed genes (MetaDE) 4. Integrative visualization (MetaPCA)
- 4. Experimental design Image analysis Preprocessing (Normalization, filtering, MV imputation) Data visualization Identify differentially expressed genes Regulatory network Clustering Classification Statistical Issues in Microarray Analysis Gene enrichment analysis Integrative analysis & meta-analysis
- 7. Meta-analysis and integrative analysis • Horizontal genomic meta-analysis: – Combine multiple relevant studies (e.g. microarray or GWAS) to (1) increase statistical power (2) provide robust and accurate validation across studies and (3) guide future experiments • Vertical genomic integrative analysis: – Integrate multiple studies that measure multiple dimension of genetic information of the same cohort (e.g. transcription, genotyping, copy number variation, methylation, miRNA etc).
- 8. group)(diseased1 ,group)(control1 ,1,1 study,sample ,geneofintensityexpression: kkk k gsk nmsm ms KkGg ks gx +≤≤+ ≤≤ ≤≤≤≤ study 1 genes N … N T … T statistic 1 t11 2 t21 3 t31 … … G tG1 study K genes N … N T … T statistic 1 t1K 2 tK 3 t3K … … G tGK ! study 2 genes N … N T … T statistic 1 t12 2 t22 3 t32 … … G tG2 Motivation and background Data considered:
- 14. 2. Quality control (MetaQC)
- 15. MetaQC Quality control analysis to determine inclusion/exclusion criteria for microarray meta- analysis • Dongwan D. Kang, Etienne Sibille, Naftali Kaminski, and George C. Tseng*. (2012) MetaQC: Objective Quality Control and Inclusion/Exclusion Criteria for Genomic Meta-Analysis. Nucleic Acids Research. 40(2):e15.
- 16. Inclusion/exclusion criteria Examples of inclusion/exclusion criteria in the literature: • Collect whatever microarray data sets available to combine • Go to GEO to retrieve all relevant studies in Affymetrix U133 • At least four samples in each class label … Problem: ad hoc criteria and “expert” opinion Aim: Is it possible to develop a quantitative quality assessment to perform inclusion/exclusion of the microarray studies?
- 19. install.packages("MetaQC") library(MetaQC) requireAll(c("proto", "foreach")) #Toy Example data(brain) #already hugely filtered #Two default gmt files are automatically downloaded, #otherwise it is required to locate it correctly. #Refer to http://www.broadinstitute.org/gsea/downloads.jsp #For parallel computation with only 2 cores #R >= 2.11.0 in windows to use parallel computing brainQC <- MetaQC(brain, "c2.cp.biocarta.v3.0.symbols.gmt", filterGenes=FALSE, verbose=TRUE, isParallel=TRUE, nCores=2) #B is recommended to be >= 1e4 in real application runQC(brainQC, B=1e2, fileForCQCp="c2.all.v3.0.symbols.gmt") plot(brainQC) R-codes to execute
- 20. Brain cancer example Paugh and Yamanaka have lower quality and will be excluded from meta-analysis. These two studies have small sample sizes.
- 21. 3. Meta-analysis for detecting differentially expressed genes (MetaDE)
- 23. Goal of meta-analysis Goal of meta-analysis: • What kind of biomarkers is of interest: – Biomarkers statistically significant and consistent in all (or majority) of the studies. – Biomarkers statistically significant in one or more studies.
- 24. • Biomarkers detected by Fisher’s method (EW) and ordered by hierarchical clustering. • Genes are DE in one or more studies but no indication of which ones. Fisher’s method Fisher vs AW
- 25. • Biomarkers detected by AW method and ordered by hierarchical clustering. • The optimal weights provide natural categorization and interpretation of biomarkers. Adaptively weighted (AW) Fisher vs AW
- 26. install.packages("MetaDE") library(MetaDE) #Meta analysis of DE genes between two classes #Two pseudo datasets label1<-rep(0:1,each=5) label2<-rep(0:1,each=5) exp1<-cbind(matrix(rnorm(5*20),20,5),matrix(rnorm(5*20,2),20,5)) exp2<-cbind(matrix(rnorm(5*20),20,5),matrix(rnorm(5*20,1.5),20,5)) x<-list(list(exp1,label1),list(exp2,label2)) # modt tests for individual study and used Fisher's method to combine results MetaDE.rawdata(x=x,ind.method=c('modt','modt'),meta.method='Fisher', nperm=20) R-codes to execute
- 27. The available statistical tests for argument, ind.method: • "regt": Two-sample t-statistics (unequal variances). • "modt": Two-sample t-statistics with the variance is modified by adding a fudging parameter. In our algorithm, we choose the penalized t-statistics used in Efron et al.(2001) and Tusher et al. (2001). The fudge parameter s0 is chosen to be the median variability estimator in the genome. • "pairedt": Paired t-statistics for the design of paired samples. • "F":, the test is based on F-statistics. It is usually chosen where there are 2 or more classes. R-codes to execute
- 28. The options “meta.method” • "maxP": the maximum of p value method. • "maxP.OC": the maximum of p values with one-sided correction. • "minP": the minimum of p values from "test" across studies. • "minP.OC": the minimum of p values with one-sided correction. • "Fisher": Fisher’s method (Fisher, 1932),the summation of -log(p-value) across studies. • "Fisher.OC": Fisher’s method with one-sided correction (Fisher, 1932),the summation of -log(p-value) across studies. • "AW": Adaptively-weighted method (Li and Tseng, 2011). • "AW.OC": Adaptively-weighted method with one-sided correction (Li and Tseng, 2011). • "FEM": the Fixed-effect model method. • "REM": the Random-effect model method.
- 30. • Microarray experiment (mRNA) for analyzing mouse metabolisms • Three class labels of samples: Three genotype mice: wild-type (WT), LCAD knock-out (LCAD) and VLCAD knock-out (VLCAD). • Four microarray datasets (Brown fat, Skeletal, Liver and Heart; 44 samples in total). • Pre-processing: low-expressed features (mean<0.7, SD <0.7) and gene matching leave 1,304 features in analysis.
- 31. Motivation examples of dimension reduction
- 32. Geometrical PC space comparison
- 35. • Spellman’s yeast cell cycle data (Spellman et al., 1998) forms time-dependent gene expression profiles that are used to monitor transcriptomic variation during yeast cell cycles. • Yeast cells were arrested to the same cell cycle stage using four different synchronizing methods: α arrest (alpha), arrest of cdc15 or cdc28 temperature-sensitive mutant (cdc15 and cdc28), and elutriation (elu). • A total of 18, 24, 17 and 14 time points were considered for synchronization. • We matched up features across all four studies and filtered out features using standard deviation (i.e. SD ≤ 0.45, non- informative features with smaller variation) that left 1,025 features. Spellman’s Yeast dataset
- 37. Prostate cancer data with three class labels (normal, primary, metastasis) Library(MetaPCA) # Data preparation data(prostate) #There are currently 4 meta-pca methods. Run either one of following four. MetaPCA(prostate, method="Angle", doPreprocess=FALSE)
- 38. #Plotting four data on the common PC space coord <- foreach(dd=iter(metaPC$x), .combine=rbind) %do% dd$coord PlotPC2D(coord[,1:2], drawEllipse=F, dataset.name="Prostate", .class.order= c("Metastasis","Primary","Normal"), .class.color=c("red", "#838383", "blue"), .annotation=T, newPlot=T,.class2=rep(names(metaPC$x), times=sapply(metaPC$x,function(x)nrow(x$coord))), .class2.order=names(metaPC$x), .points.size=1)
- 39. Spellman, 1998 Yeast cell cycle data set #Consider each synchronization method as a separate data # Calling packages install.packages("MetaPCA") library(MetaPCA) # Data preparation data(Spellman) # Perform individual PCAs pc <- list(alpha=prcomp(t(Spellman$alpha))$x, cdc15=prcomp(t(Spellman$cdc15))$x, cdc28=prcomp(t(Spellman$cdc28))$x, elu=prcomp(t(Spellman$elu))$x) #There are currently 4 meta-pca methods. Run either one of following four. MetaPCA(Spellman, method="Eigen", doPreprocess=FALSE)