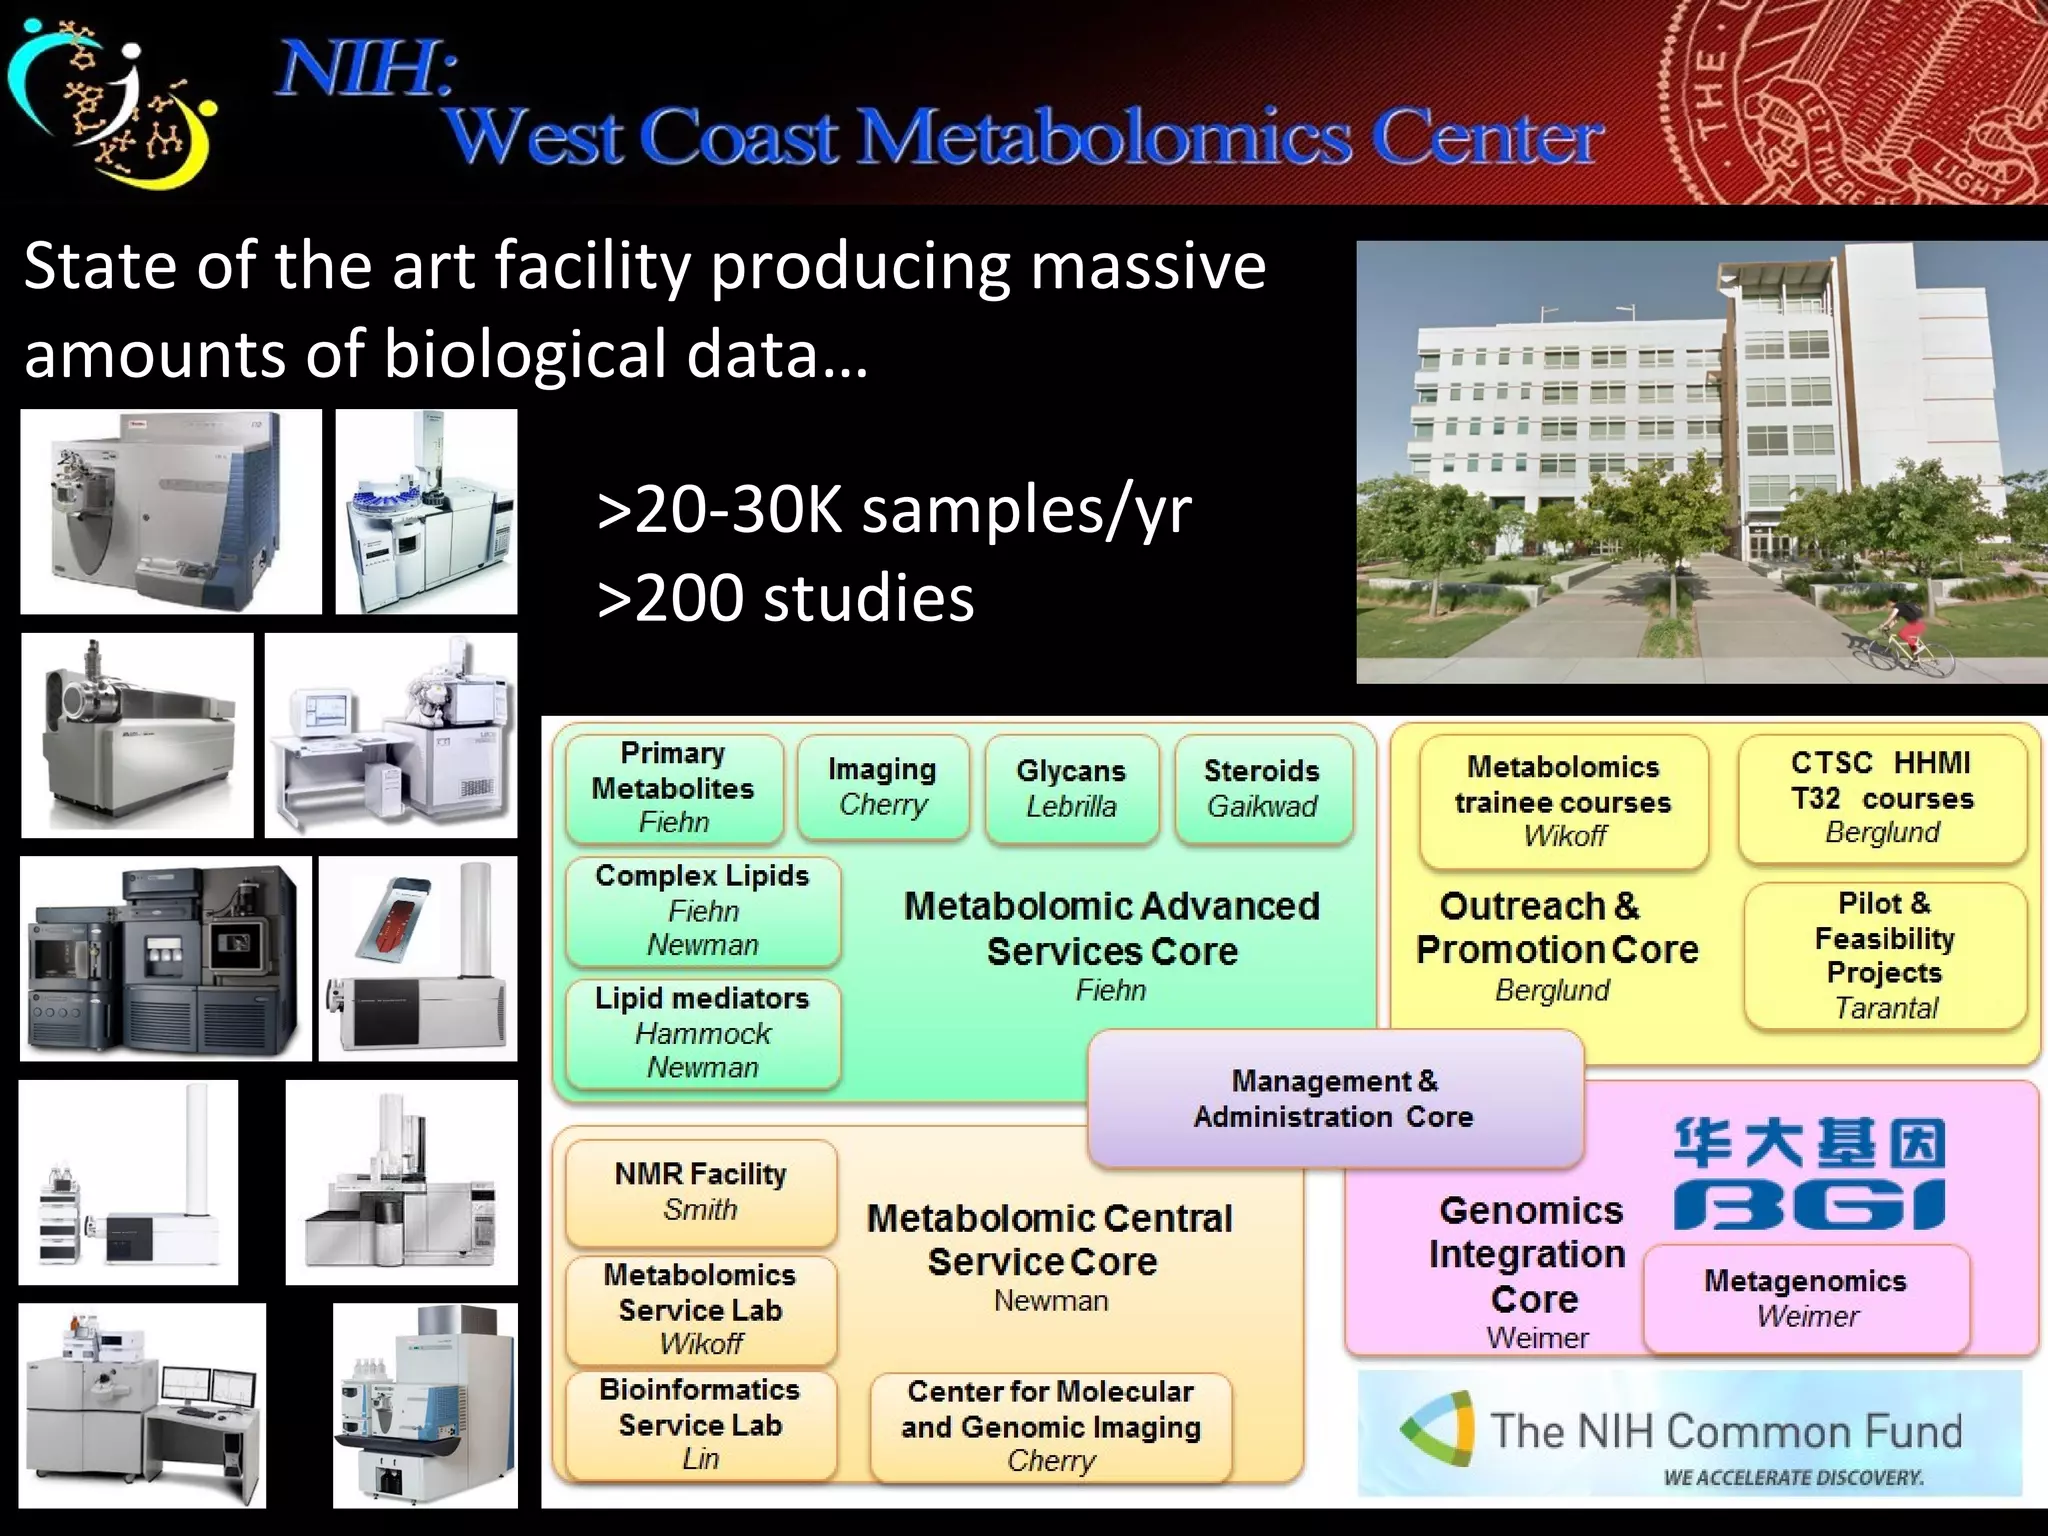
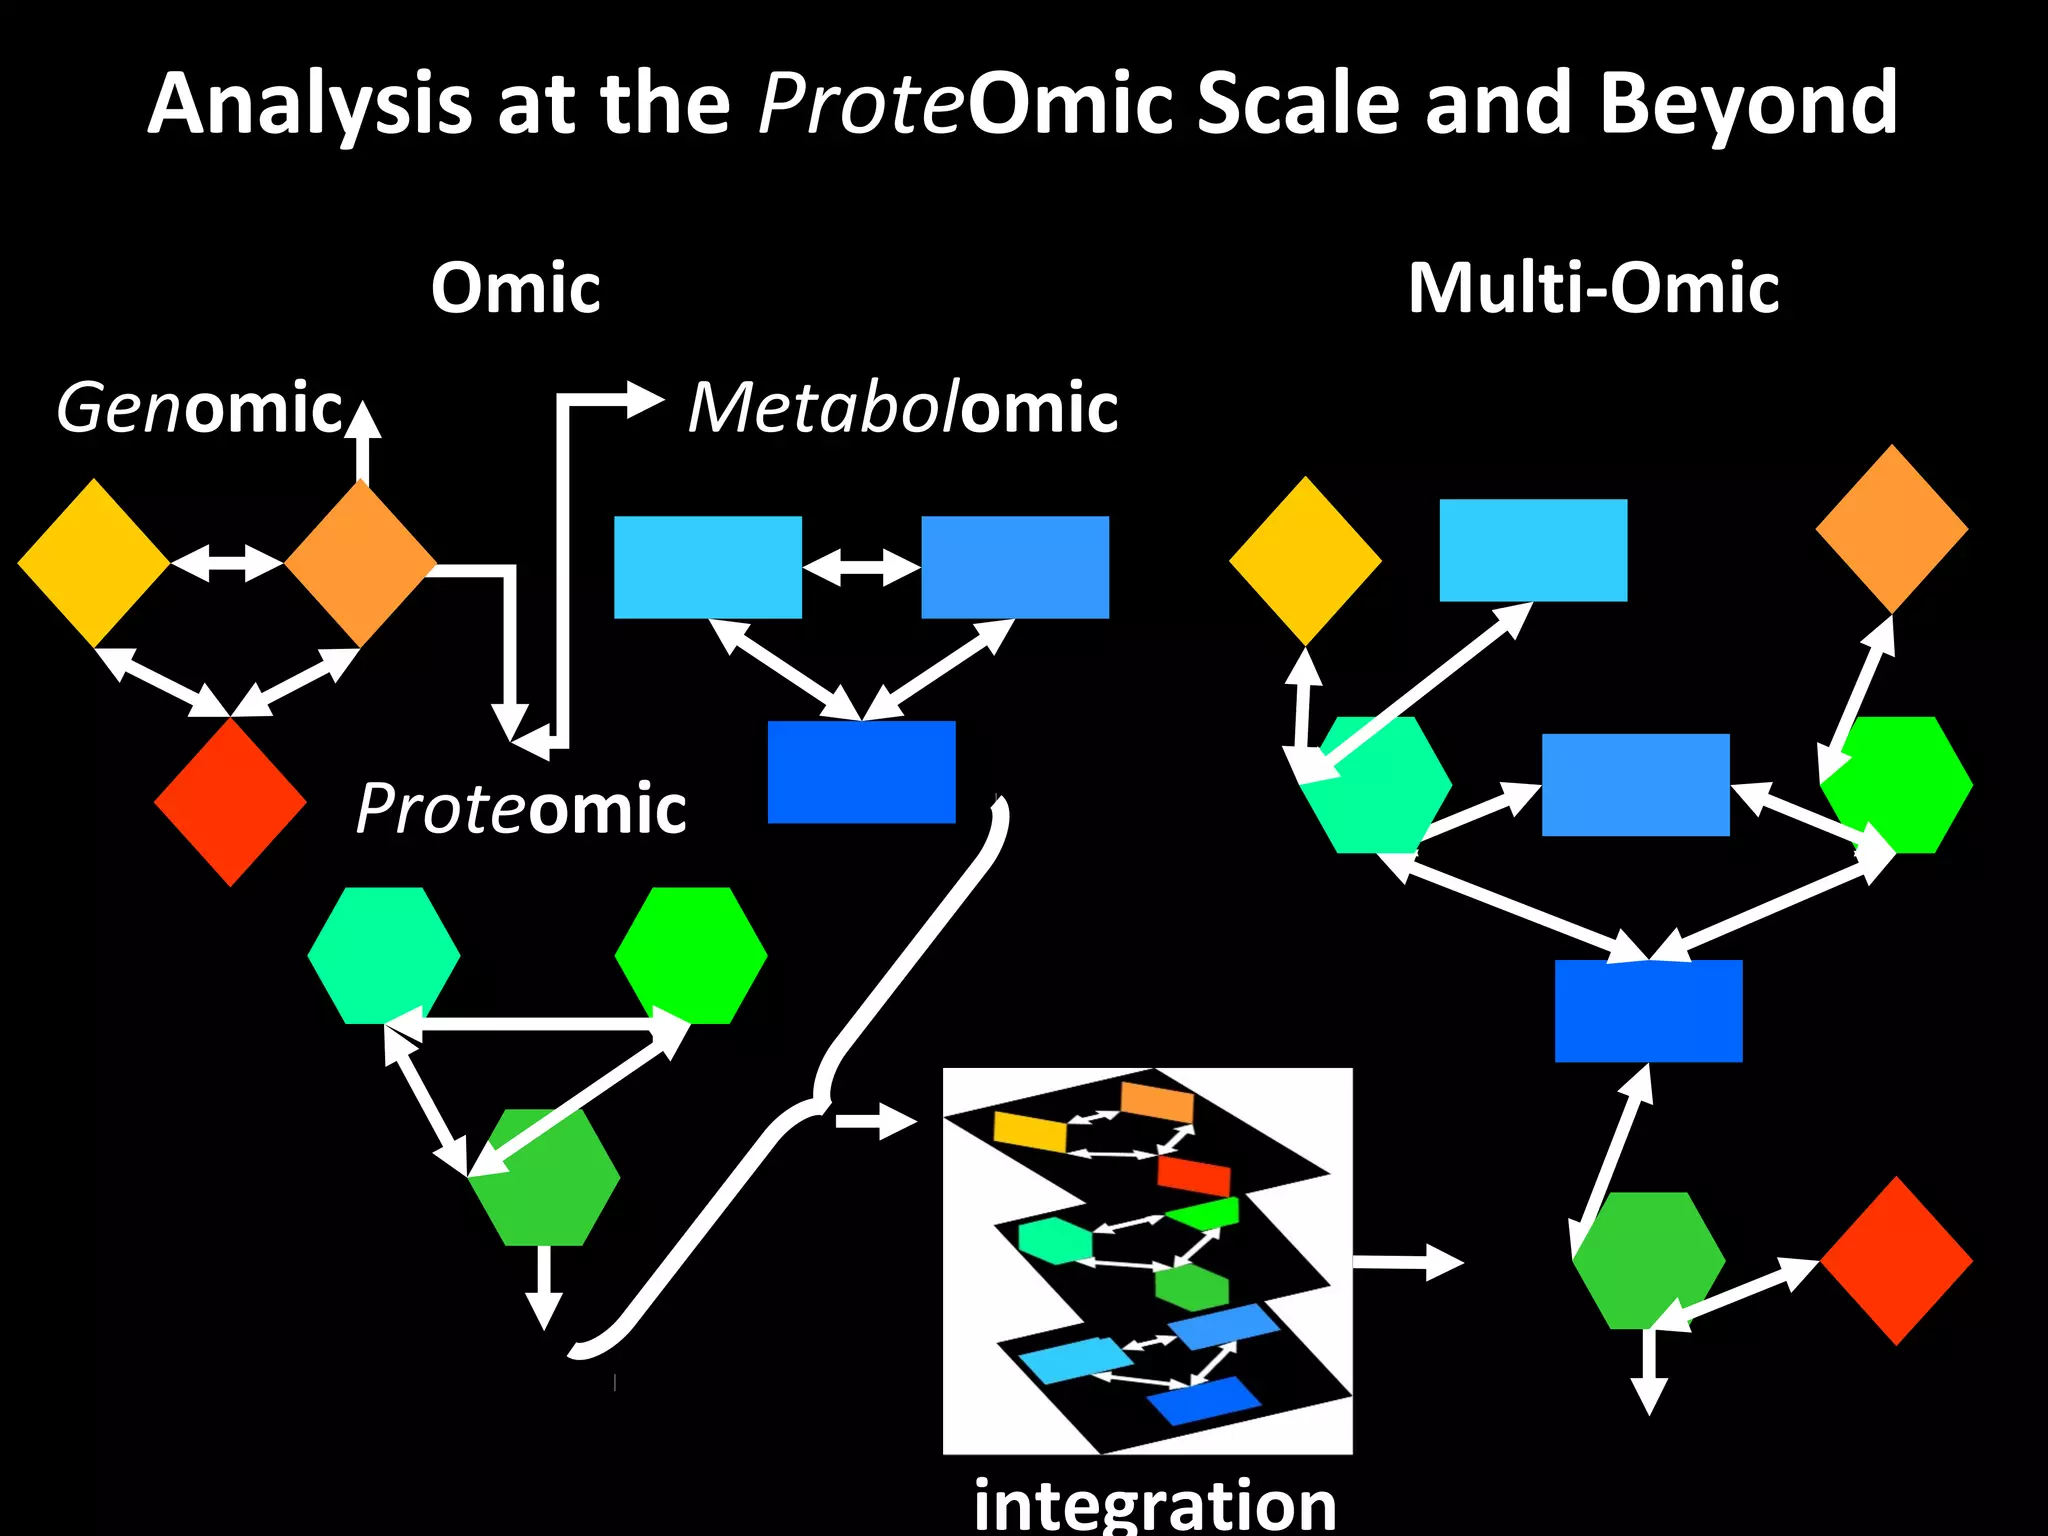
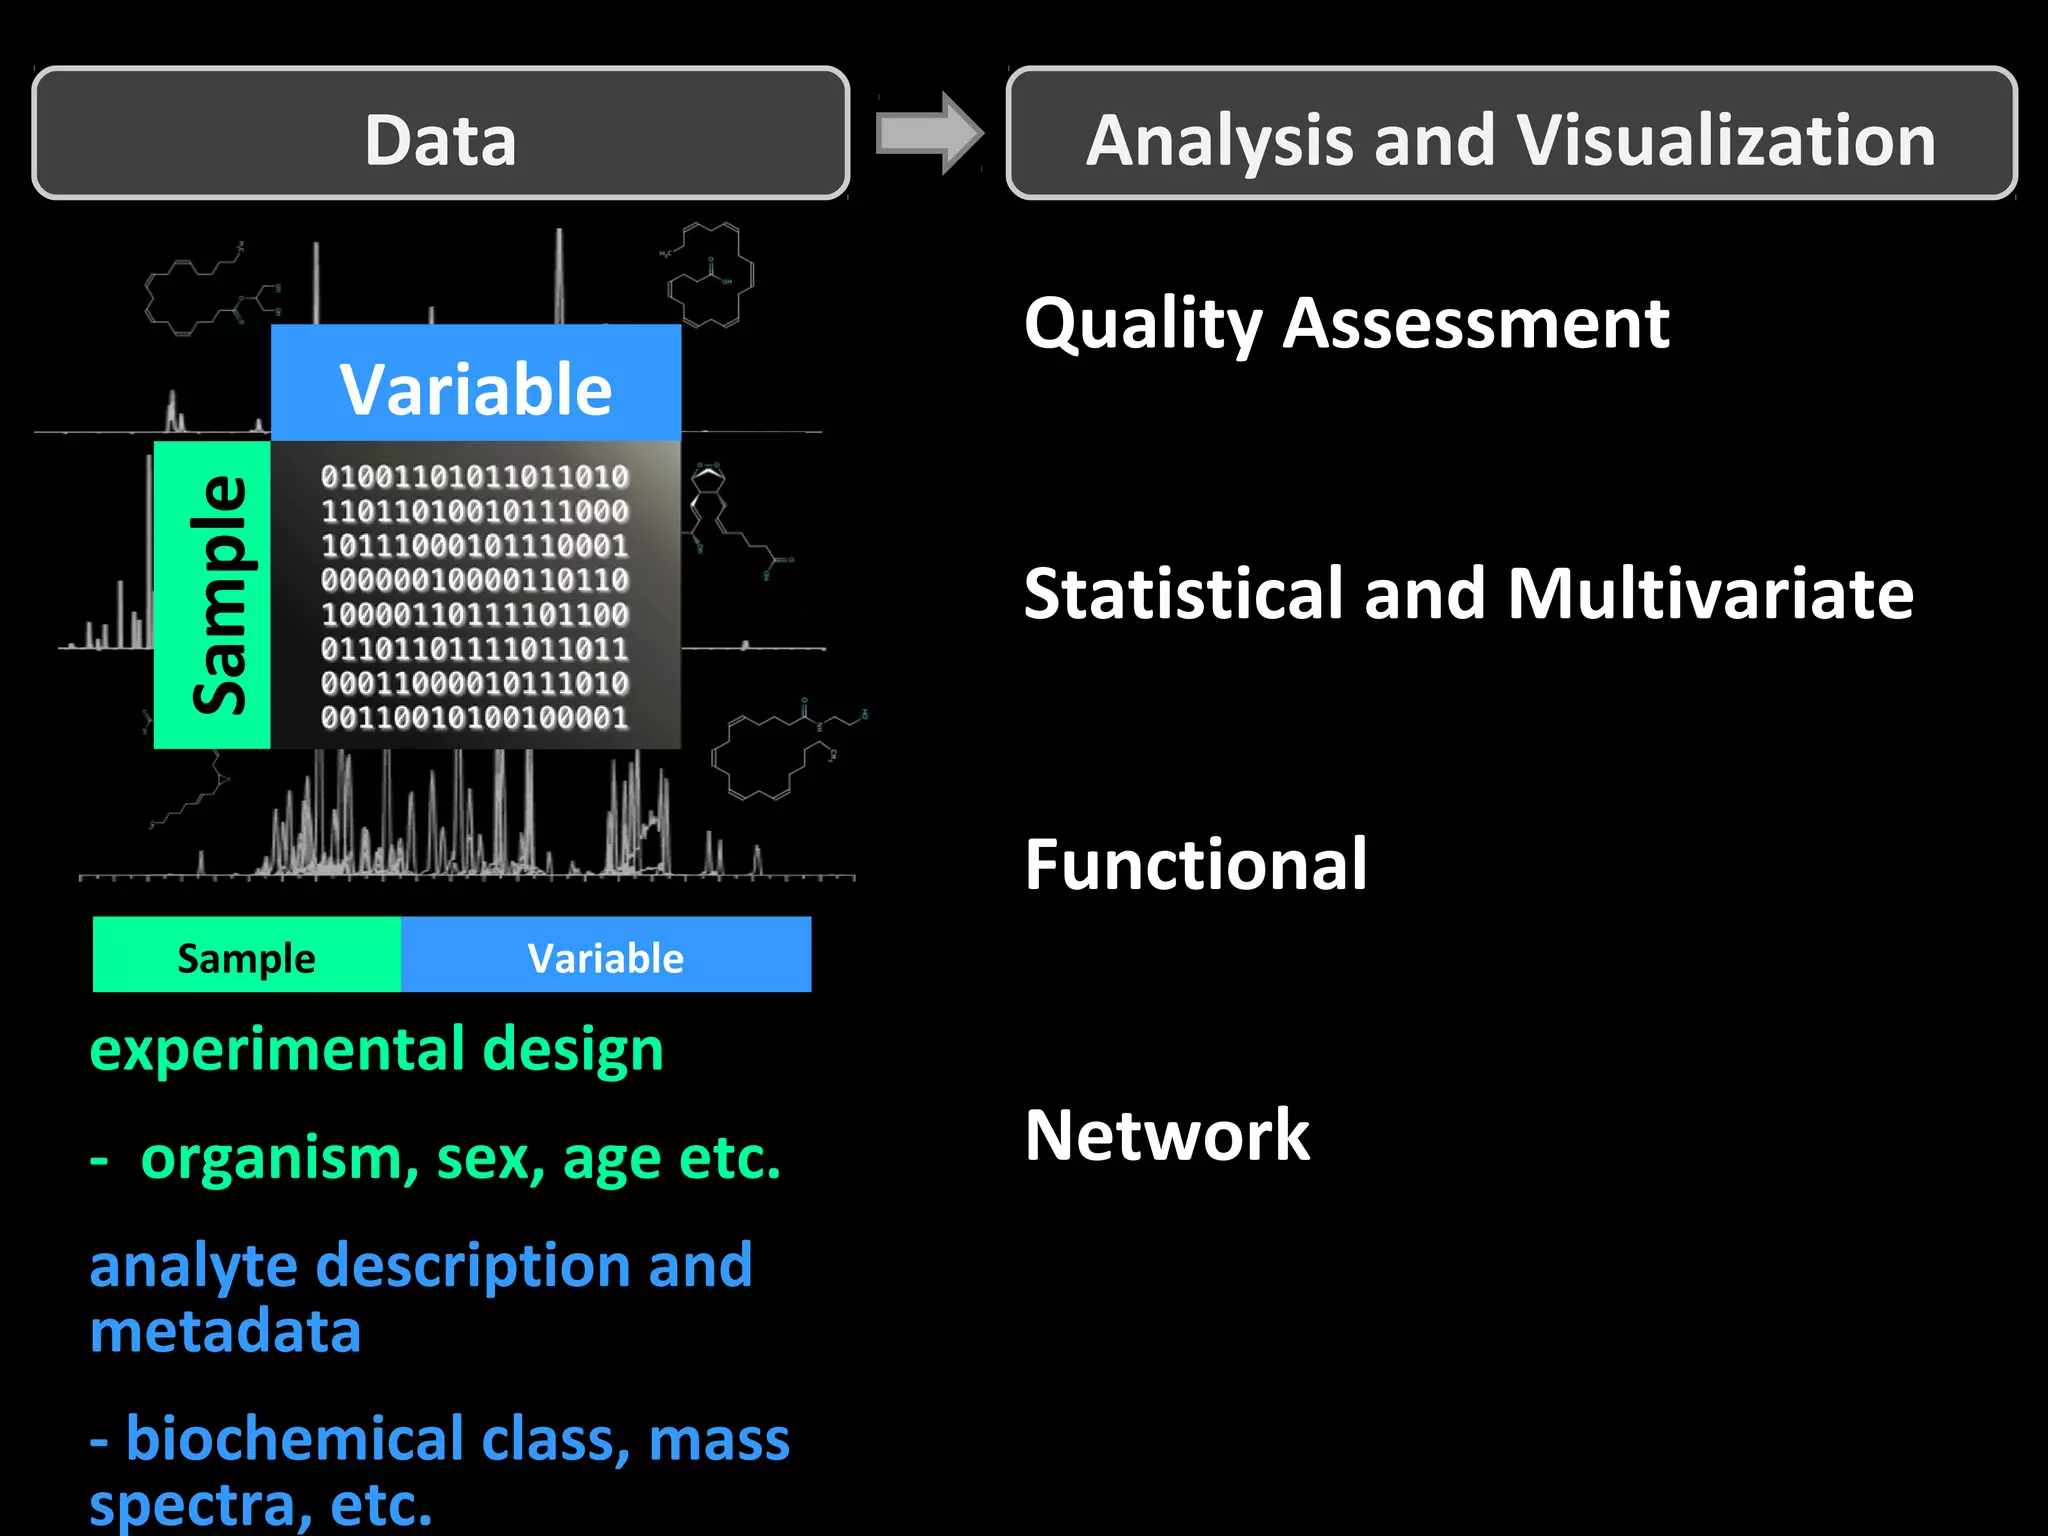
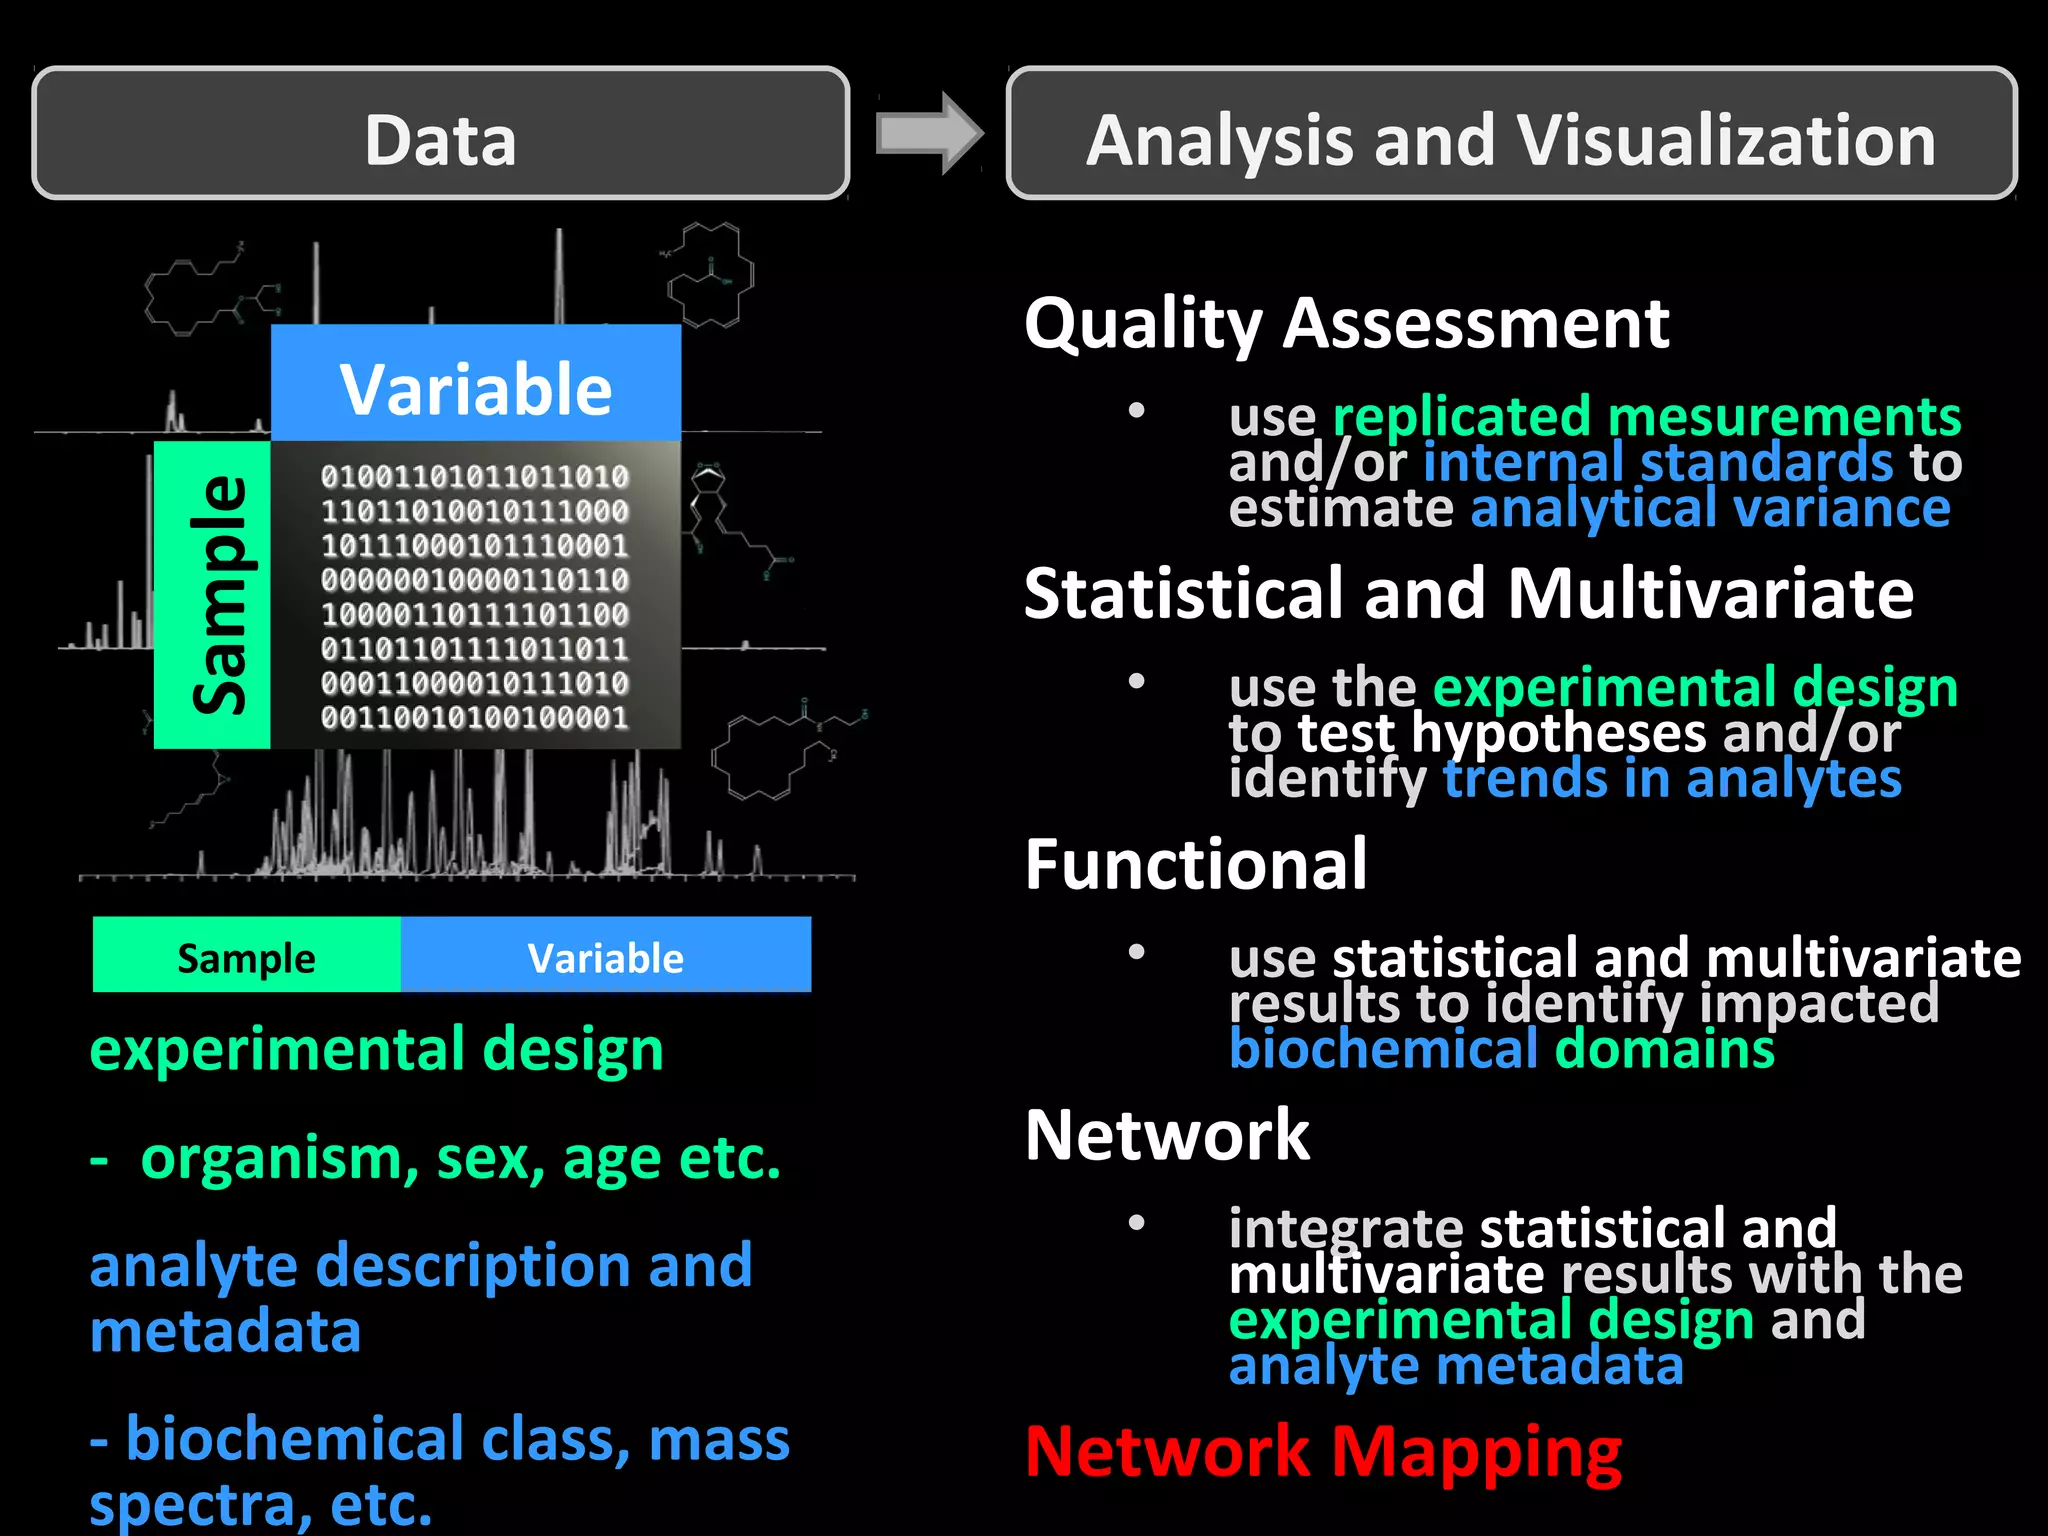
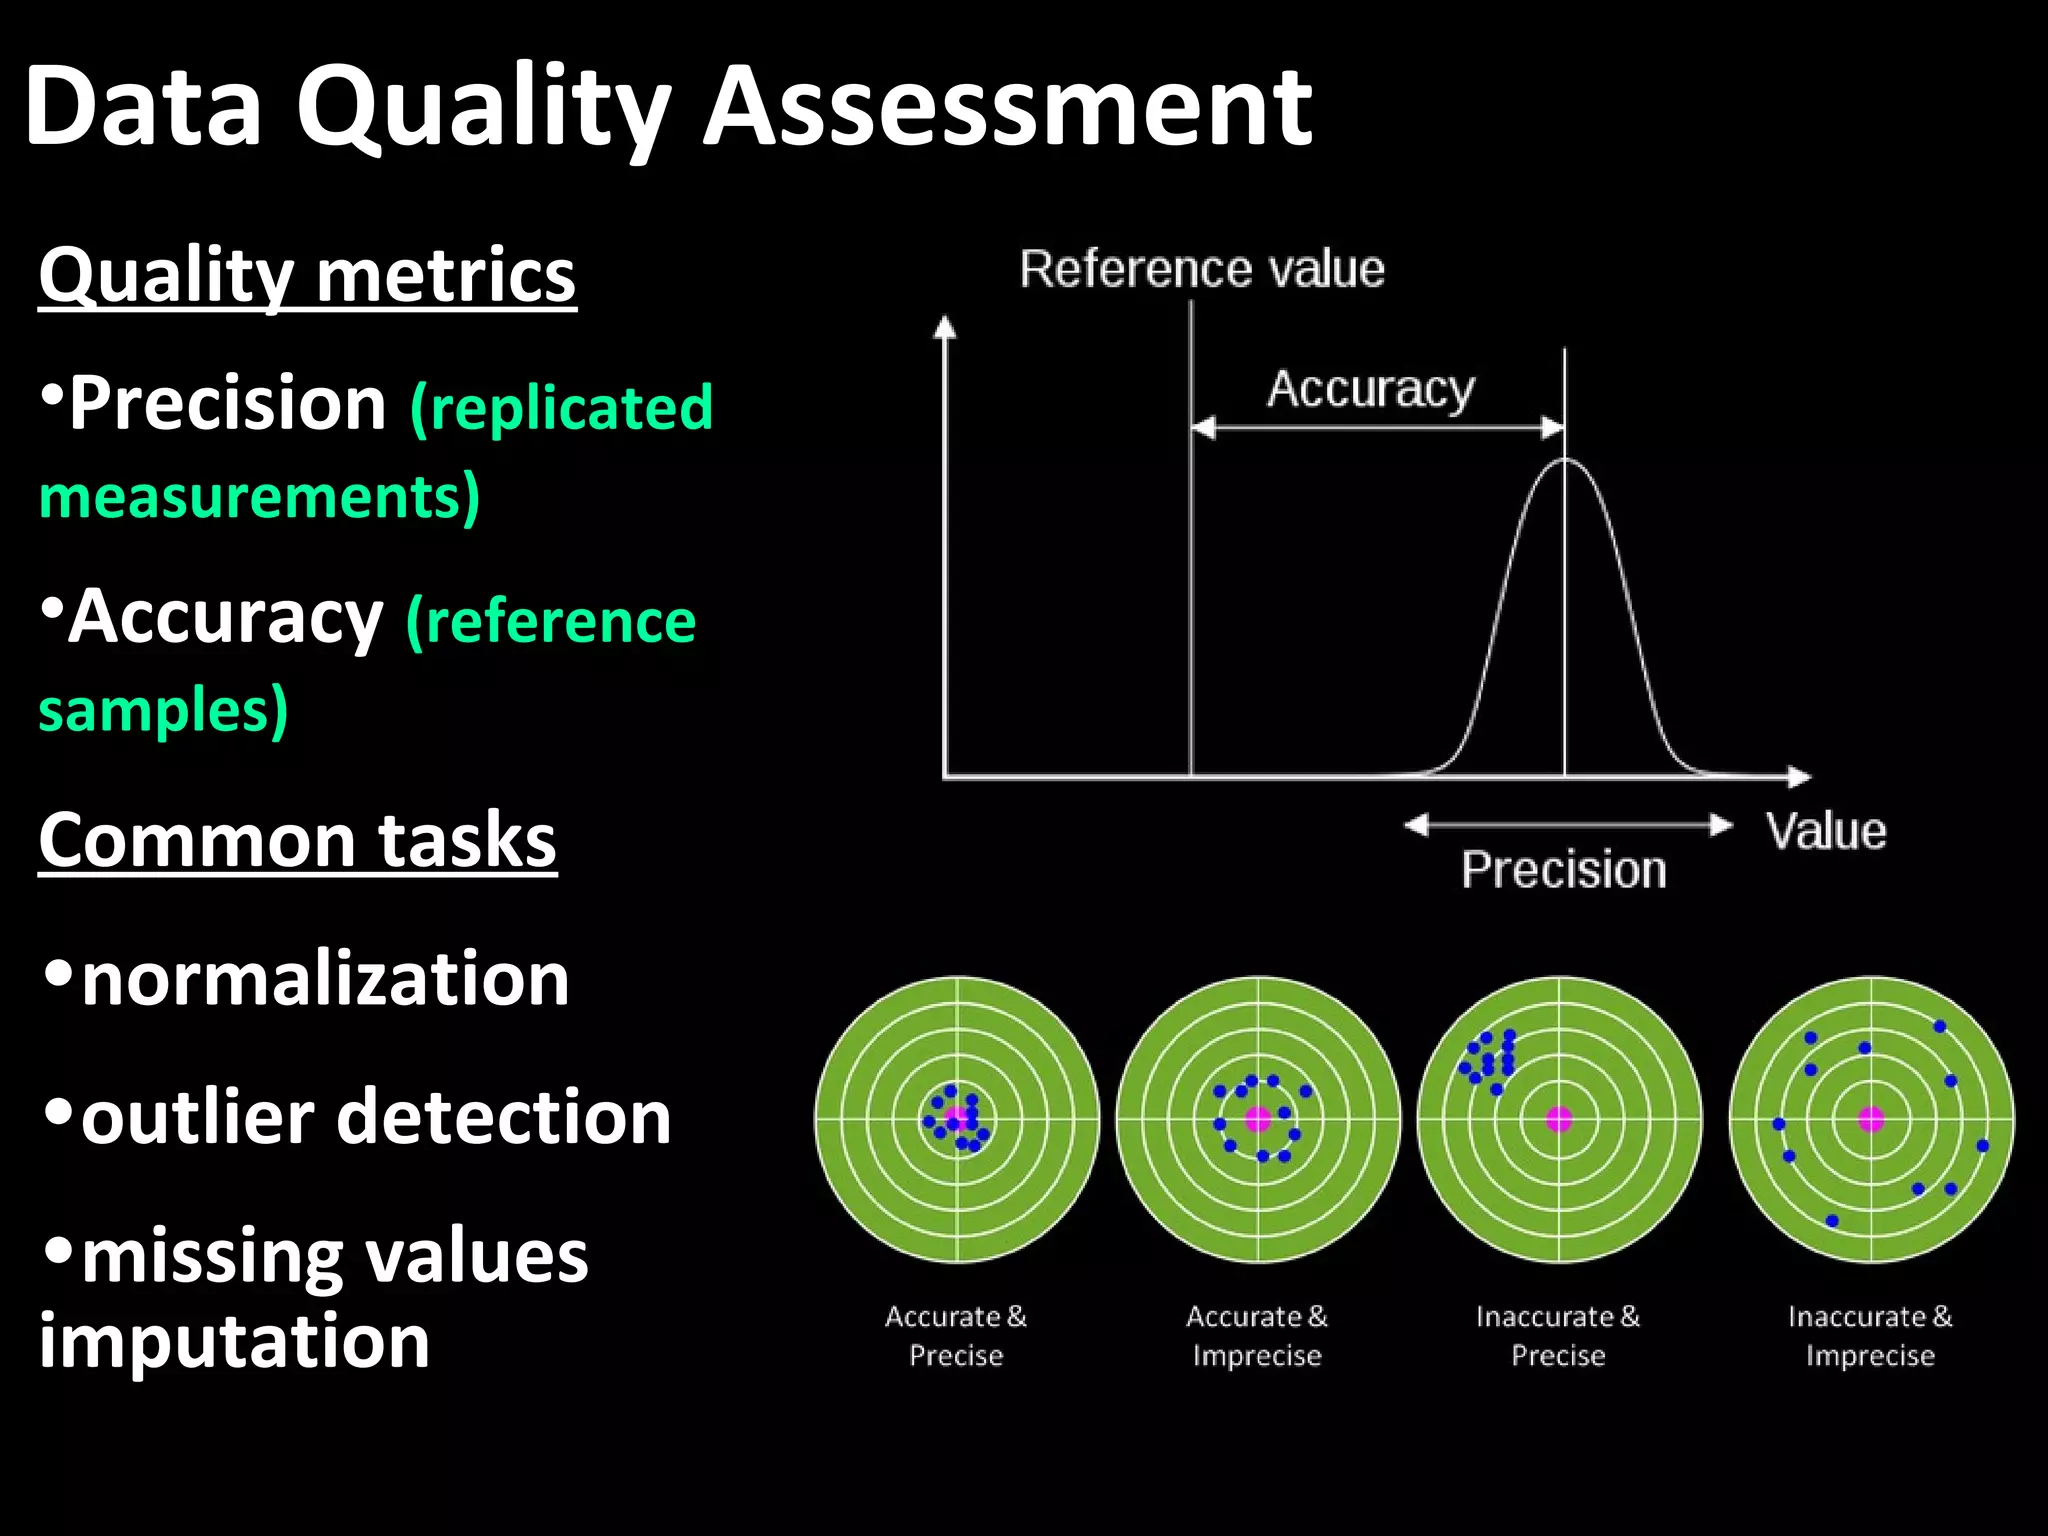
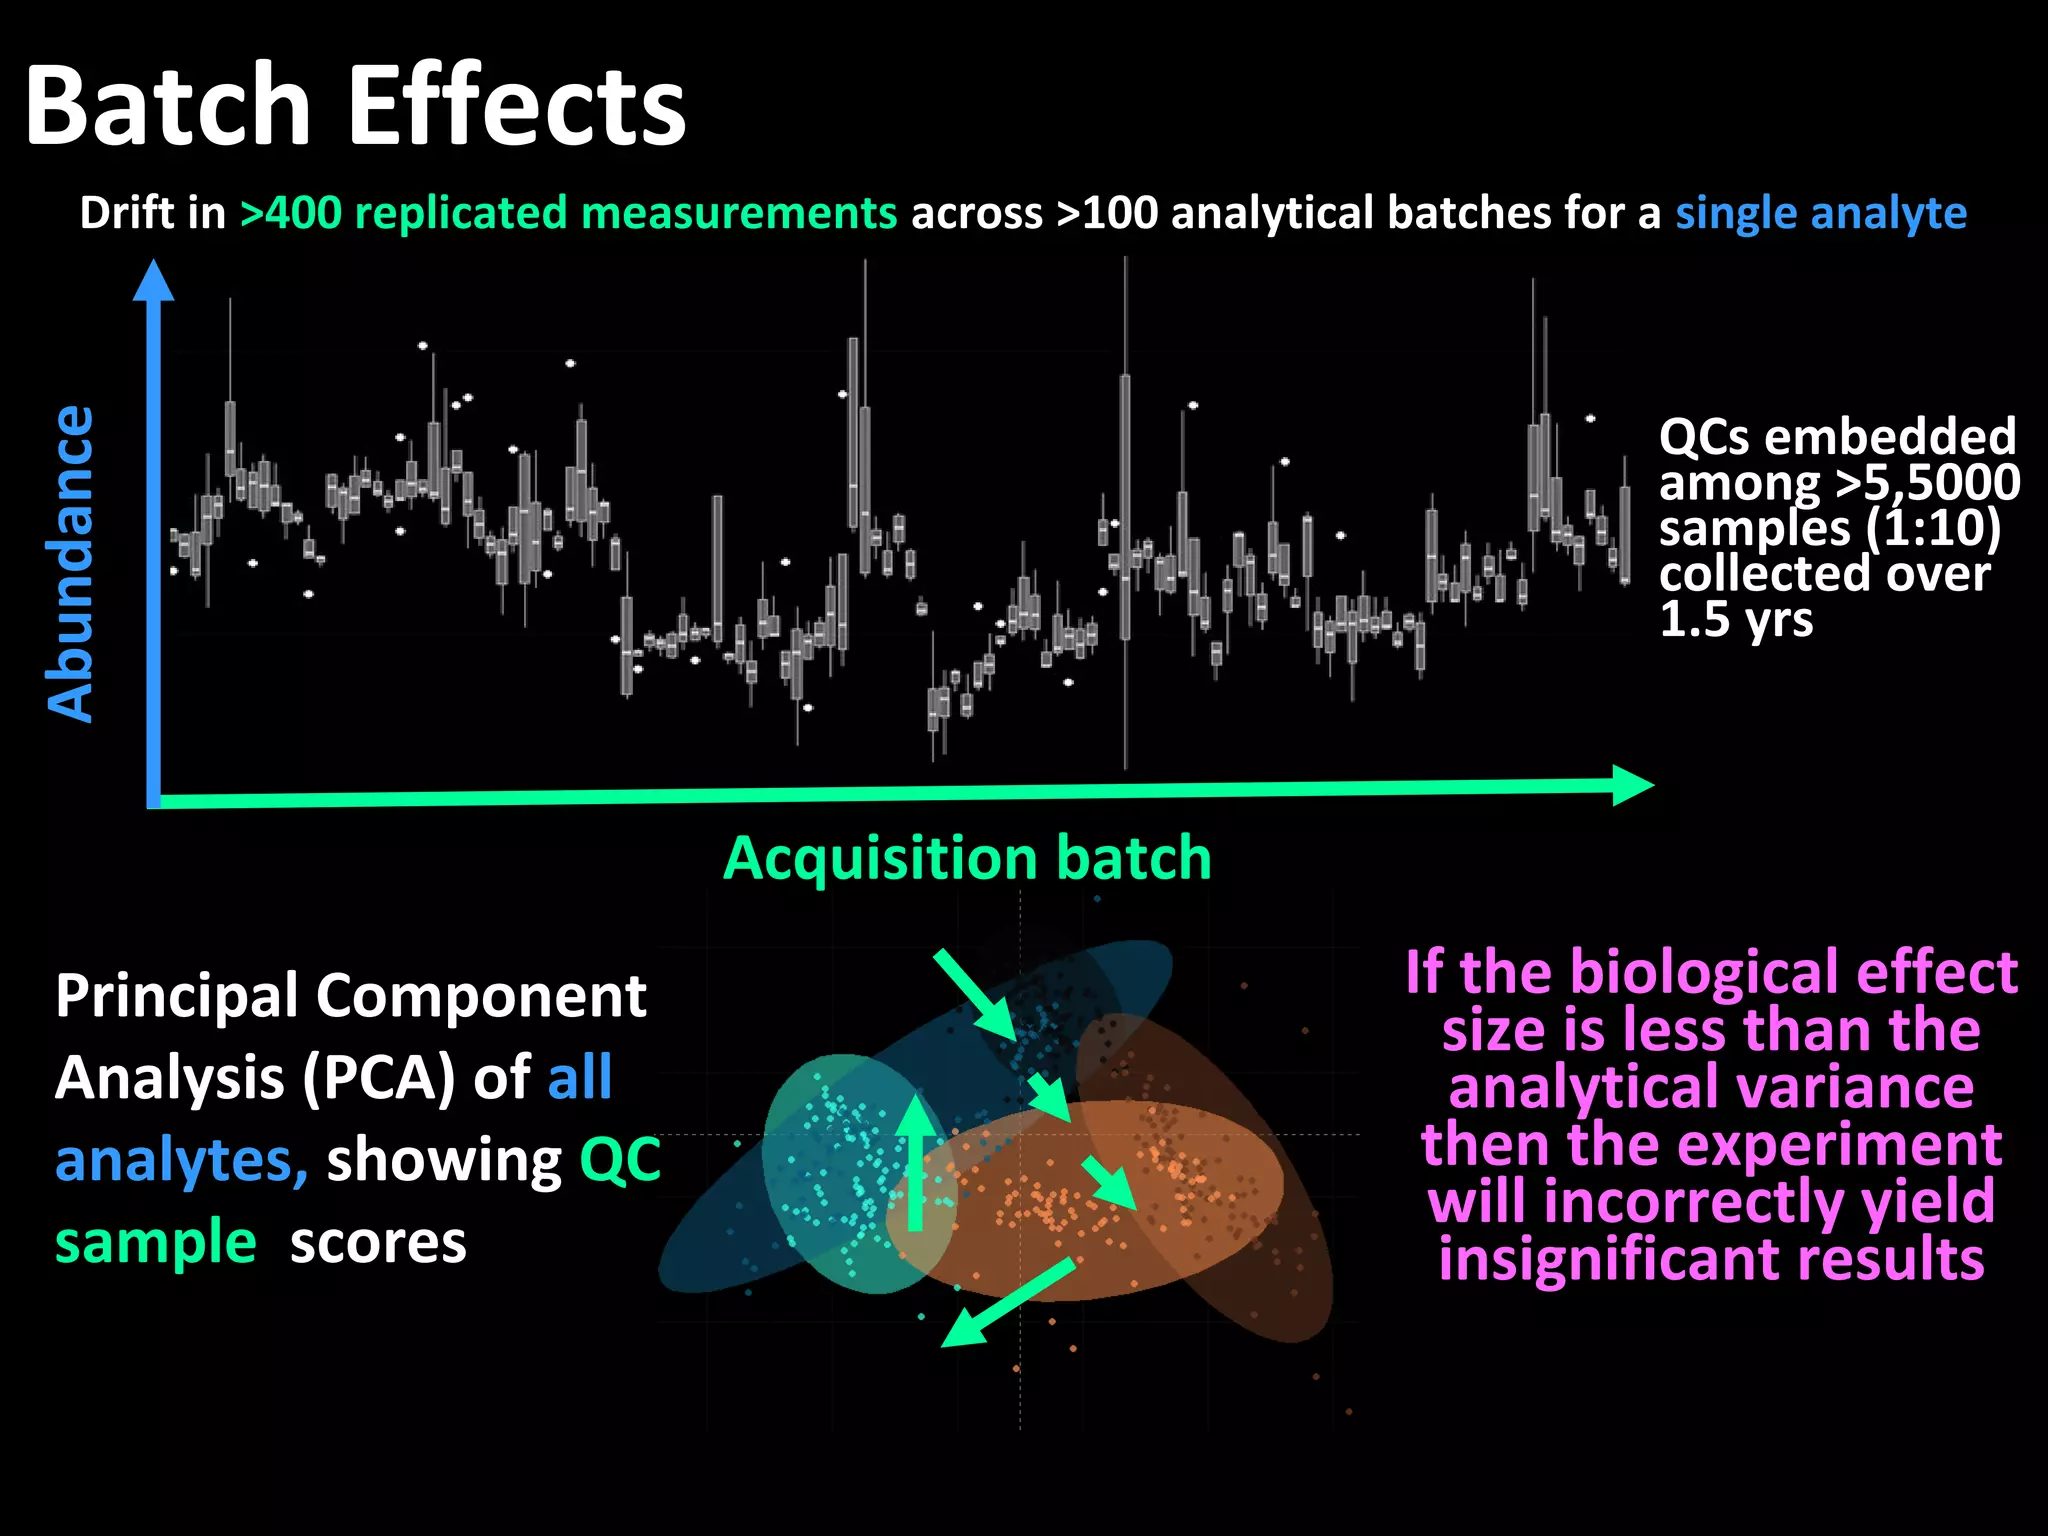
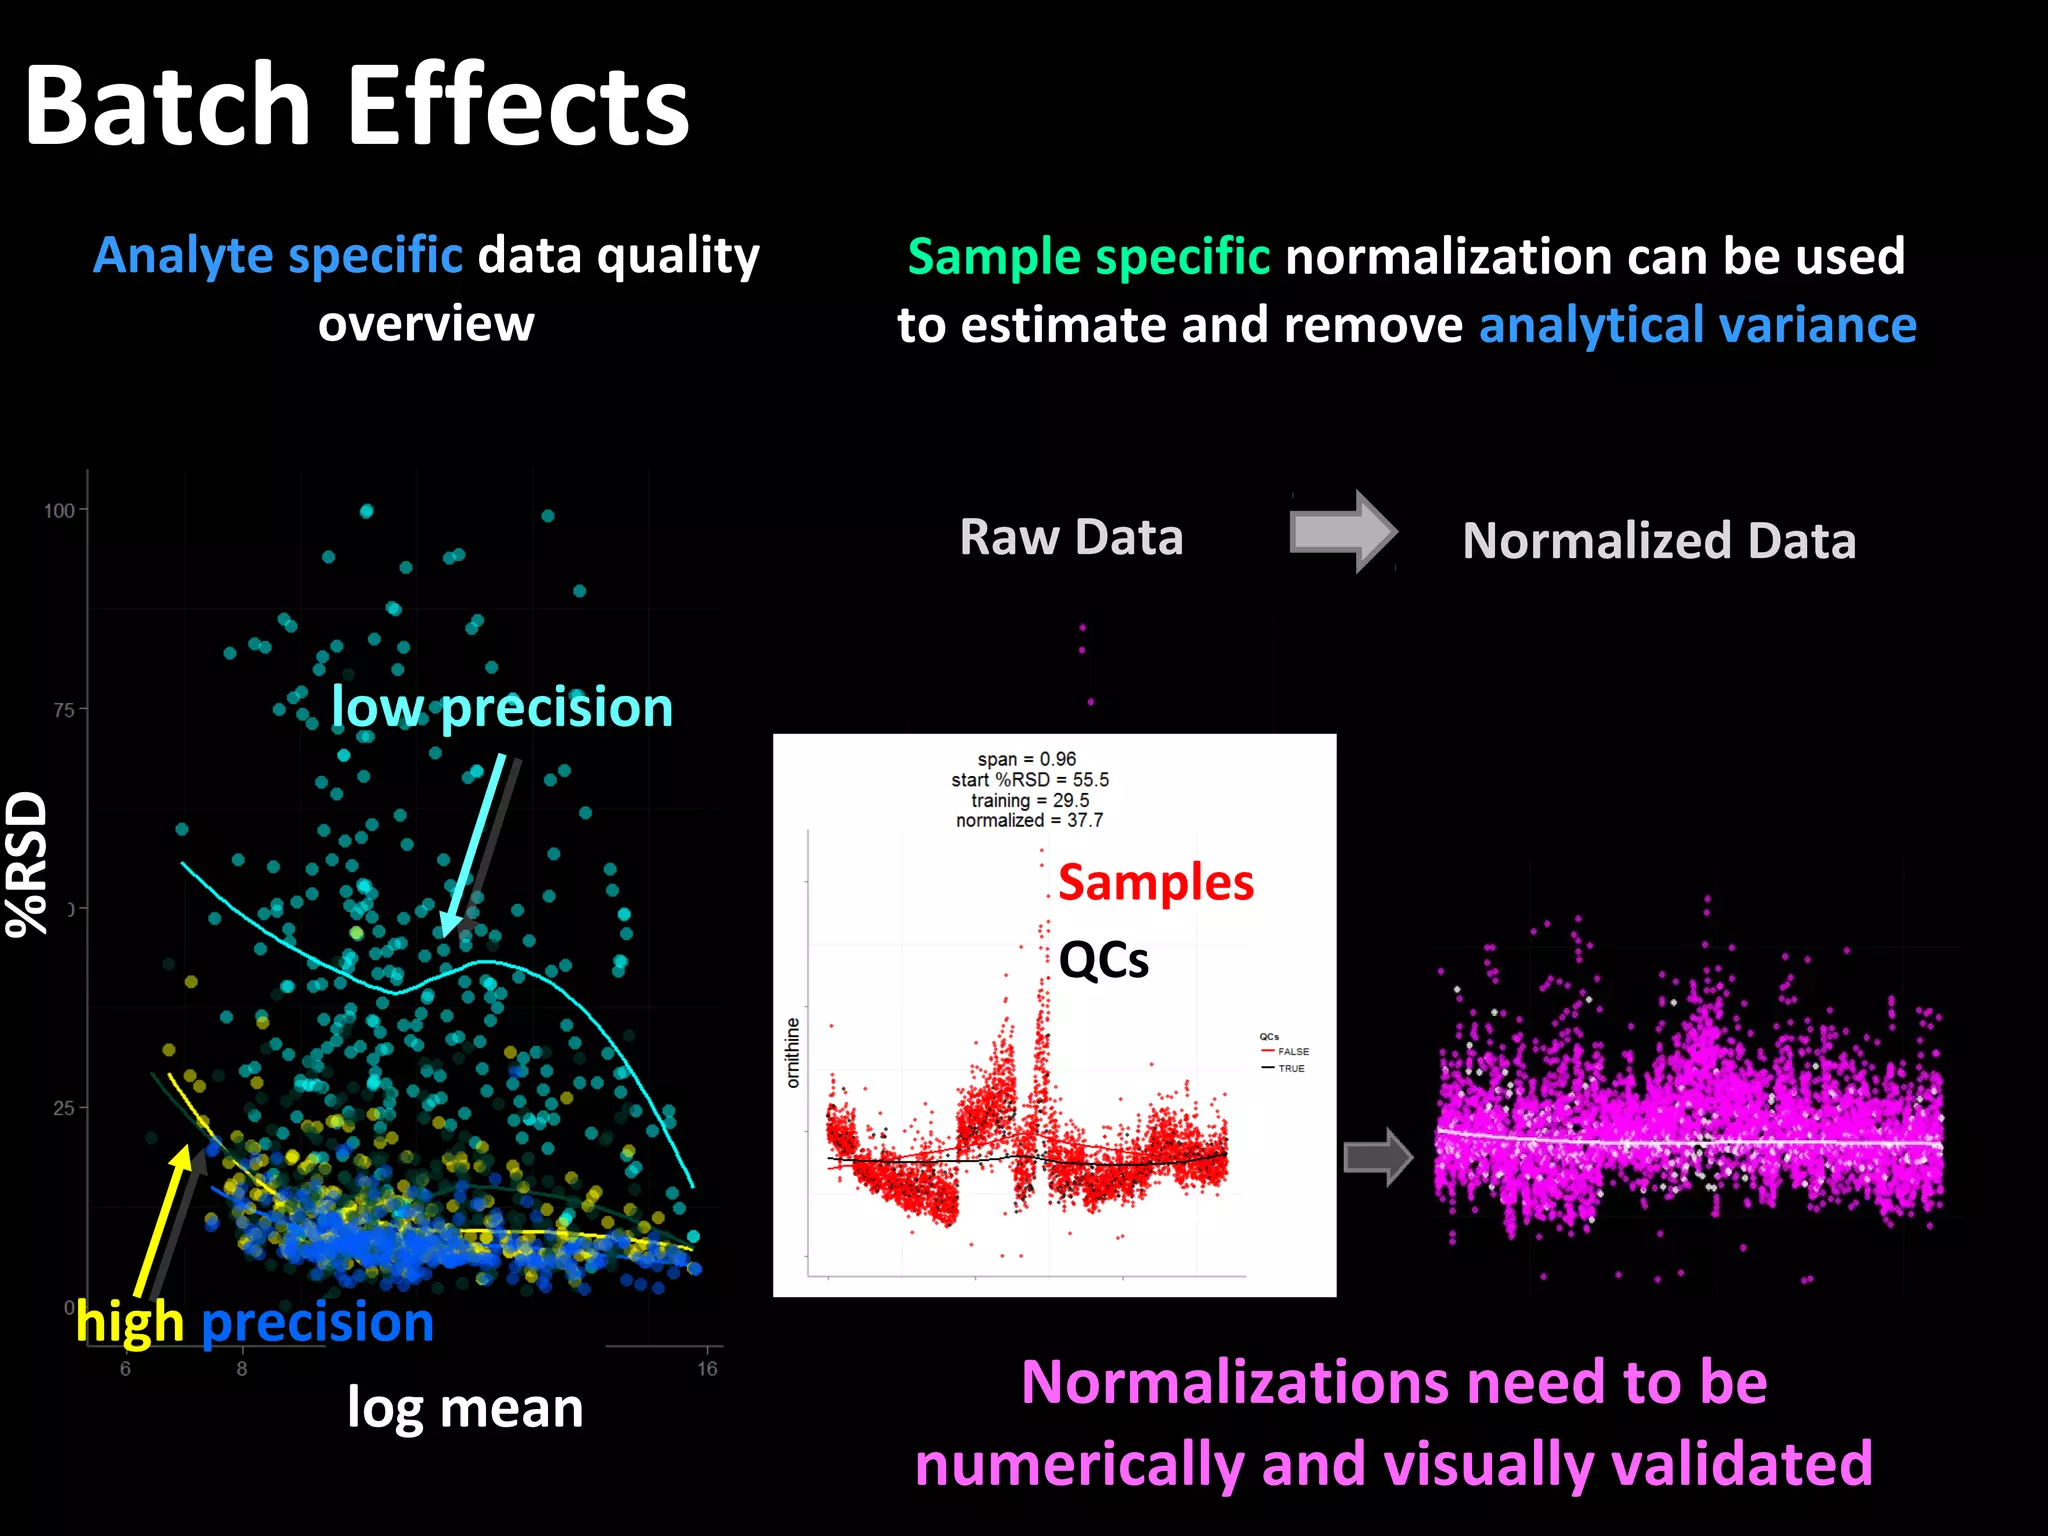
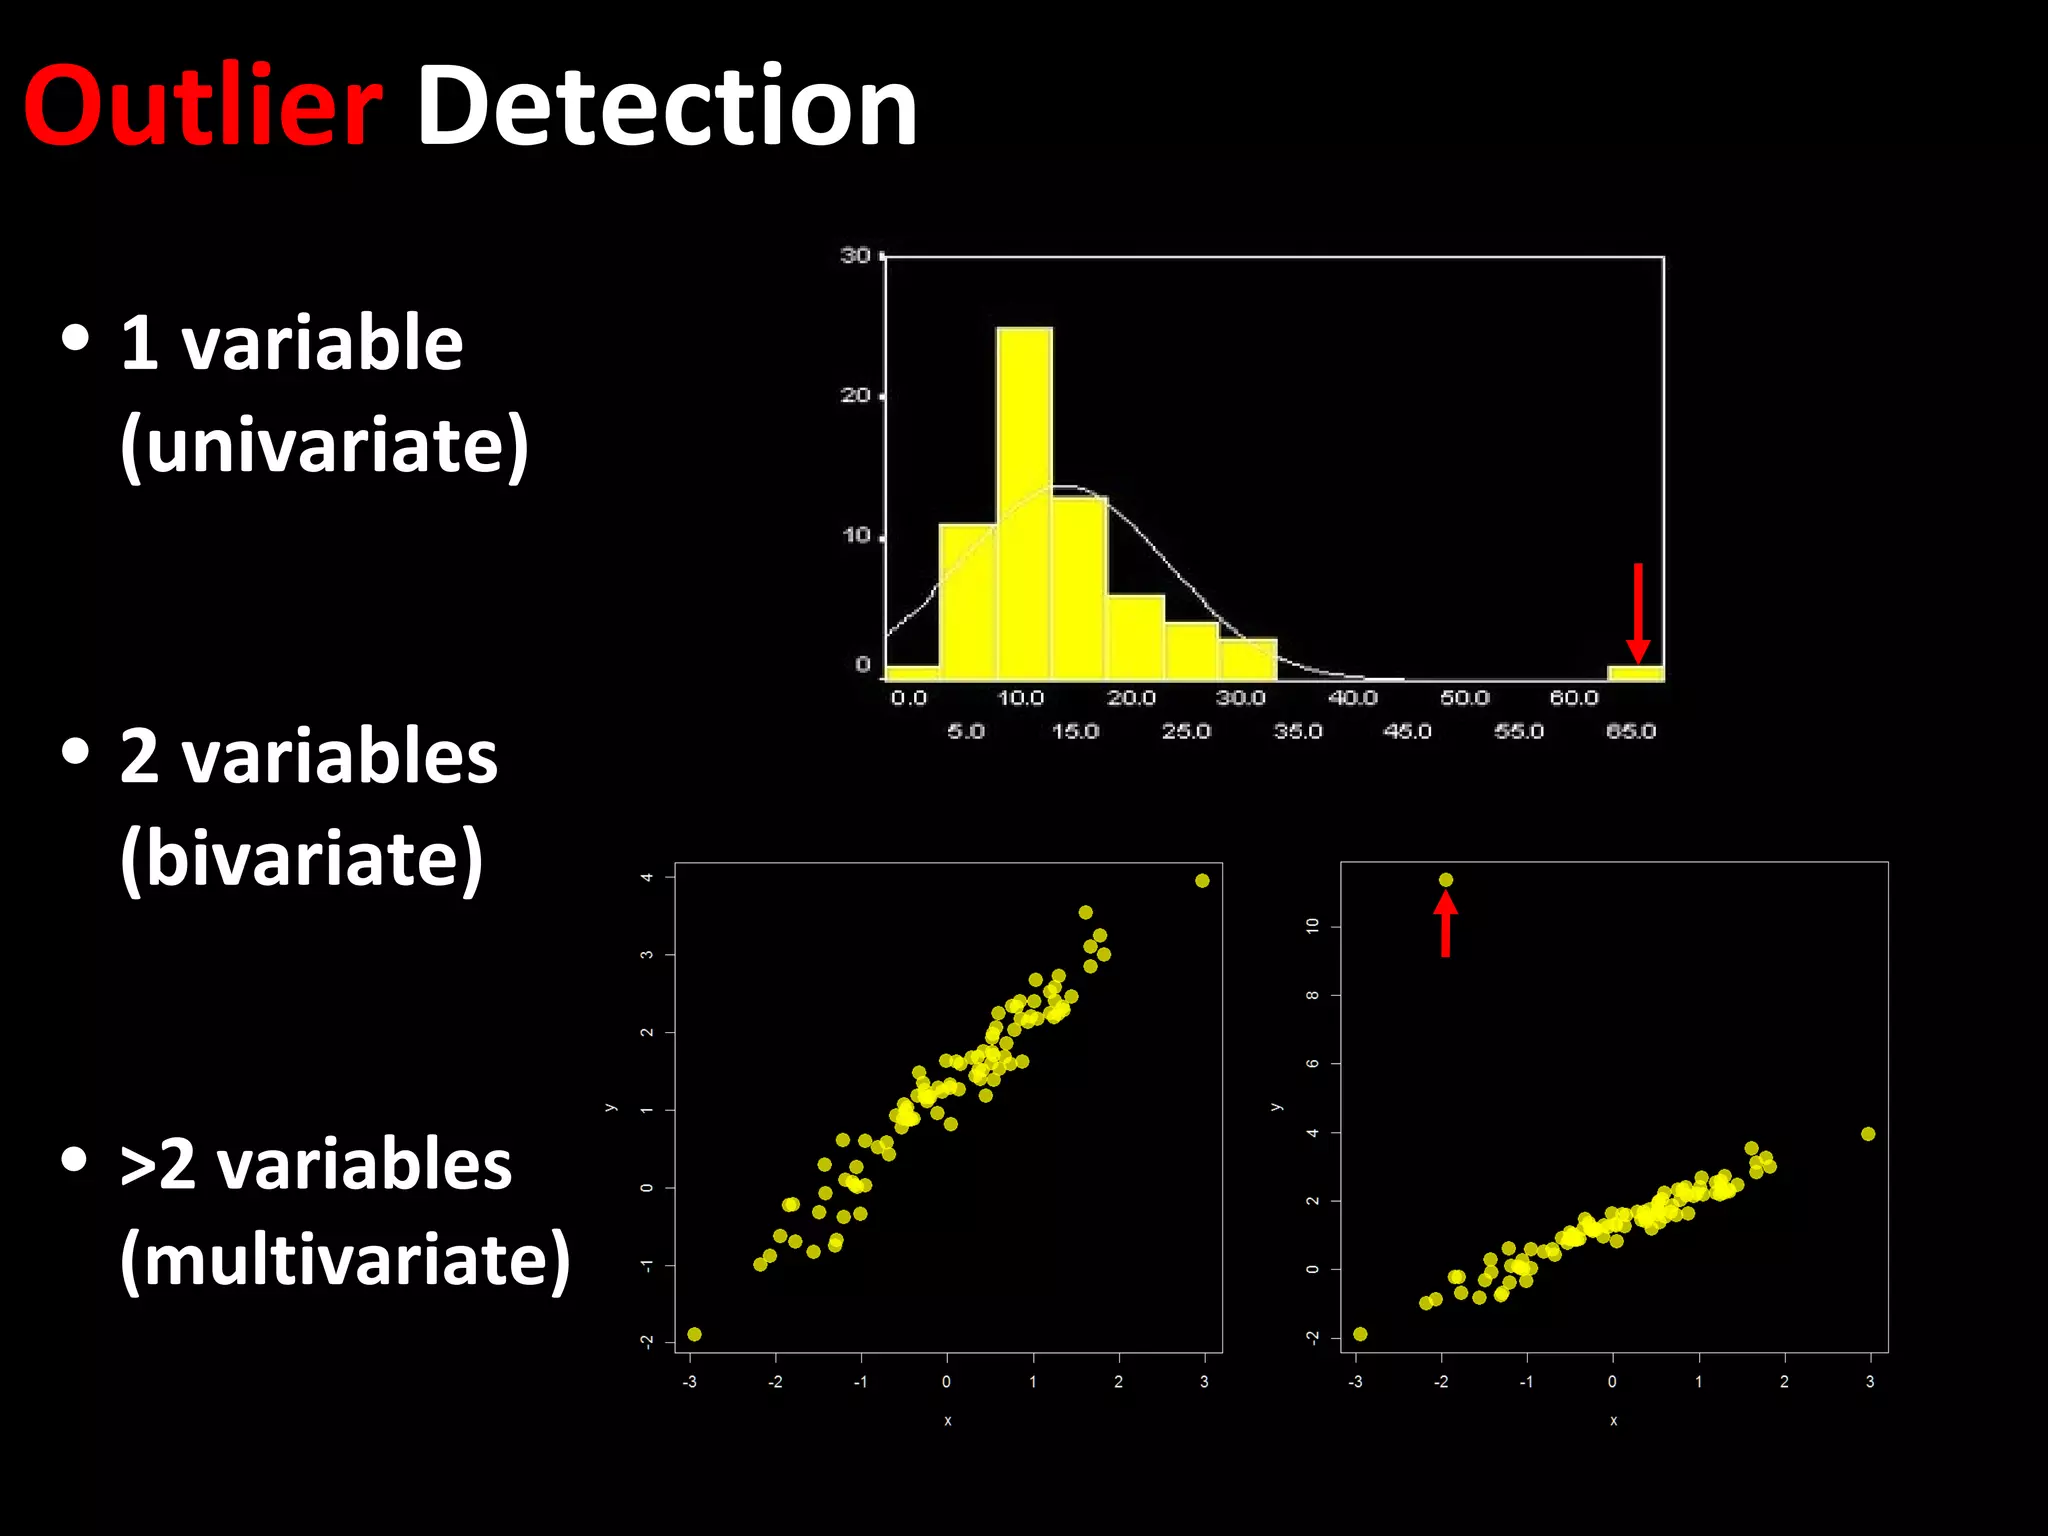
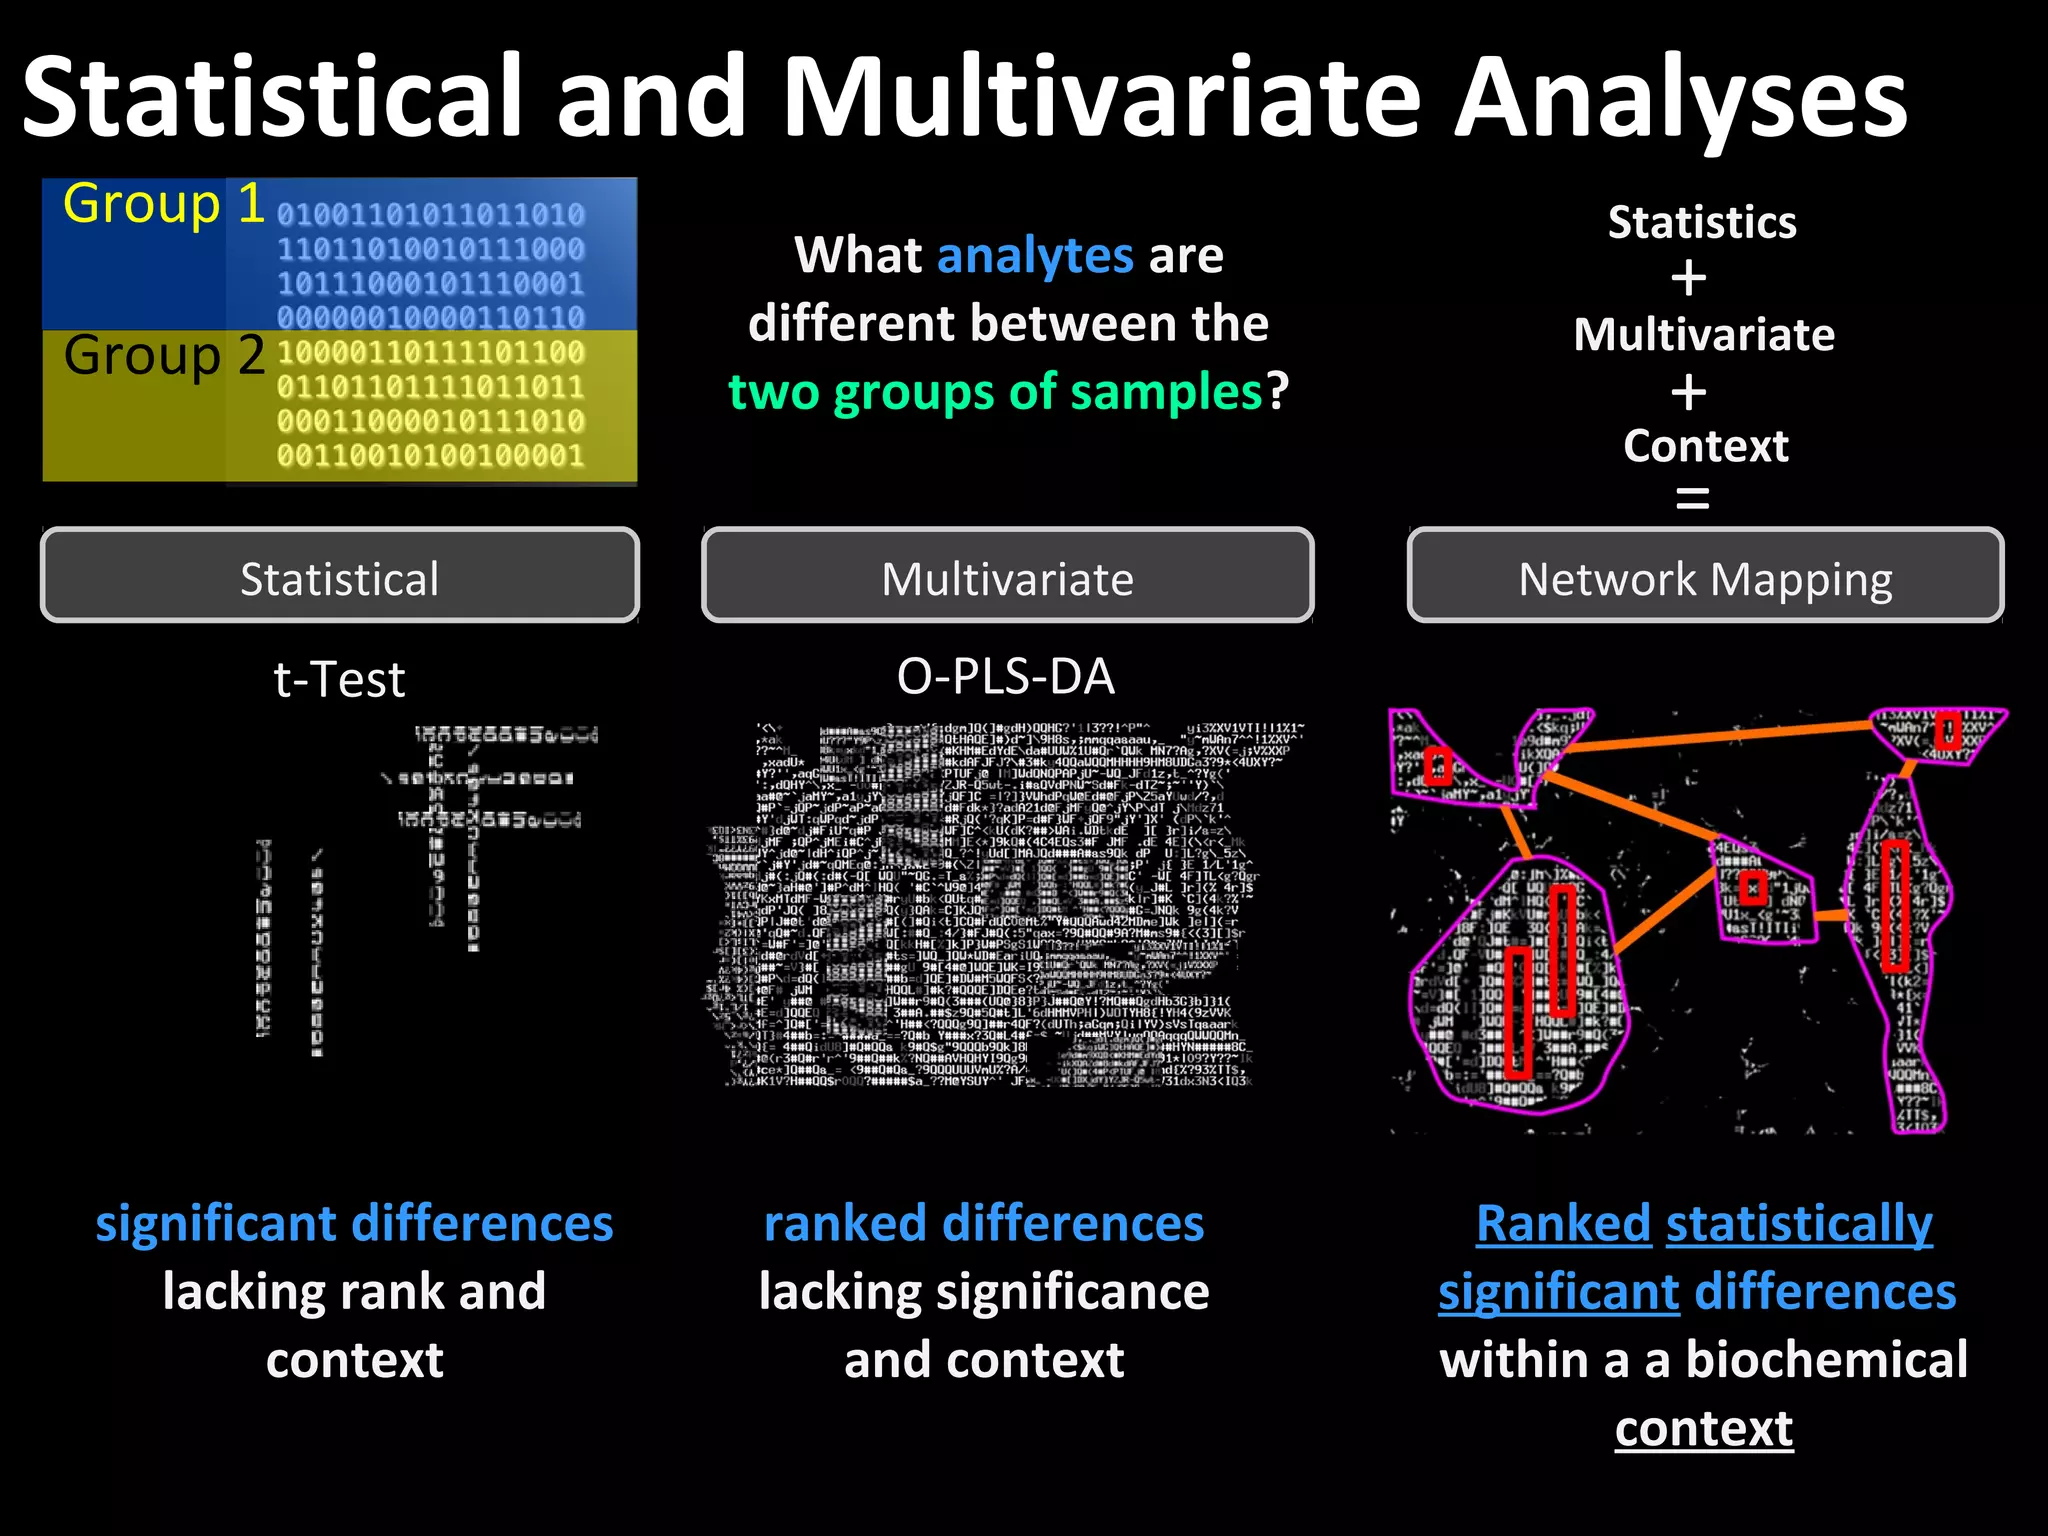
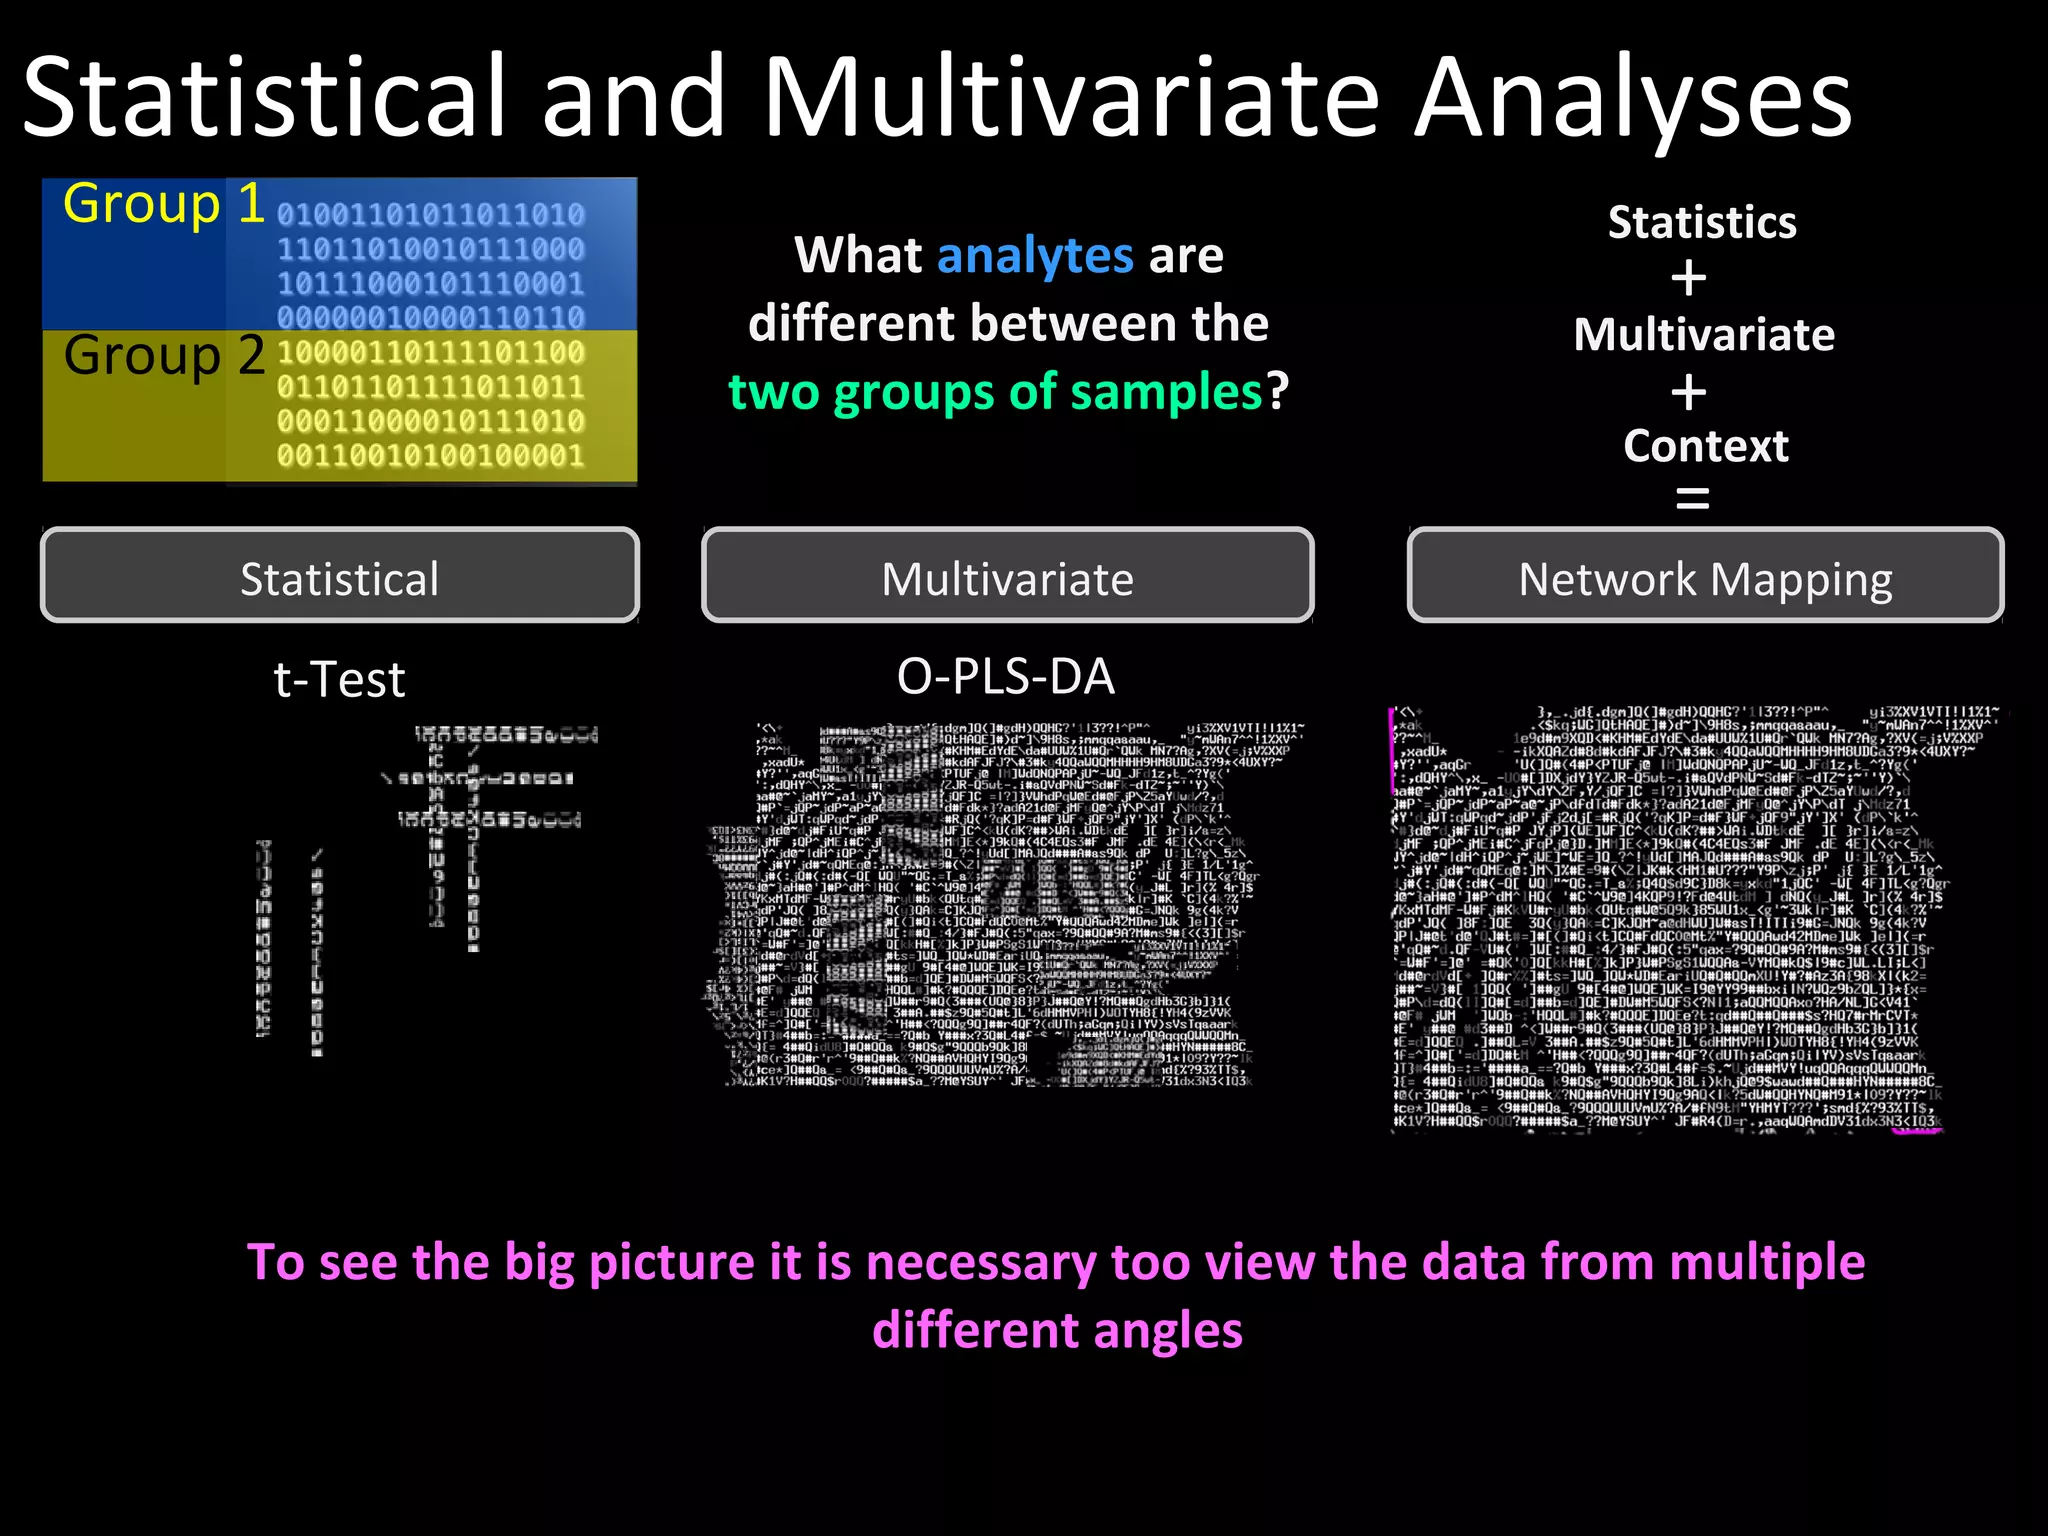
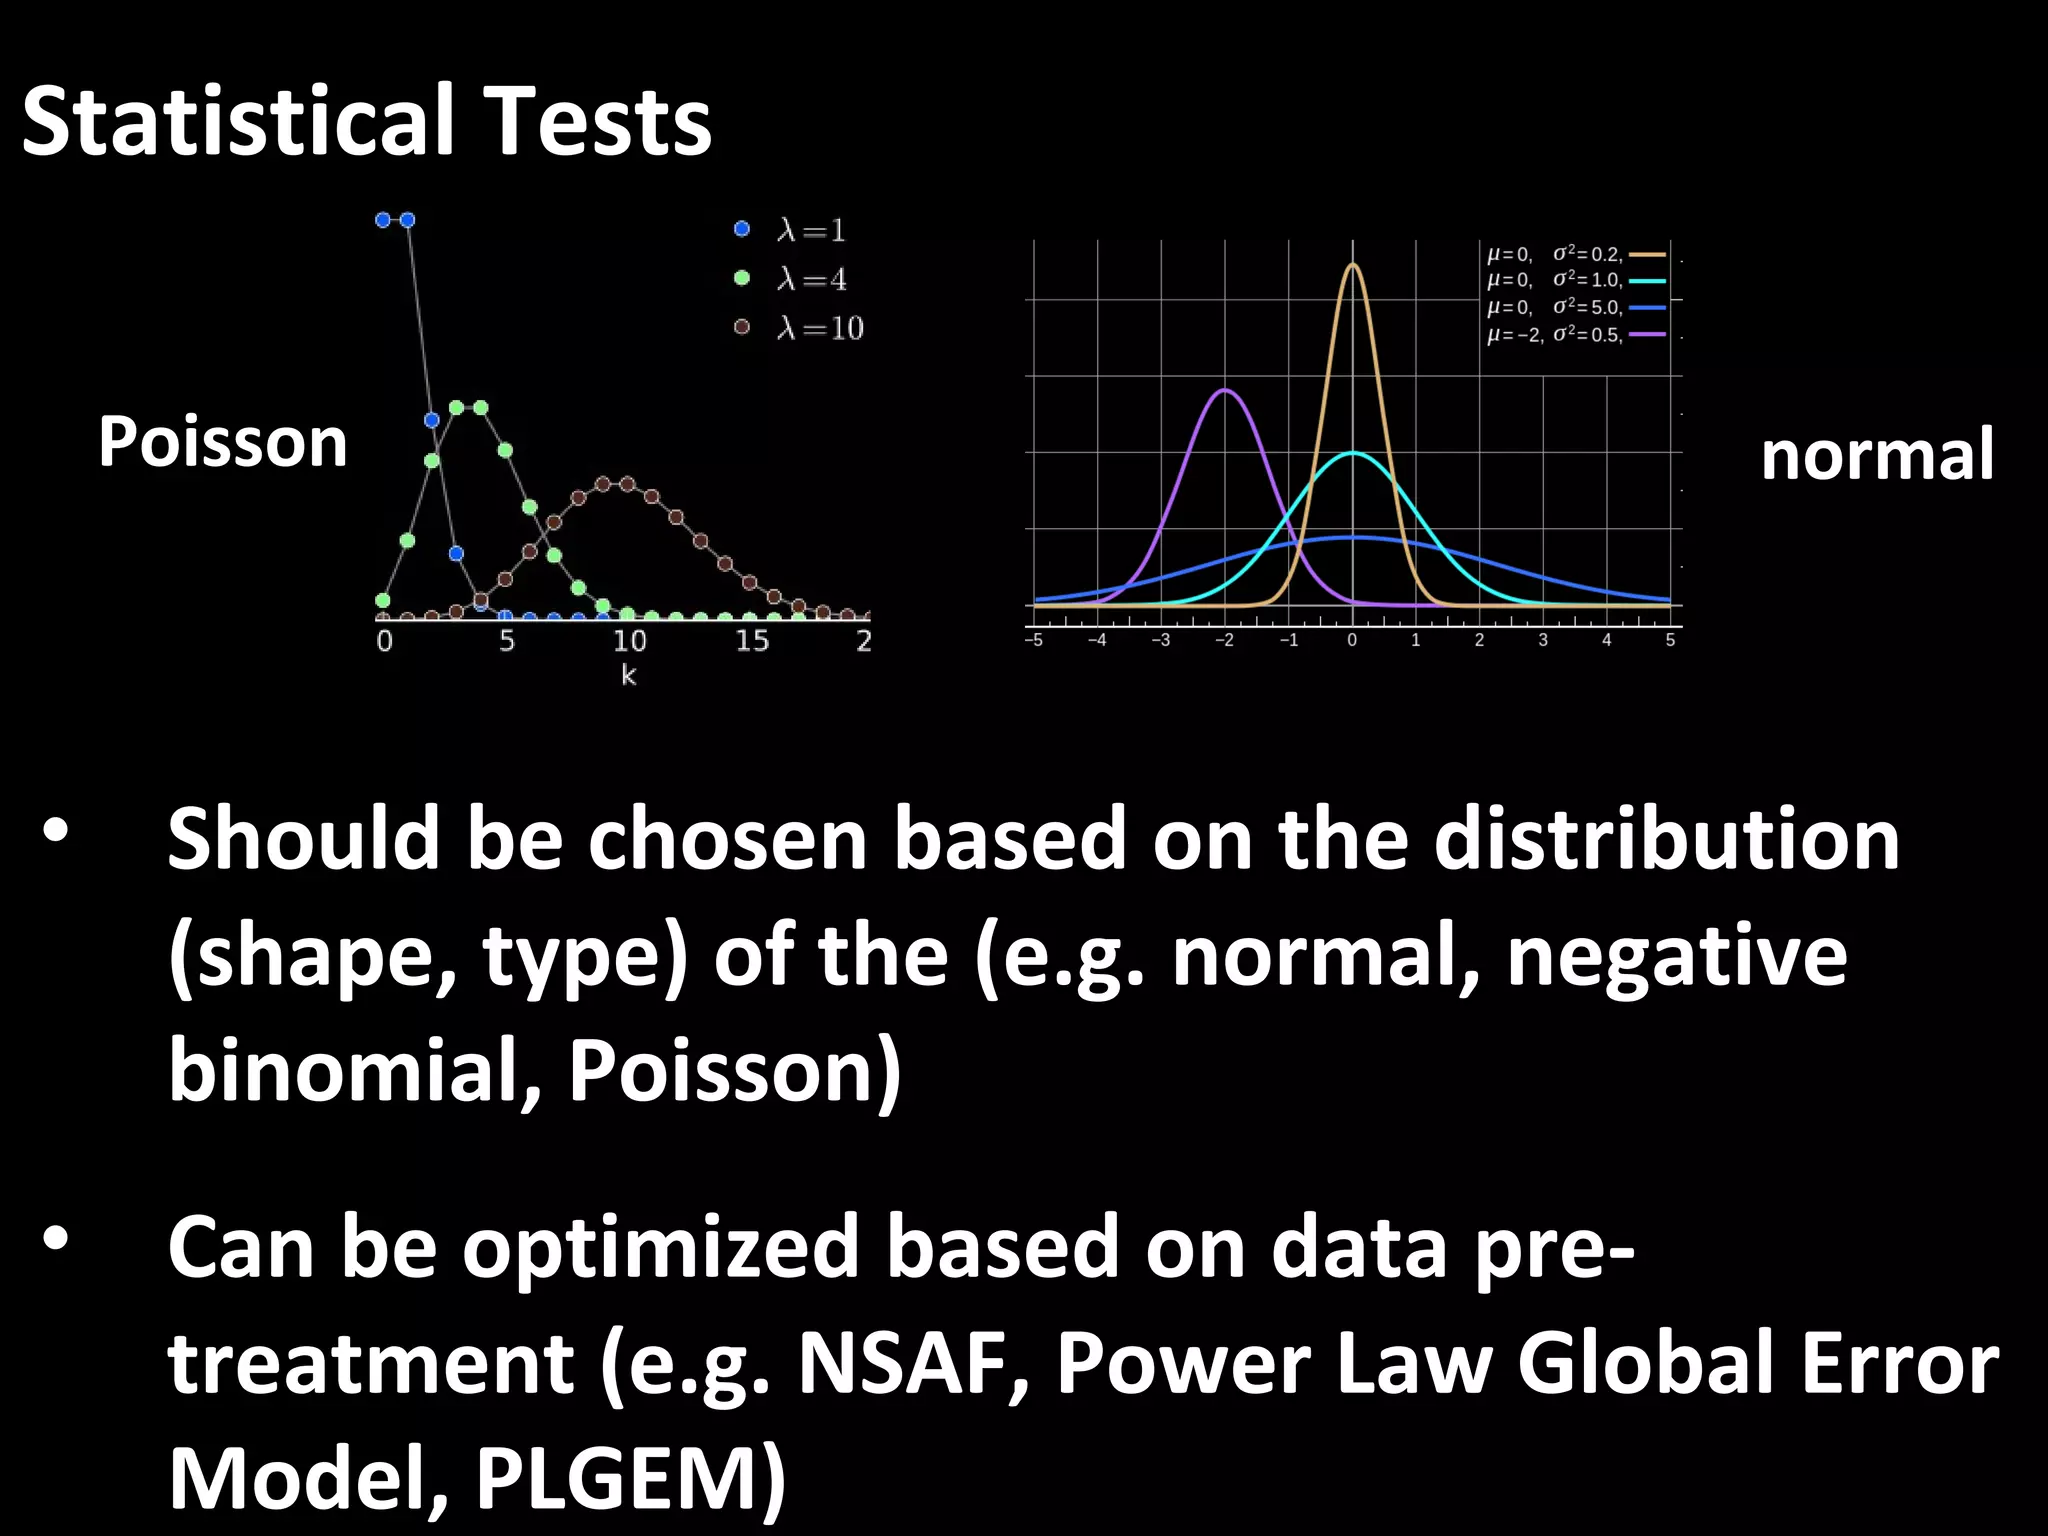
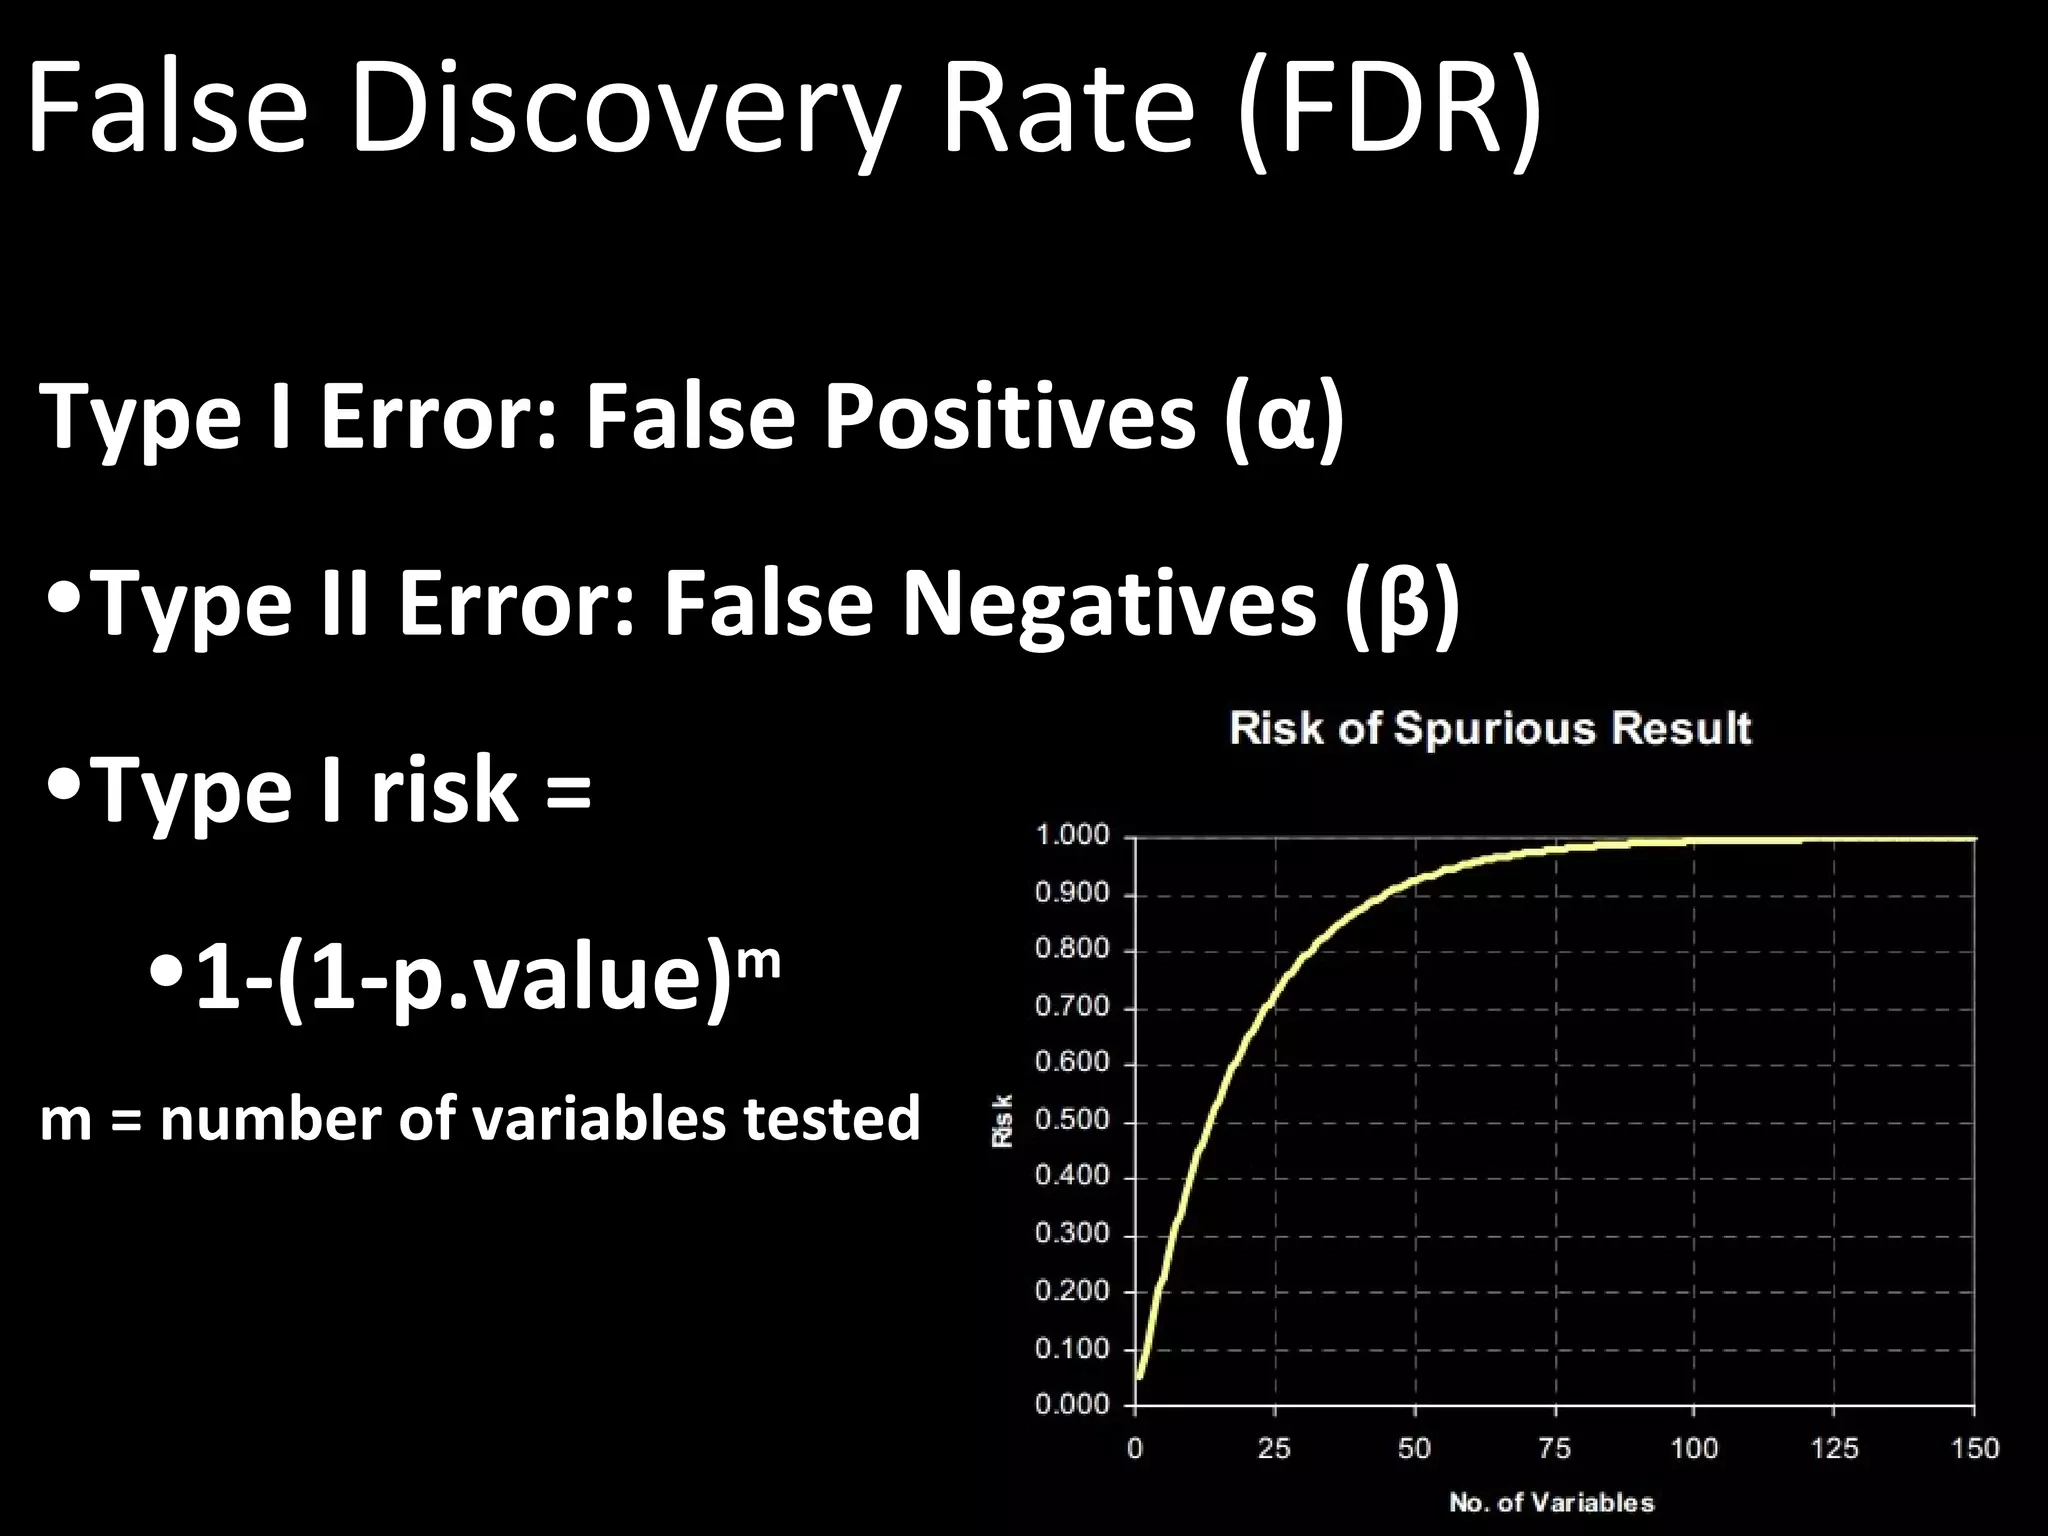
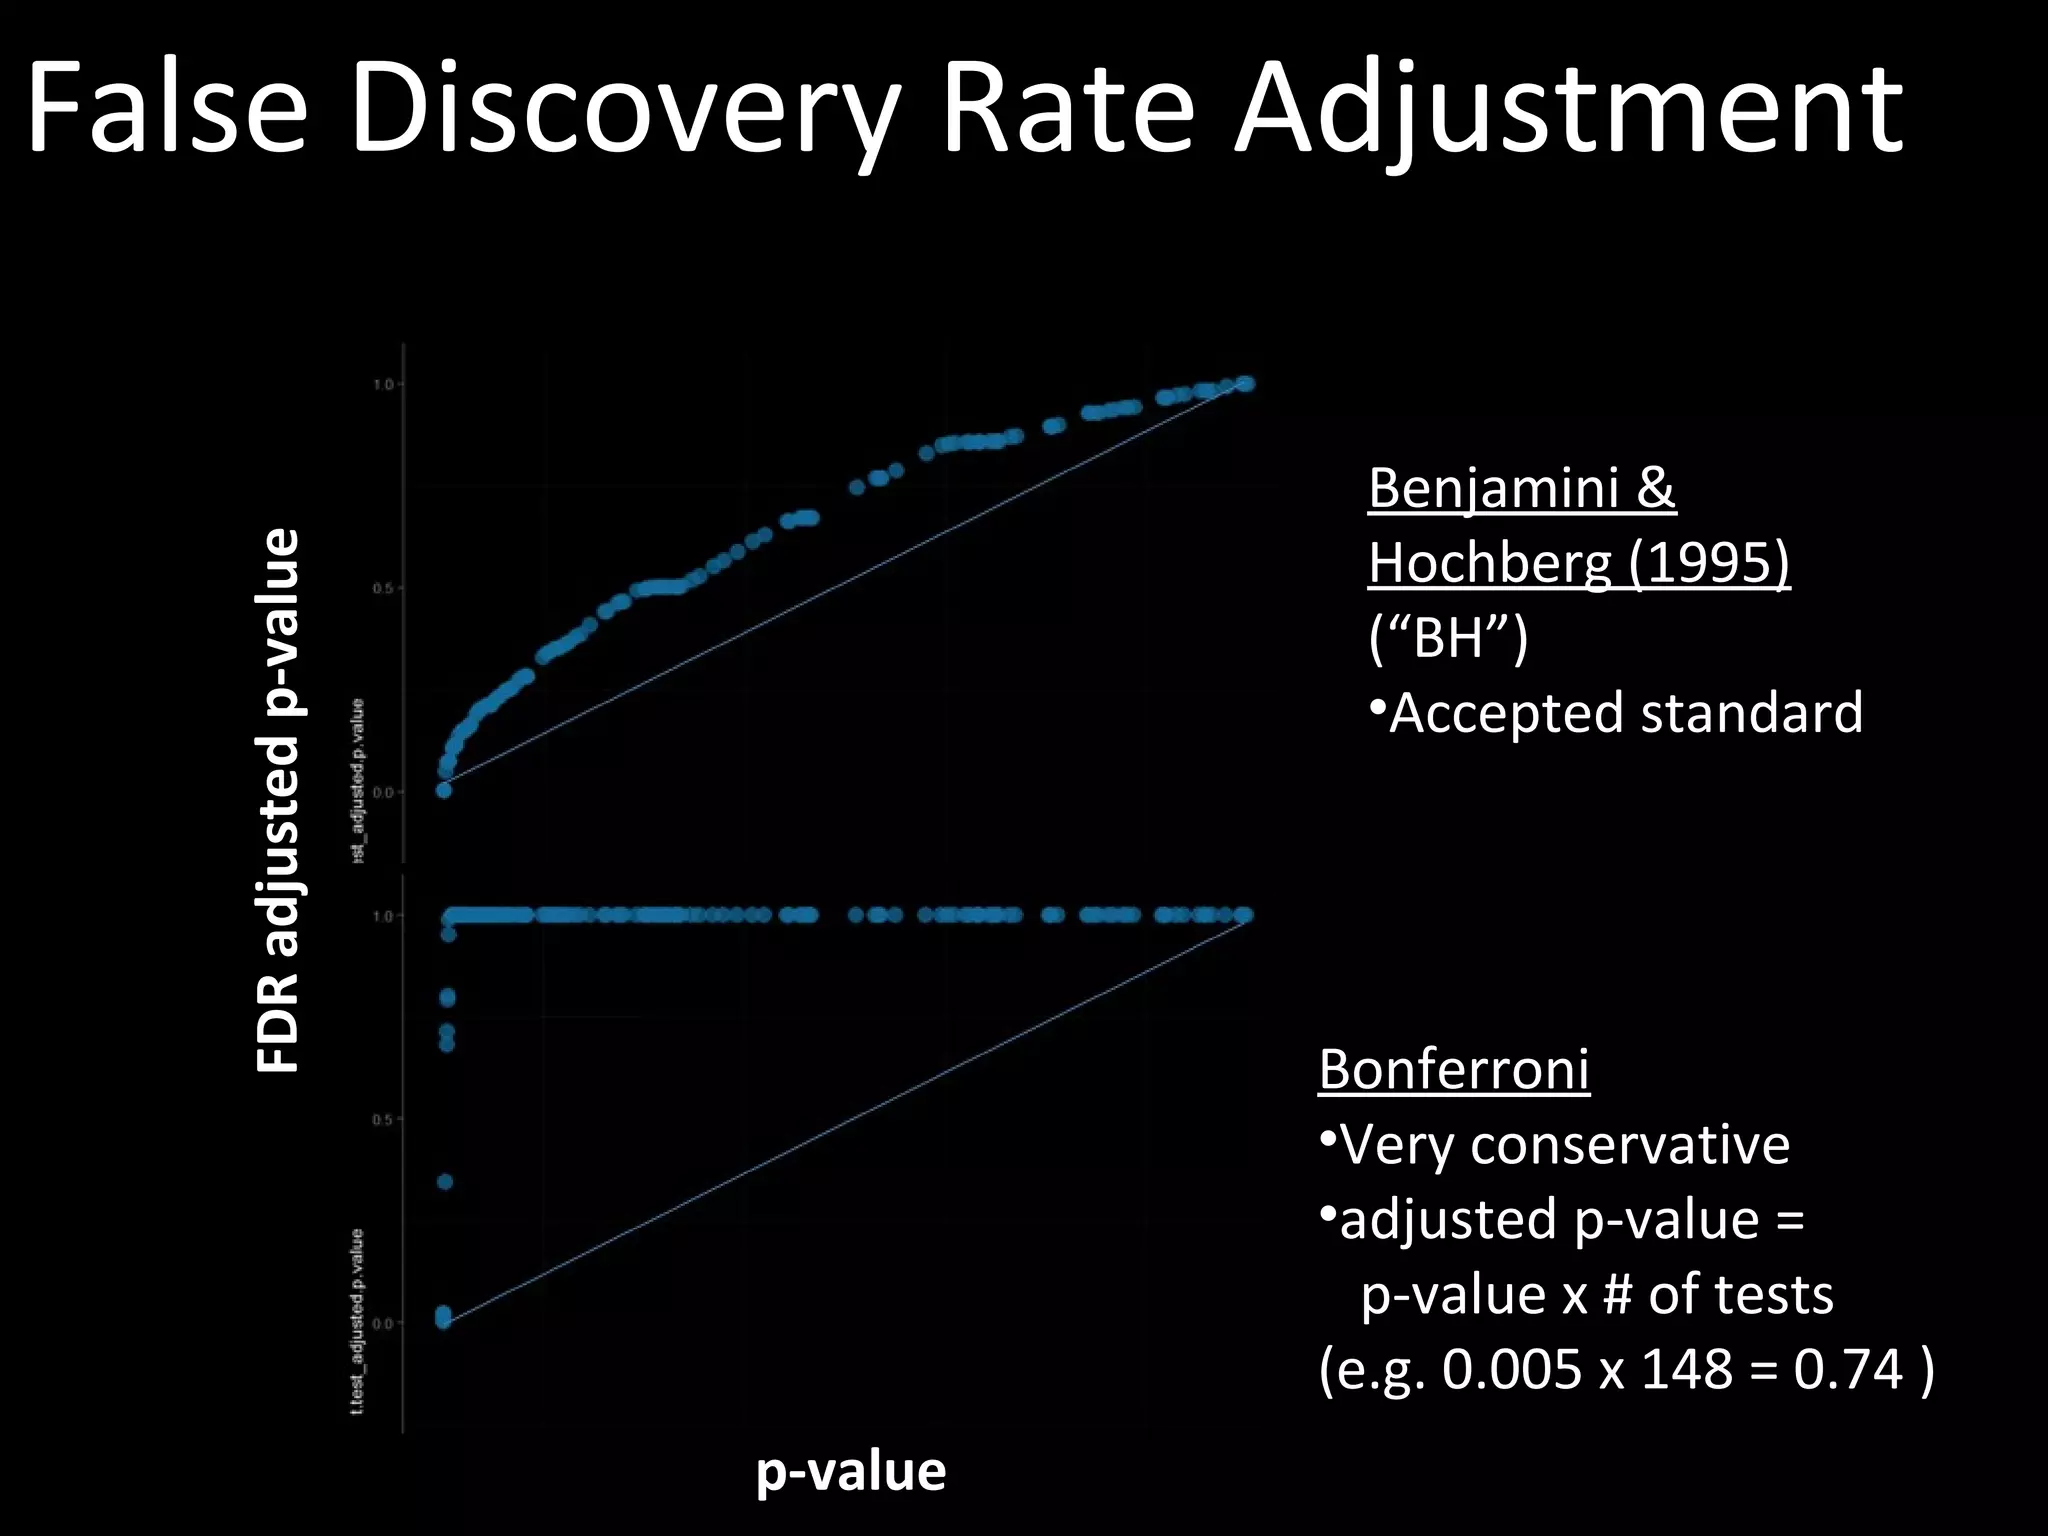
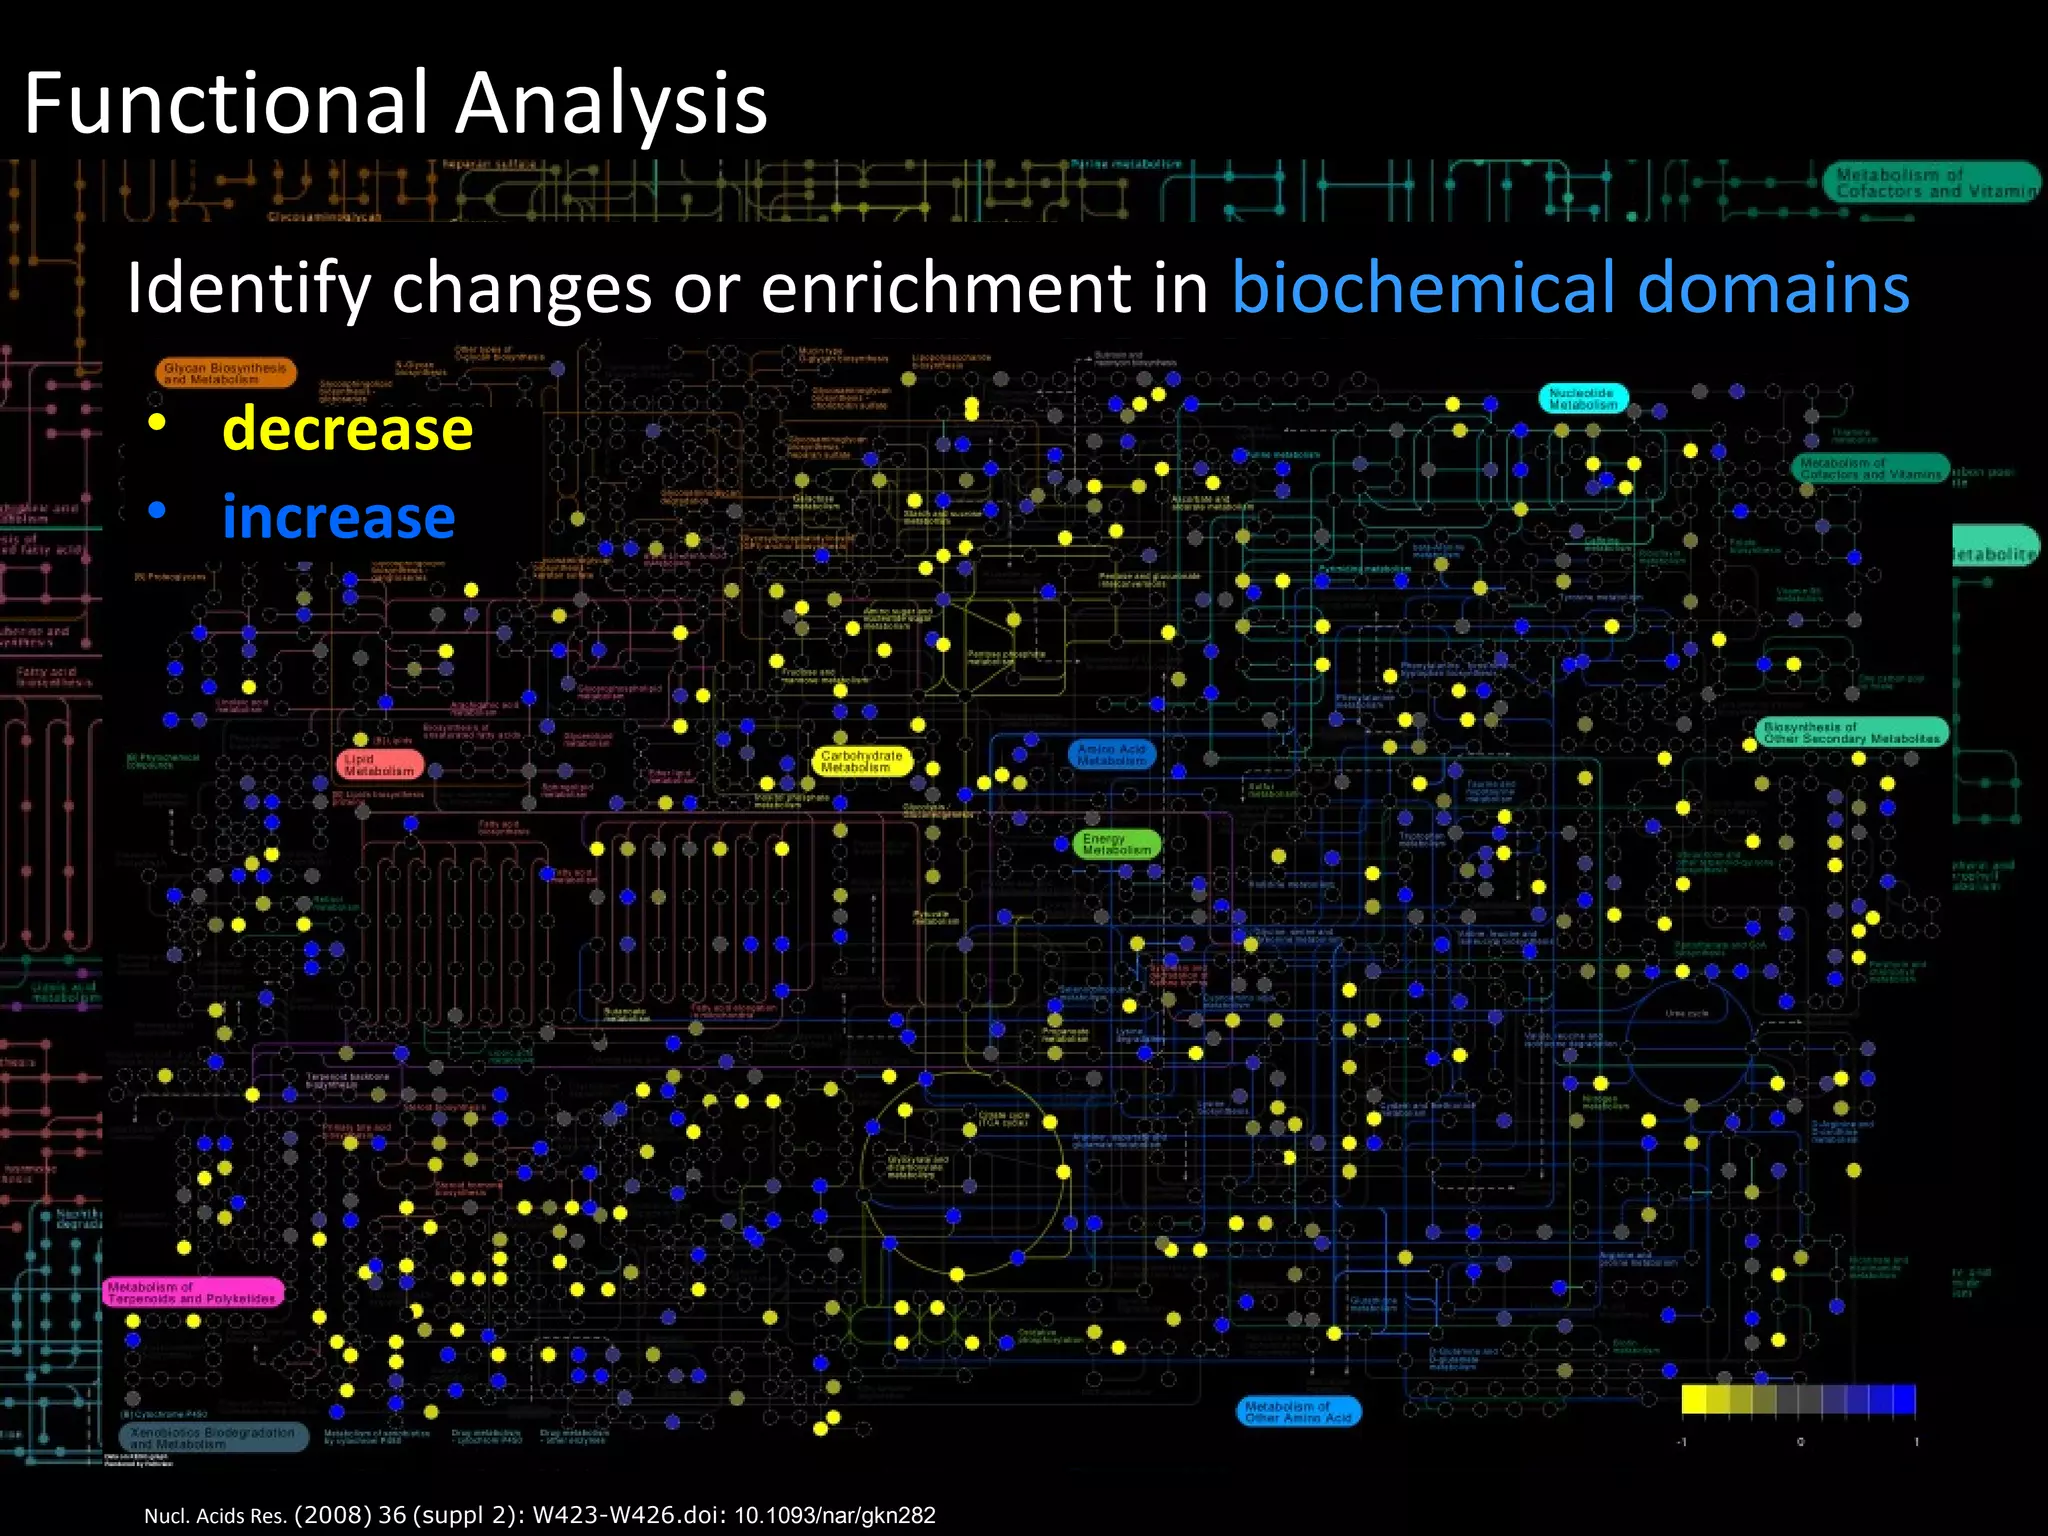
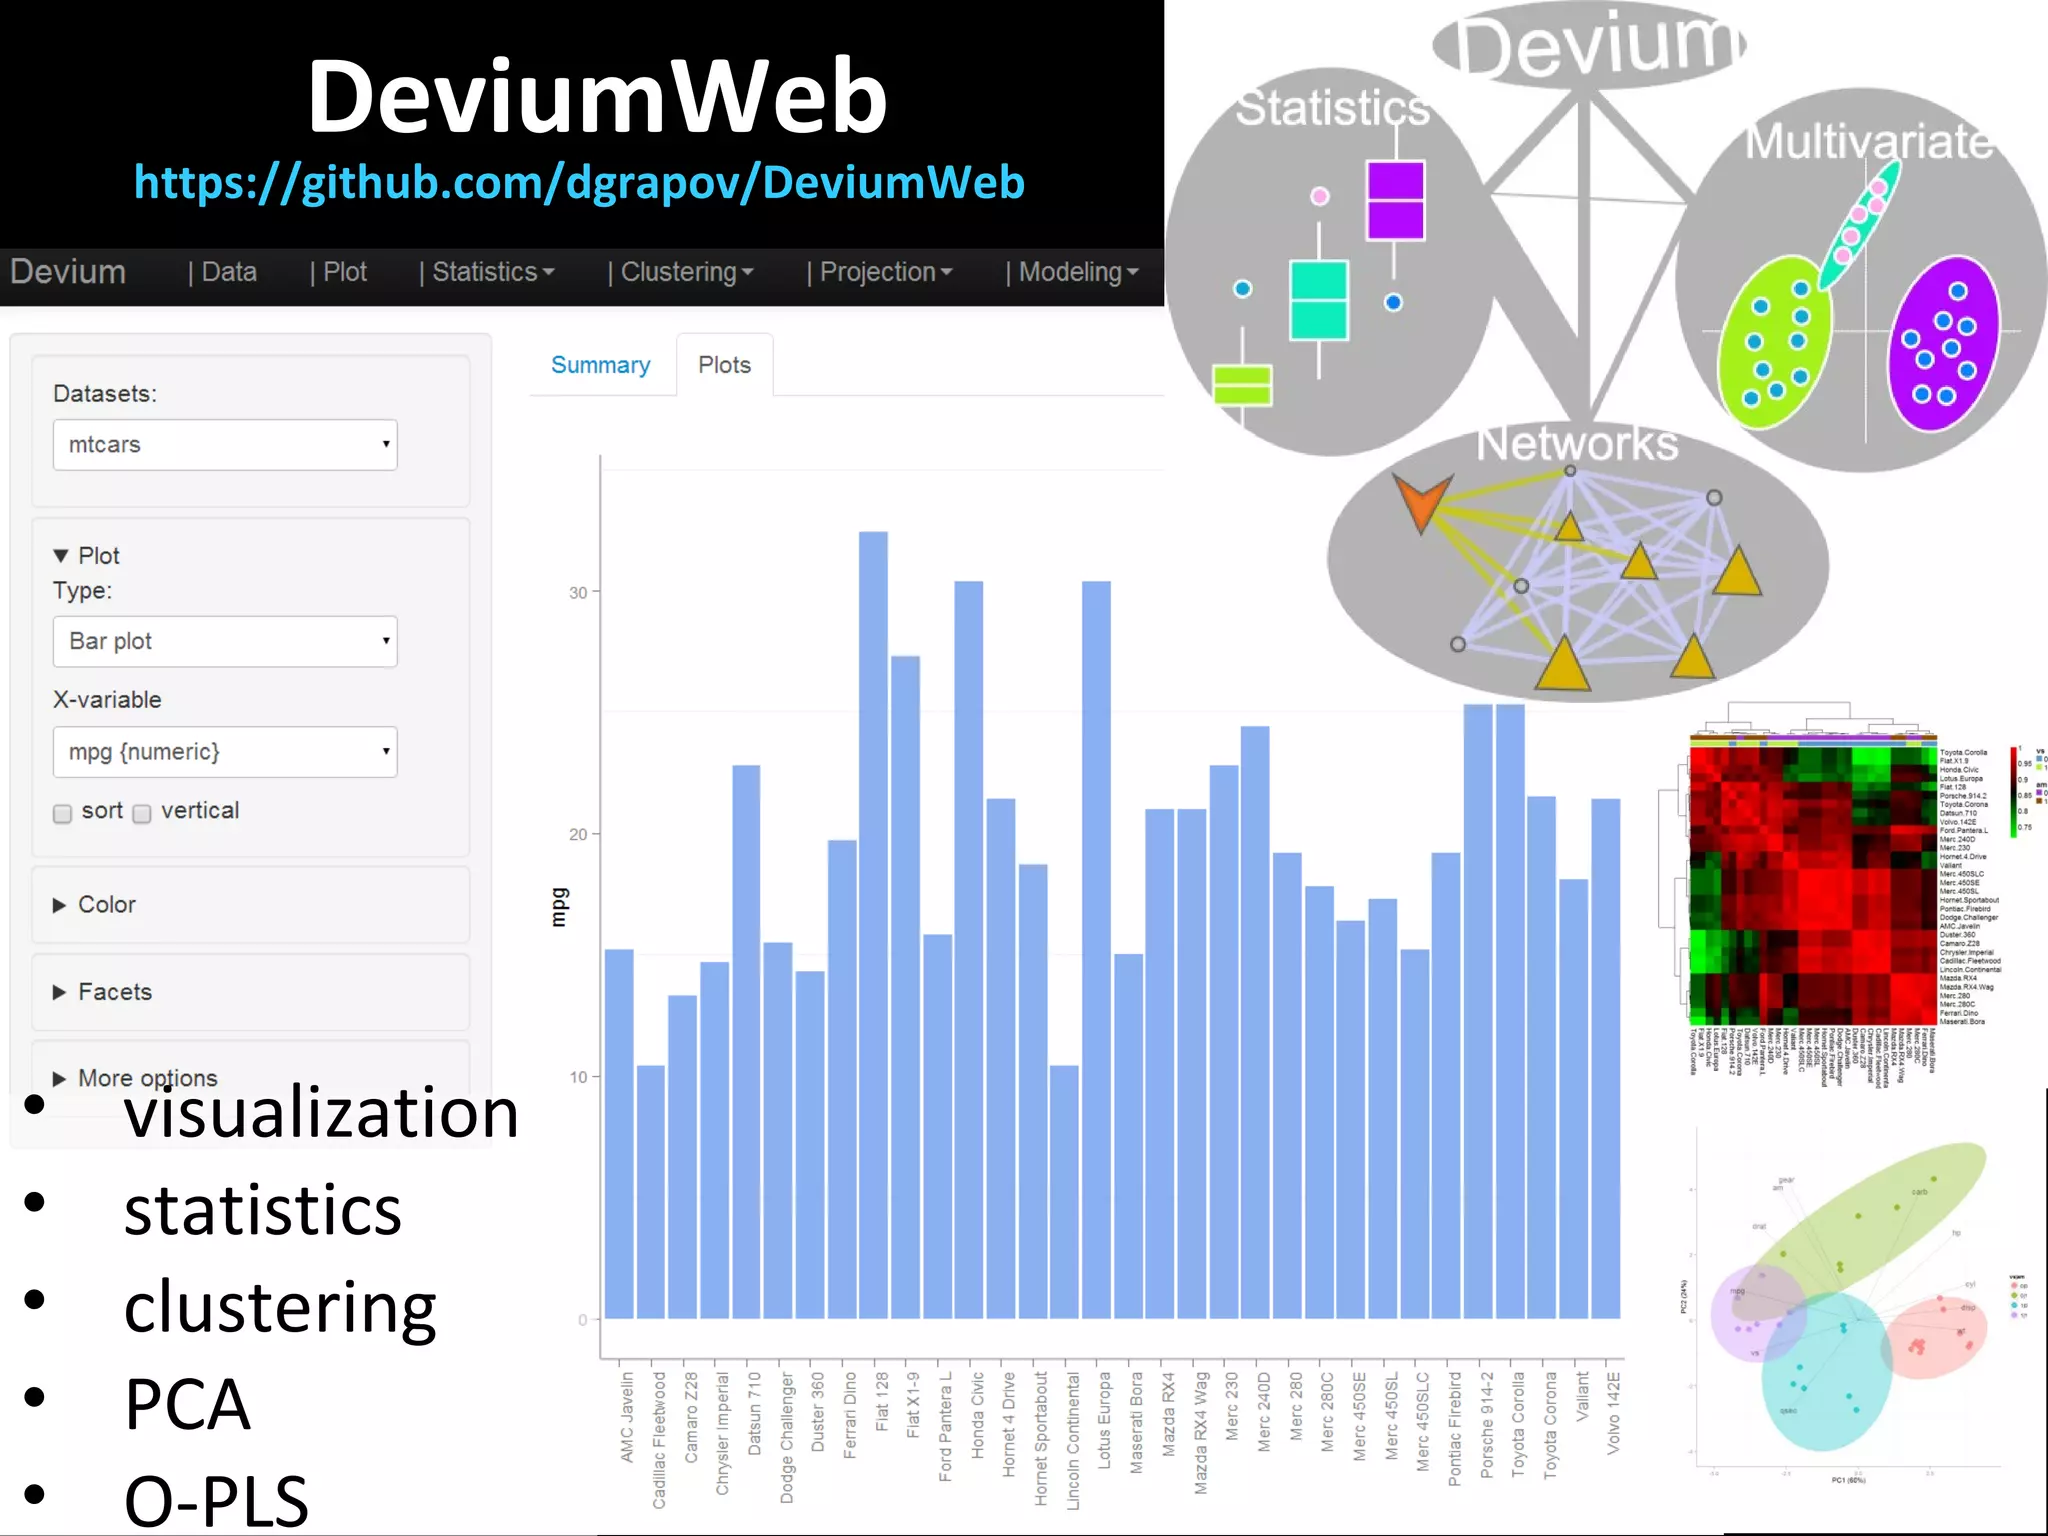
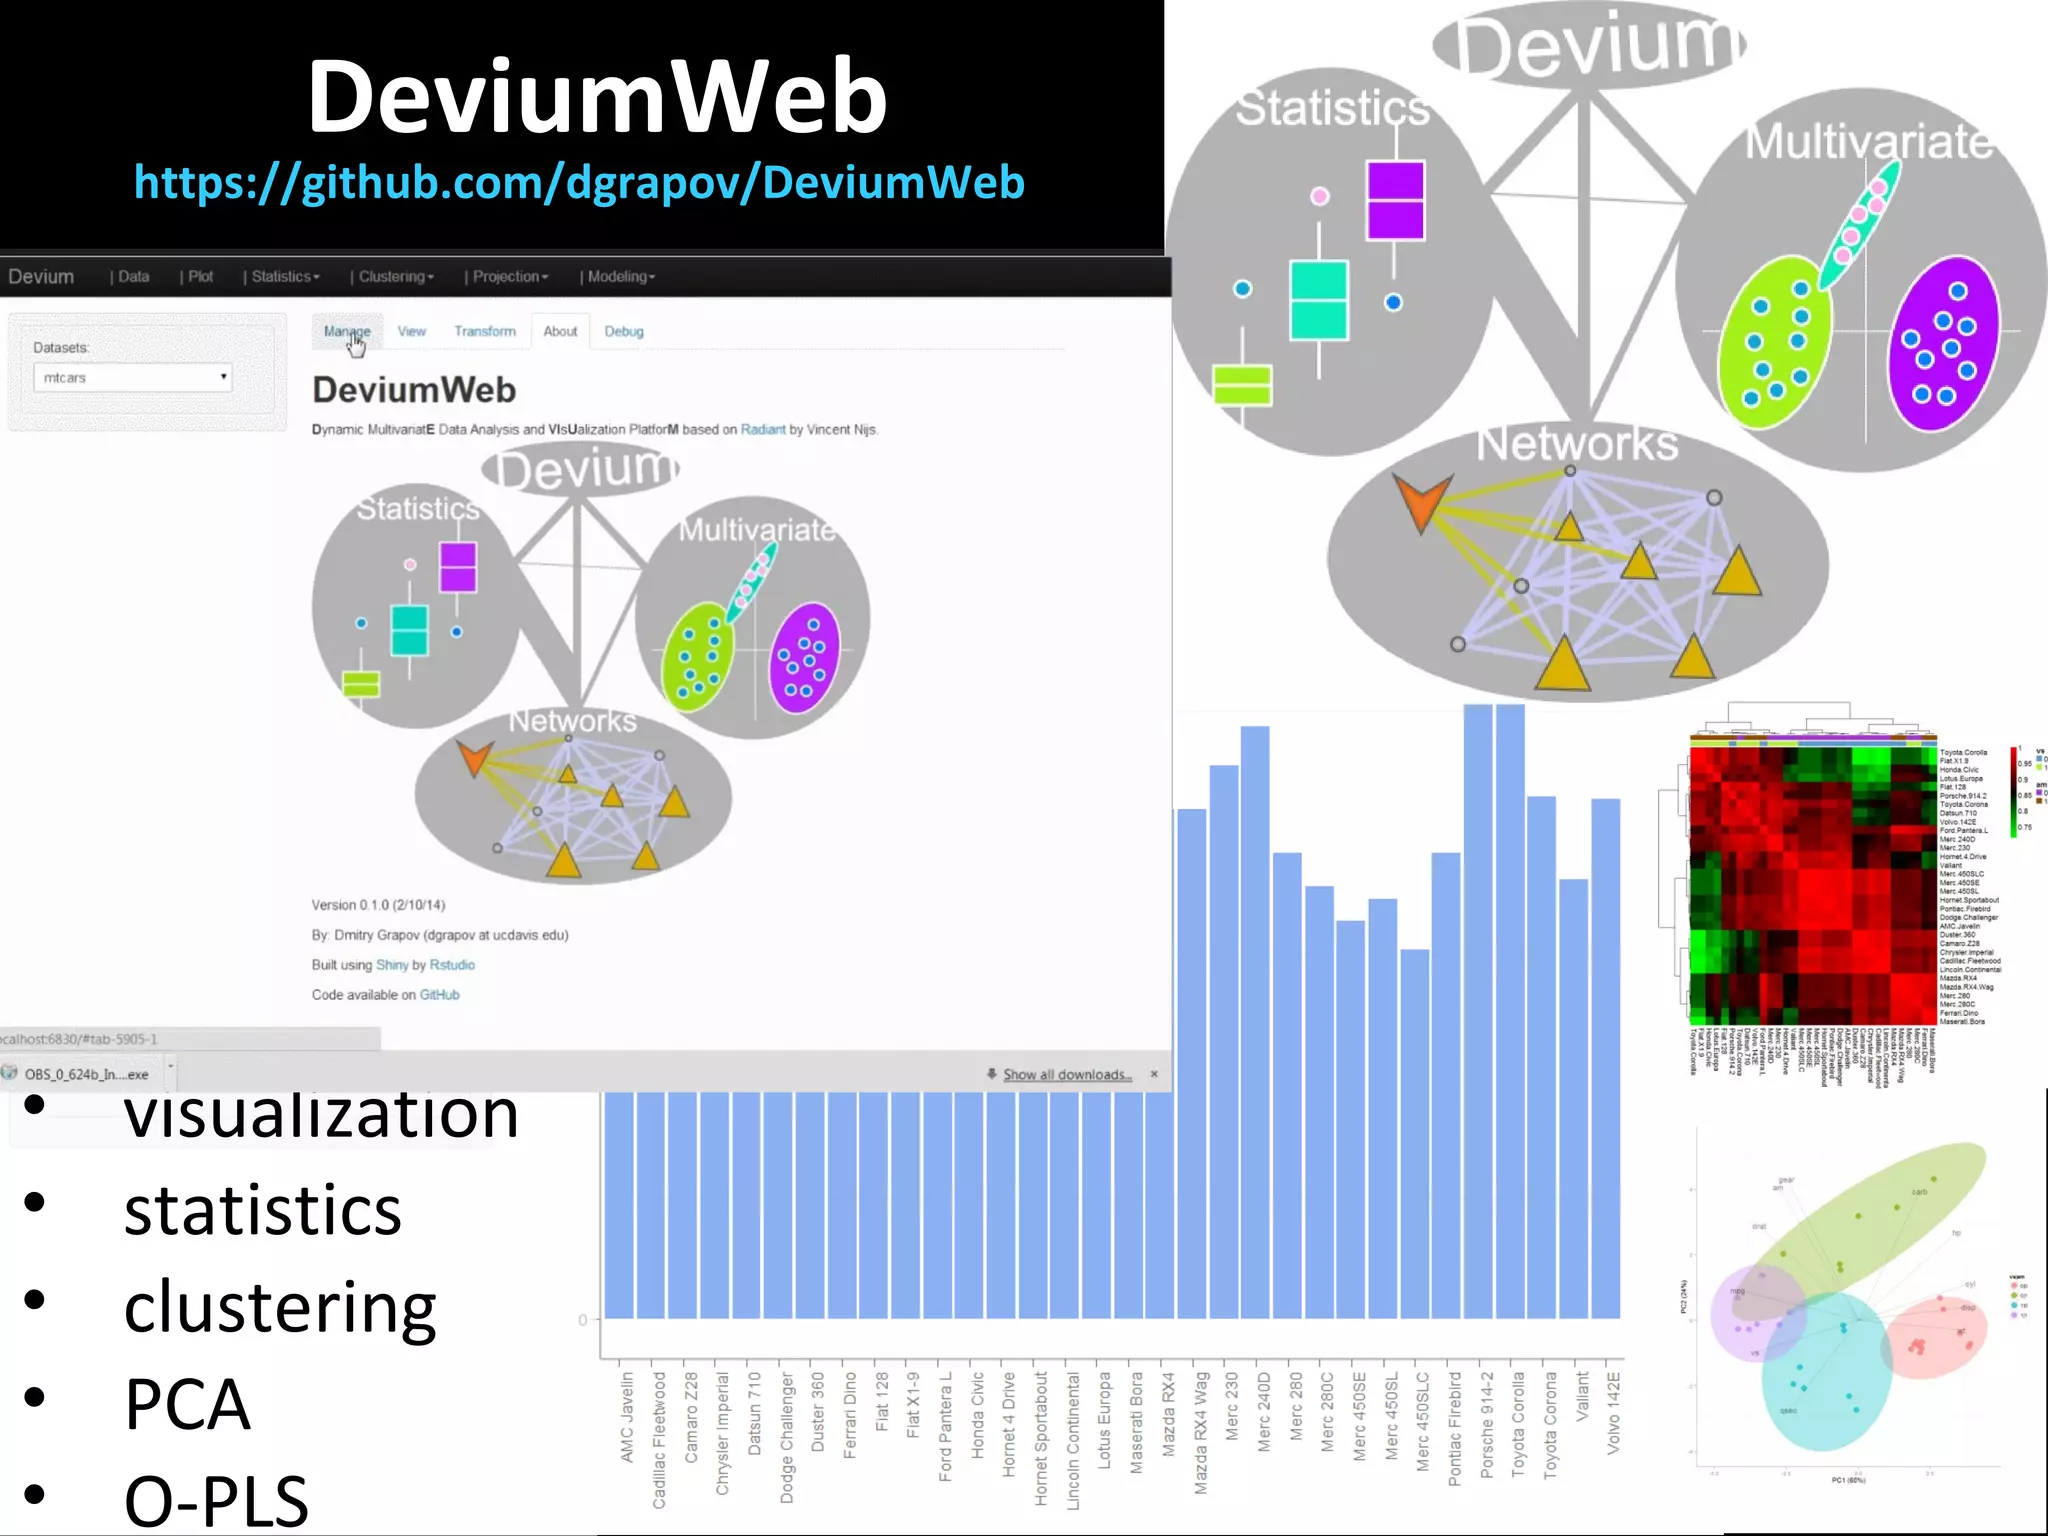
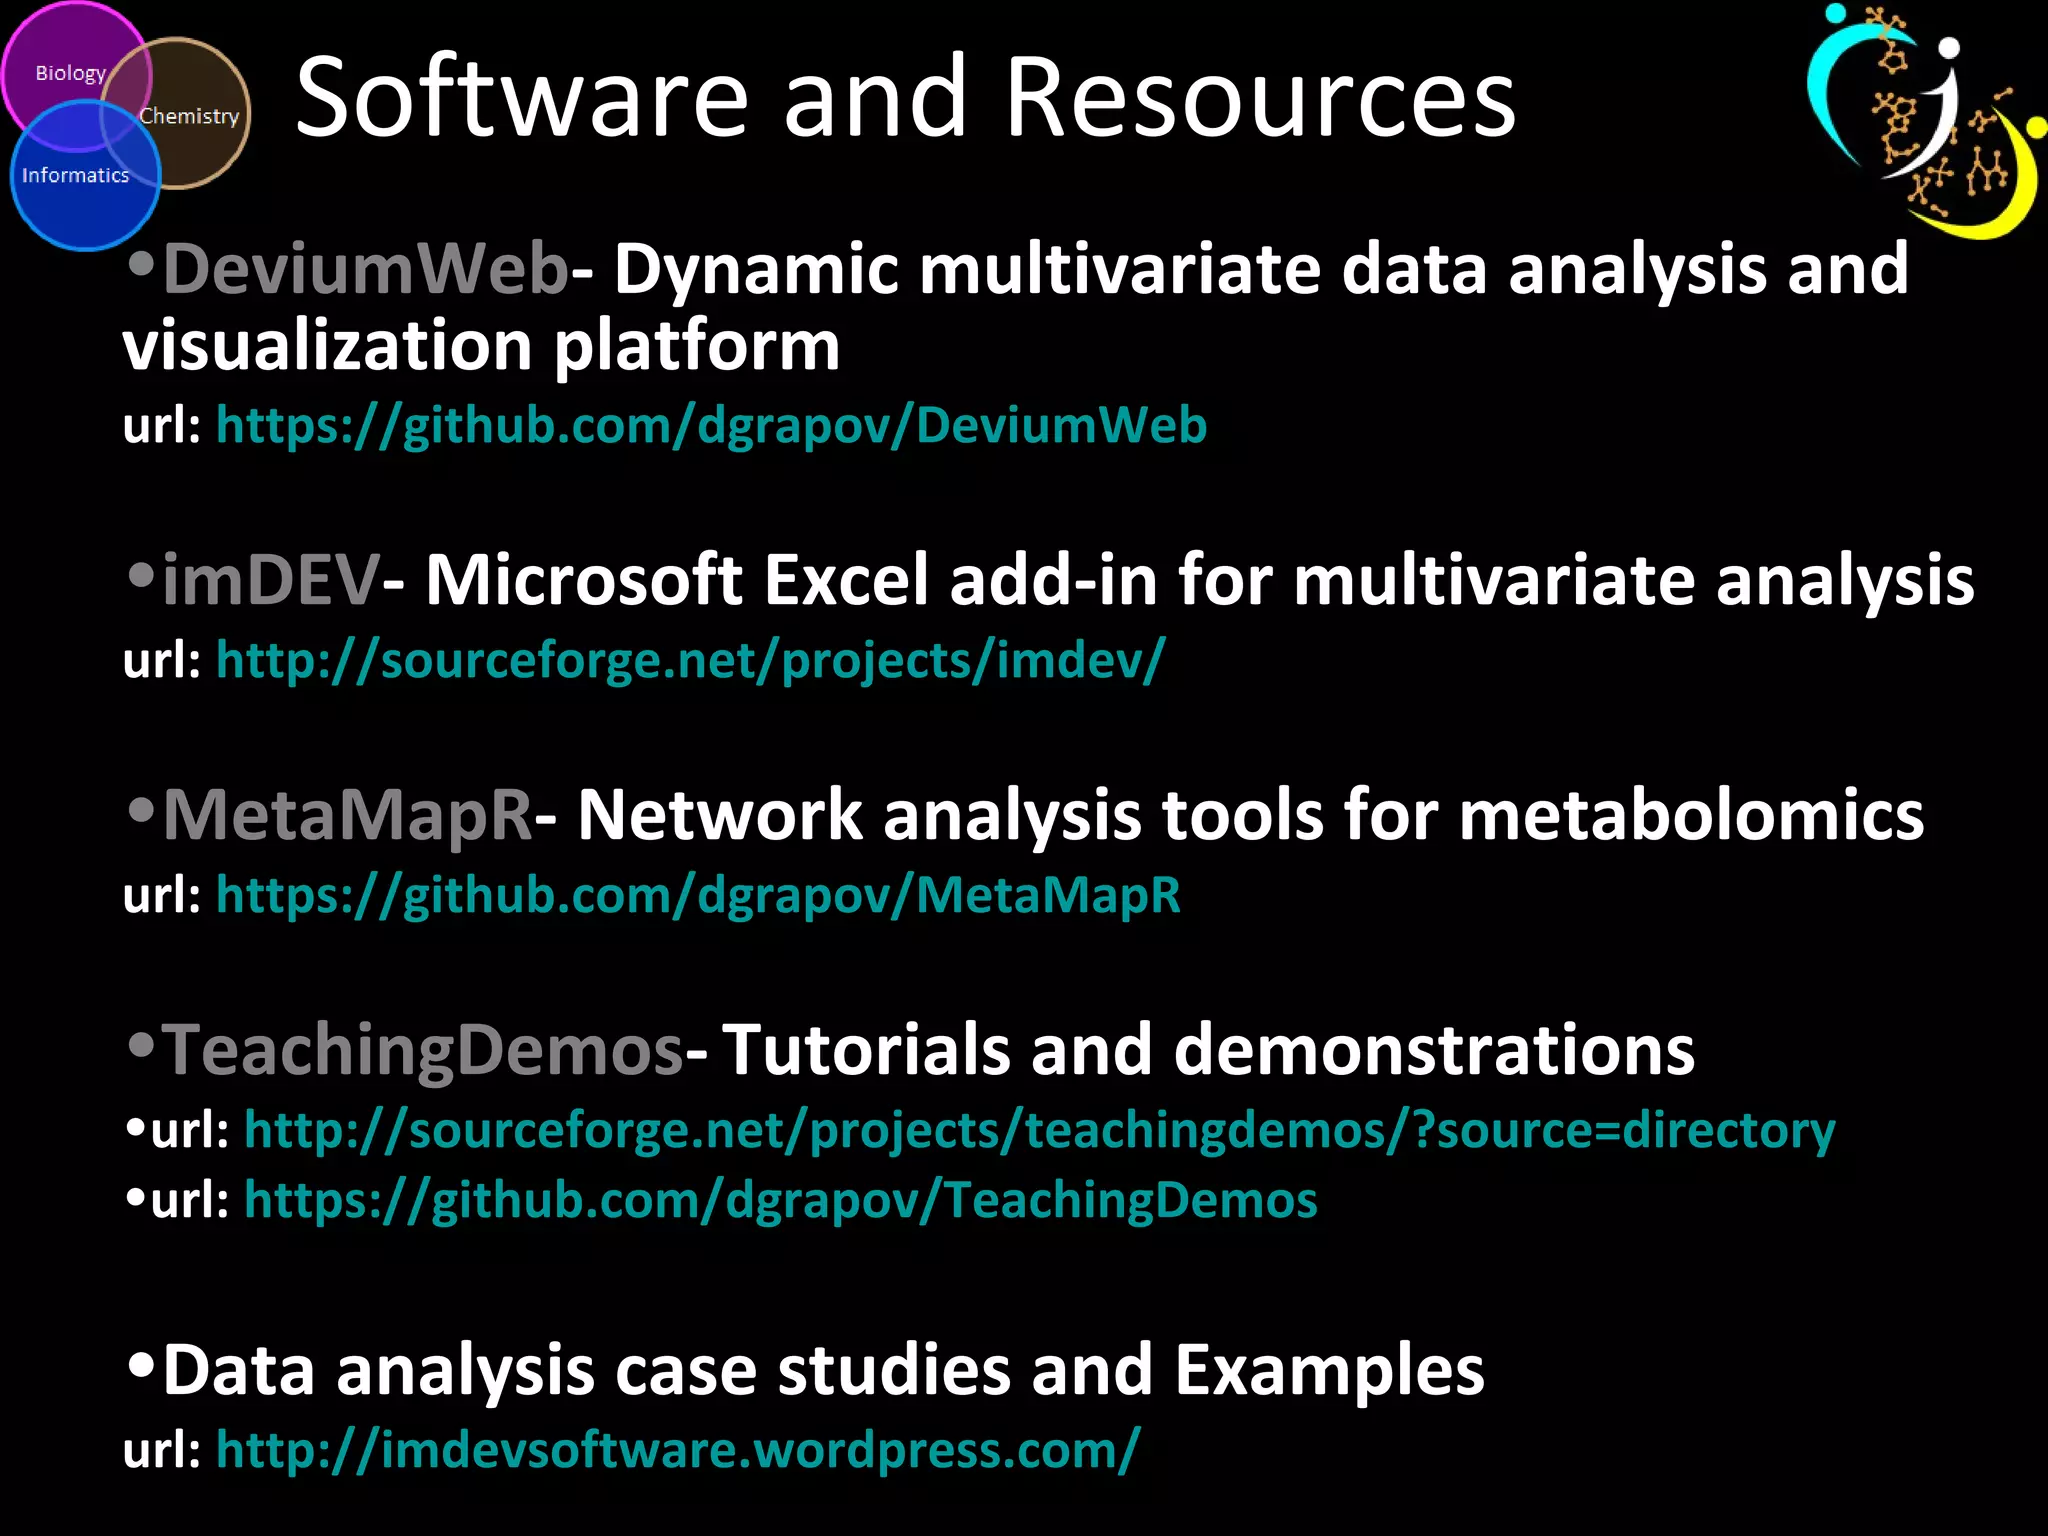
Dmitry Grapov, PhD
Multivariate Analysis and
Visualization of ProteOmic Data
State of the art facility producing massive
amounts of biological data…
>20-30K samples/yr
>200 studies
Analysis at the ProteOmic Scale and Beyond
Genomic
Proteomic
Metabolomic
Multi-OmicOmic
integration
Sample
Variable
Data Analysis and Visualization
Quality Assessment
• use replicated mesurements
and/or internal standards to
estimate analytical variance
Statistical and Multivariate
• use the experimental design
to test hypotheses and/or
identify trends in analytes
Functional
• use statistical and multivariate
results to identify impacted
biochemical domains
Network
• integrate statistical and
multivariate results with the
experimental design and
analyte metadata
experimental design
- organism, sex, age etc.
analyte description and
metadata
- biochemical class, mass
spectra, etc.
VariableSample
Sample
Variable
Data Analysis and Visualization
Quality Assessment
• use replicated mesurements
and/or internal standards to
estimate analytical variance
Statistical and Multivariate
• use the experimental design
to test hypotheses and/or
identify trends in analytes
Functional
• use statistical and multivariate
results to identify impacted
biochemical domains
Network
• integrate statistical and
multivariate results with the
experimental design and
analyte metadata
Network Mapping
experimental design
- organism, sex, age etc.
analyte description and
metadata
- biochemical class, mass
spectra, etc.
VariableSample
Data Quality Assessment
Quality metrics
•Precision (replicated
measurements)
•Accuracy (reference
samples)
Common tasks
•normalization
•outlier detection
•missing values
imputation
Principal Component
Analysis (PCA) of all
analytes, showing QC
sample scores
Batch Effects
Drift in >400 replicated measurements across >100 analytical batches for a single analyte
Acquisition batch
Abundance
QCs embedded
among >5,5000
samples (1:10)
collected over
1.5 yrs
If the biological effect
size is less than the
analytical variance
then the experiment
will incorrectly yield
insignificant results
Analyte specific data quality
overview
Sample specific normalization can be used
to estimate and remove analytical variance
Raw Data Normalized Data
Normalizations need to be
numerically and visually validated
log mean
low precision
%RSD
high precision
Samples
QCs
Batch Effects
Outlier Detection
• 1 variable
(univariate)
• 2 variables
(bivariate)
• >2 variables
(multivariate)
bivariate vs.
multivariate
mixed up samples
outliers?
(scatter plot)
(PCA scores plot)
Outlier Detection
Network Mapping
Ranked statistically
significant differences
within a a biochemical
context
Statistics
Multivariate
Context
+
+
=
Statistical and Multivariate Analyses
Group 1
Group 2
What analytes are
different between the
two groups of samples?
Statistical
significant differences
lacking rank and
context
t-Test
Multivariate
ranked differences
lacking significance
and context
O-PLS-DA
Network Mapping
Statistics
Multivariate
Context
+
+
=
Statistical and Multivariate Analyses
Group 1
Group 2
What analytes are
different between the
two groups of samples?
Statistical
t-Test
Multivariate
O-PLS-DA
To see the big picture it is necessary too view the data from multiple
different angles
Statistical Analysis: achieving ‘significance’
significance level (α) and power (1-β )
effect size (standardized difference in
means)
sample size (n)
Power analyses can be used to
optimize future experiments
given preliminary data
Example: use experimentally
derived (or literature estimated)
effect sizes, desired p-value
(alpha) and power (beta) to
calculate the optimal number of
samples per group
Statistical Tests
• Should be chosen based on the distribution
(shape, type) of the (e.g. normal, negative
binomial, Poisson)
• Can be optimized based on data pre-
treatment (e.g. NSAF, Power Law Global Error
Model, PLGEM)
Poisson normal
False Discovery Rate (FDR)
Type I Error: False Positives (α)
•Type II Error: False Negatives (β)
•Type I risk =
•1-(1-p.value)m
m = number of variables tested
False Discovery Rate Adjustment
FDRadjustedp-value
p-value
Benjamini &
Hochberg (1995)
(“BH”)
•Accepted standard
Bonferroni
•Very conservative
•adjusted p-value =
p-value x # of tests
(e.g. 0.005 x 148 = 0.74 )
Functional Analysis
Nucl. Acids Res. (2008) 36 (suppl 2): W423-W426.doi: 10.1093/nar/gkn282
Identify changes or enrichment in biochemical domains
• decrease
• increase
Functional Analysis: Enrichment
Biochemical Pathway Biochemical Ontology
Common Multivariate Methods
Clustering
Projection
Networks
Artist: Chuck Close
Cluster Analysis
Useful for
•pattern recognition
•complexity reduction
Common Methods
•Hierarchical
•Model based
•Other (k-means, k-NN, PAM,
fuzzy)
Linkage k-means
Distribution Density
Hierarchical Clustering
Similarity
x
x
x
x
Dendrogram
How does my metadata
match my data structure?
Projection Methods
The algorithm defines the position of the light source
Principal Components Analysis (PCA)
• unsupervised
• maximize variance (X)
Partial Least Squares Projection to
Latent Structures (PLS)
• supervised
• maximize covariance (Y ~ X)
James X. Li, 2009, VisuMap Tech.
single analyte all analytes
Interpreting scores and loadings
variables with the highest loadings have the
greatest contribution to sample scores
loadings represent how variables
contribute to sample scores
loadings
Scores represent
dis/similarities in samples
based on all variables
scores
Networks
Biochemical
•interaction
• enrichment
•etc
Empirical (dependency)
•correlation
•partial-correlation
•clustering
variable 2
variable 1
variable 3
Enrichment Network
Mapping of parents through children
Interaction Networks
Empirical Networks
• Correlation based networks (CN)
(simple, tendency to hairball)
• GGM or partial correlation based
networks (advanced, preference
of direct over indirect
relationships
• *Increase in robustness with
sample size
10.1007/978-1-4614-1689-0_17
Proteomic Case Study: Diabetes Markers
• Small sample size (control =12, GDM =6); covariates (time of sample collection)
• >600 measured colostrum proteins; ~ 300 NSAF normalized proteins retained
• Multivariate classification with O-PLS-DA used to identify variables to test using
PLGEM with correction for FDR
• Partial-correlation protein-protein interaction network analysis
DeviumWeb
https://github.com/dgrapov/DeviumWeb
• visualization
• statistics
• clustering
• PCA
• O-PLS
DeviumWeb
• visualization
• statistics
• clustering
• PCA
• O-PLS
https://github.com/dgrapov/DeviumWeb
Software and Resources
•DeviumWeb- Dynamic multivariate data analysis and
visualization platform
url: https://github.com/dgrapov/DeviumWeb
•imDEV- Microsoft Excel add-in for multivariate analysis
url: http://sourceforge.net/projects/imdev/
•MetaMapR- Network analysis tools for metabolomics
url: https://github.com/dgrapov/MetaMapR
•TeachingDemos- Tutorials and demonstrations
•url: http://sourceforge.net/projects/teachingdemos/?source=directory
•url: https://github.com/dgrapov/TeachingDemos
•Data analysis case studies and Examples
url: http://imdevsoftware.wordpress.com/
Questions?
dgrapov@ucdavis.edu
This research was supported in part by NIH 1 U24 DK097154

Prote-OMIC Data Analysis and Visualization

  • 1.
    Dmitry Grapov, PhD MultivariateAnalysis and Visualization of ProteOmic Data
  • 2.
    State of theart facility producing massive amounts of biological data… >20-30K samples/yr >200 studies
  • 3.
    Analysis at theProteOmic Scale and Beyond Genomic Proteomic Metabolomic Multi-OmicOmic integration
  • 4.
    Sample Variable Data Analysis andVisualization Quality Assessment • use replicated mesurements and/or internal standards to estimate analytical variance Statistical and Multivariate • use the experimental design to test hypotheses and/or identify trends in analytes Functional • use statistical and multivariate results to identify impacted biochemical domains Network • integrate statistical and multivariate results with the experimental design and analyte metadata experimental design - organism, sex, age etc. analyte description and metadata - biochemical class, mass spectra, etc. VariableSample
  • 5.
    Sample Variable Data Analysis andVisualization Quality Assessment • use replicated mesurements and/or internal standards to estimate analytical variance Statistical and Multivariate • use the experimental design to test hypotheses and/or identify trends in analytes Functional • use statistical and multivariate results to identify impacted biochemical domains Network • integrate statistical and multivariate results with the experimental design and analyte metadata Network Mapping experimental design - organism, sex, age etc. analyte description and metadata - biochemical class, mass spectra, etc. VariableSample
  • 6.
    Data Quality Assessment Qualitymetrics •Precision (replicated measurements) •Accuracy (reference samples) Common tasks •normalization •outlier detection •missing values imputation
  • 7.
    Principal Component Analysis (PCA)of all analytes, showing QC sample scores Batch Effects Drift in >400 replicated measurements across >100 analytical batches for a single analyte Acquisition batch Abundance QCs embedded among >5,5000 samples (1:10) collected over 1.5 yrs If the biological effect size is less than the analytical variance then the experiment will incorrectly yield insignificant results
  • 8.
    Analyte specific dataquality overview Sample specific normalization can be used to estimate and remove analytical variance Raw Data Normalized Data Normalizations need to be numerically and visually validated log mean low precision %RSD high precision Samples QCs Batch Effects
  • 9.
    Outlier Detection • 1variable (univariate) • 2 variables (bivariate) • >2 variables (multivariate)
  • 10.
    bivariate vs. multivariate mixed upsamples outliers? (scatter plot) (PCA scores plot) Outlier Detection
  • 11.
    Network Mapping Ranked statistically significantdifferences within a a biochemical context Statistics Multivariate Context + + = Statistical and Multivariate Analyses Group 1 Group 2 What analytes are different between the two groups of samples? Statistical significant differences lacking rank and context t-Test Multivariate ranked differences lacking significance and context O-PLS-DA
  • 12.
    Network Mapping Statistics Multivariate Context + + = Statistical andMultivariate Analyses Group 1 Group 2 What analytes are different between the two groups of samples? Statistical t-Test Multivariate O-PLS-DA To see the big picture it is necessary too view the data from multiple different angles
  • 13.
    Statistical Analysis: achieving‘significance’ significance level (α) and power (1-β ) effect size (standardized difference in means) sample size (n) Power analyses can be used to optimize future experiments given preliminary data Example: use experimentally derived (or literature estimated) effect sizes, desired p-value (alpha) and power (beta) to calculate the optimal number of samples per group
  • 14.
    Statistical Tests • Shouldbe chosen based on the distribution (shape, type) of the (e.g. normal, negative binomial, Poisson) • Can be optimized based on data pre- treatment (e.g. NSAF, Power Law Global Error Model, PLGEM) Poisson normal
  • 15.
    False Discovery Rate(FDR) Type I Error: False Positives (α) •Type II Error: False Negatives (β) •Type I risk = •1-(1-p.value)m m = number of variables tested
  • 16.
    False Discovery RateAdjustment FDRadjustedp-value p-value Benjamini & Hochberg (1995) (“BH”) •Accepted standard Bonferroni •Very conservative •adjusted p-value = p-value x # of tests (e.g. 0.005 x 148 = 0.74 )
  • 17.
    Functional Analysis Nucl. AcidsRes. (2008) 36 (suppl 2): W423-W426.doi: 10.1093/nar/gkn282 Identify changes or enrichment in biochemical domains • decrease • increase
  • 18.
    Functional Analysis: Enrichment BiochemicalPathway Biochemical Ontology
  • 19.
  • 20.
    Artist: Chuck Close ClusterAnalysis Useful for •pattern recognition •complexity reduction Common Methods •Hierarchical •Model based •Other (k-means, k-NN, PAM, fuzzy) Linkage k-means Distribution Density
  • 21.
  • 22.
    Projection Methods The algorithmdefines the position of the light source Principal Components Analysis (PCA) • unsupervised • maximize variance (X) Partial Least Squares Projection to Latent Structures (PLS) • supervised • maximize covariance (Y ~ X) James X. Li, 2009, VisuMap Tech. single analyte all analytes
  • 23.
    Interpreting scores andloadings variables with the highest loadings have the greatest contribution to sample scores loadings represent how variables contribute to sample scores loadings Scores represent dis/similarities in samples based on all variables scores
  • 24.
  • 25.
    Enrichment Network Mapping ofparents through children
  • 26.
  • 27.
    Empirical Networks • Correlationbased networks (CN) (simple, tendency to hairball) • GGM or partial correlation based networks (advanced, preference of direct over indirect relationships • *Increase in robustness with sample size 10.1007/978-1-4614-1689-0_17
  • 28.
    Proteomic Case Study:Diabetes Markers • Small sample size (control =12, GDM =6); covariates (time of sample collection) • >600 measured colostrum proteins; ~ 300 NSAF normalized proteins retained • Multivariate classification with O-PLS-DA used to identify variables to test using PLGEM with correction for FDR • Partial-correlation protein-protein interaction network analysis
  • 29.
  • 30.
    DeviumWeb • visualization • statistics •clustering • PCA • O-PLS https://github.com/dgrapov/DeviumWeb
  • 31.
    Software and Resources •DeviumWeb-Dynamic multivariate data analysis and visualization platform url: https://github.com/dgrapov/DeviumWeb •imDEV- Microsoft Excel add-in for multivariate analysis url: http://sourceforge.net/projects/imdev/ •MetaMapR- Network analysis tools for metabolomics url: https://github.com/dgrapov/MetaMapR •TeachingDemos- Tutorials and demonstrations •url: http://sourceforge.net/projects/teachingdemos/?source=directory •url: https://github.com/dgrapov/TeachingDemos •Data analysis case studies and Examples url: http://imdevsoftware.wordpress.com/
  • 32.
    Questions? dgrapov@ucdavis.edu This research wassupported in part by NIH 1 U24 DK097154