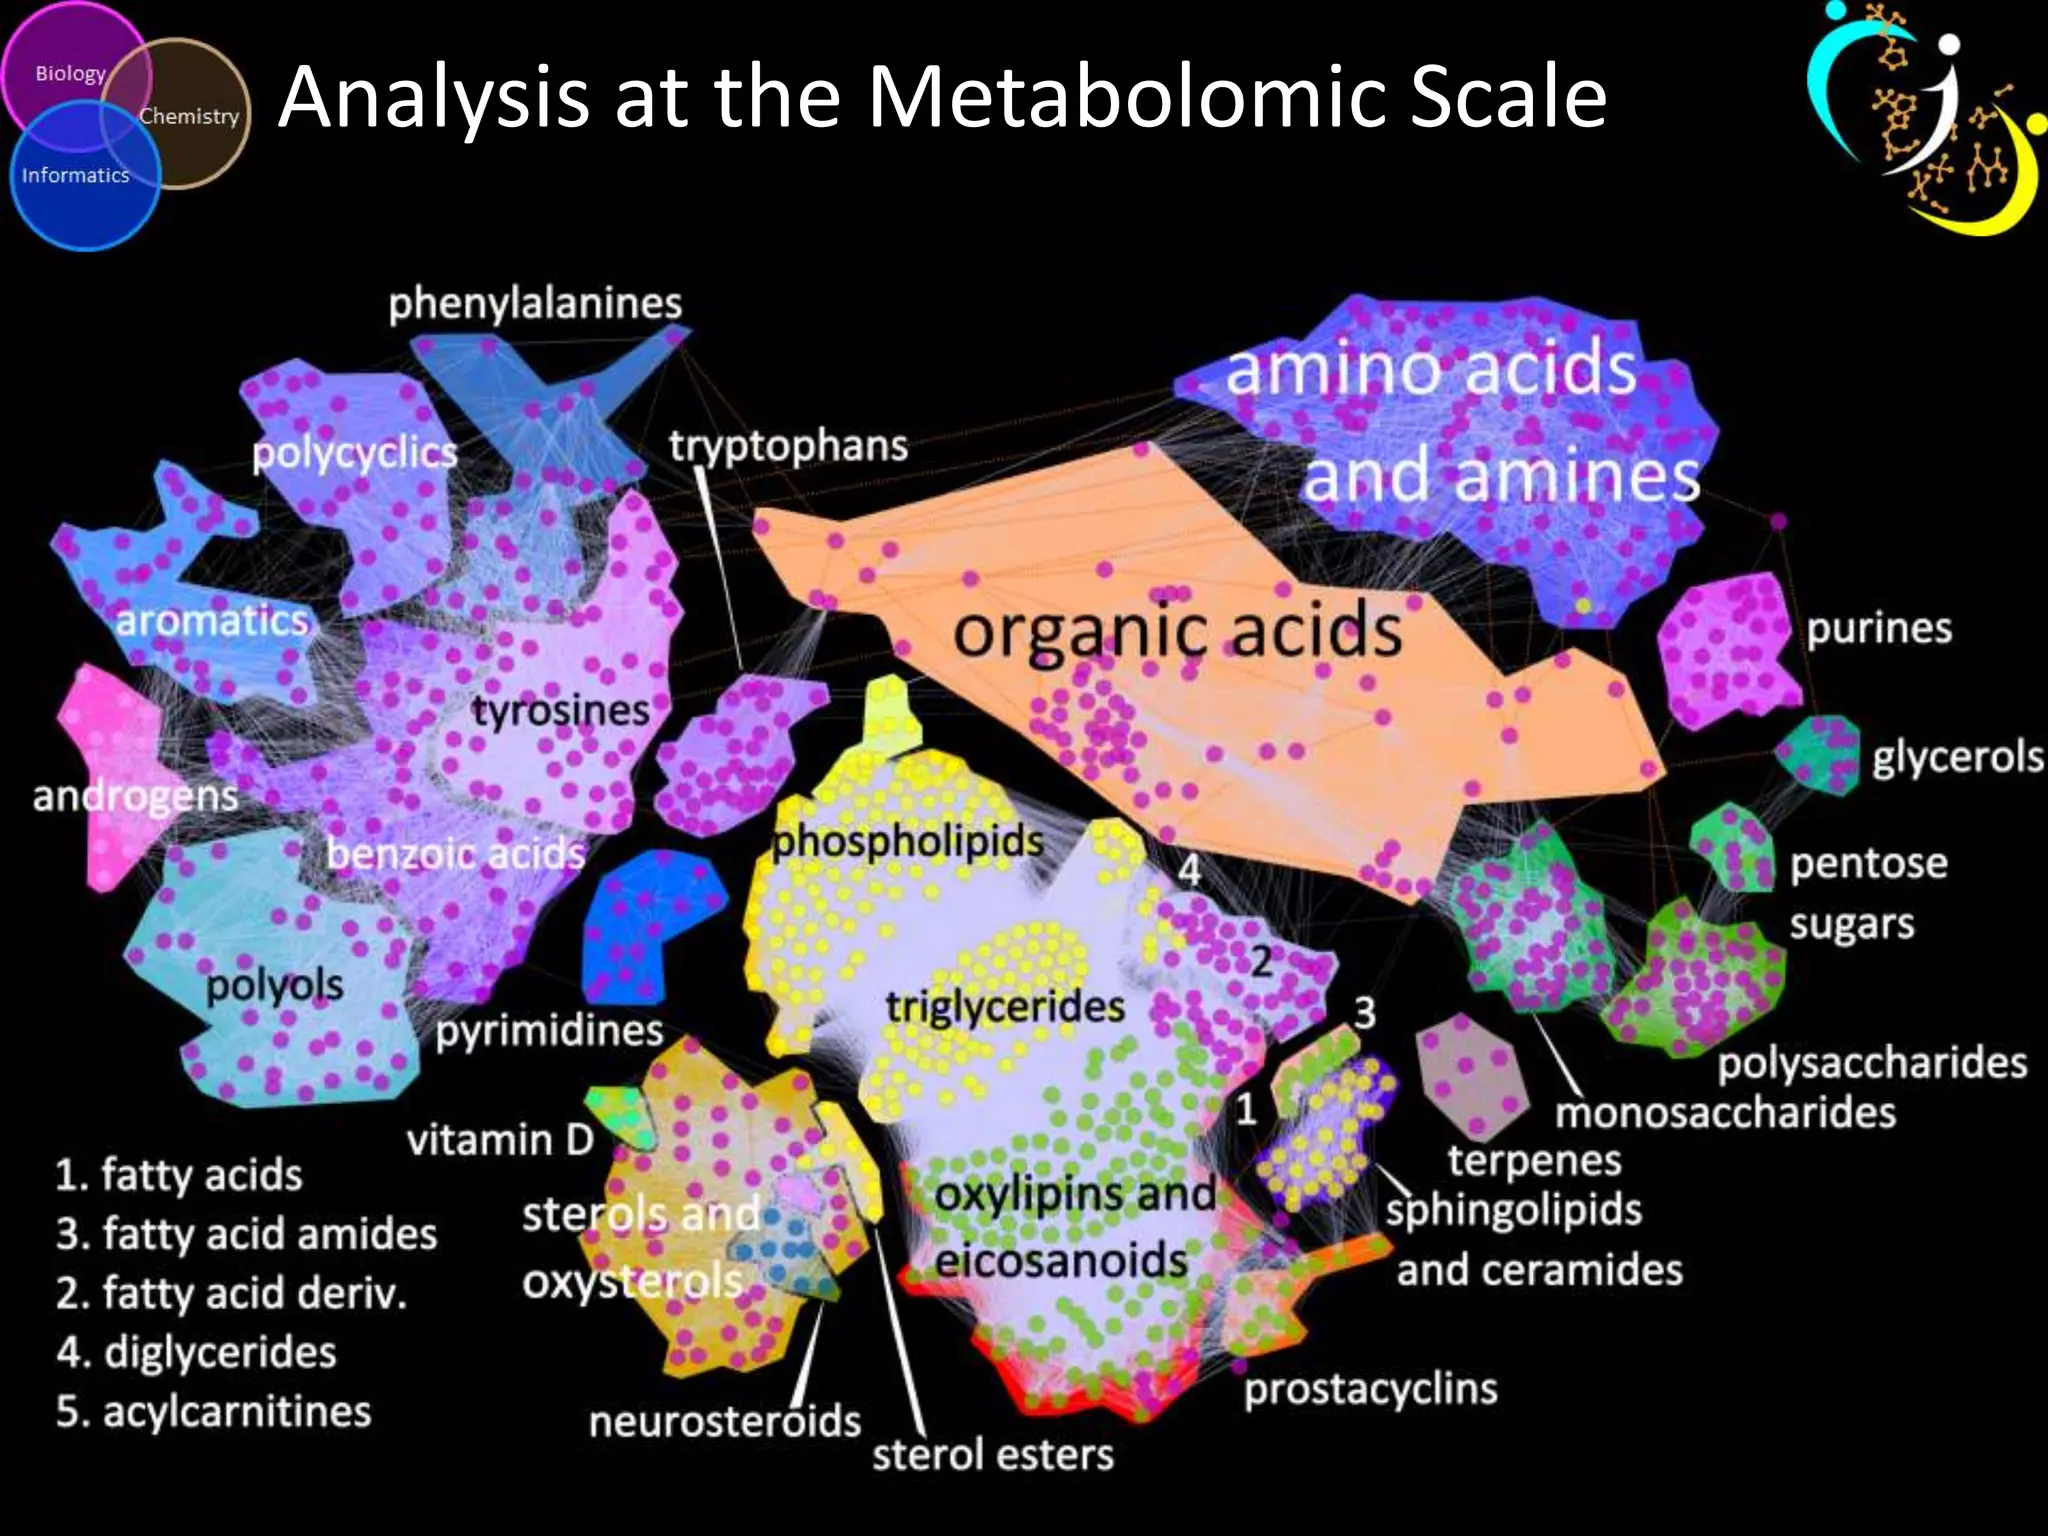
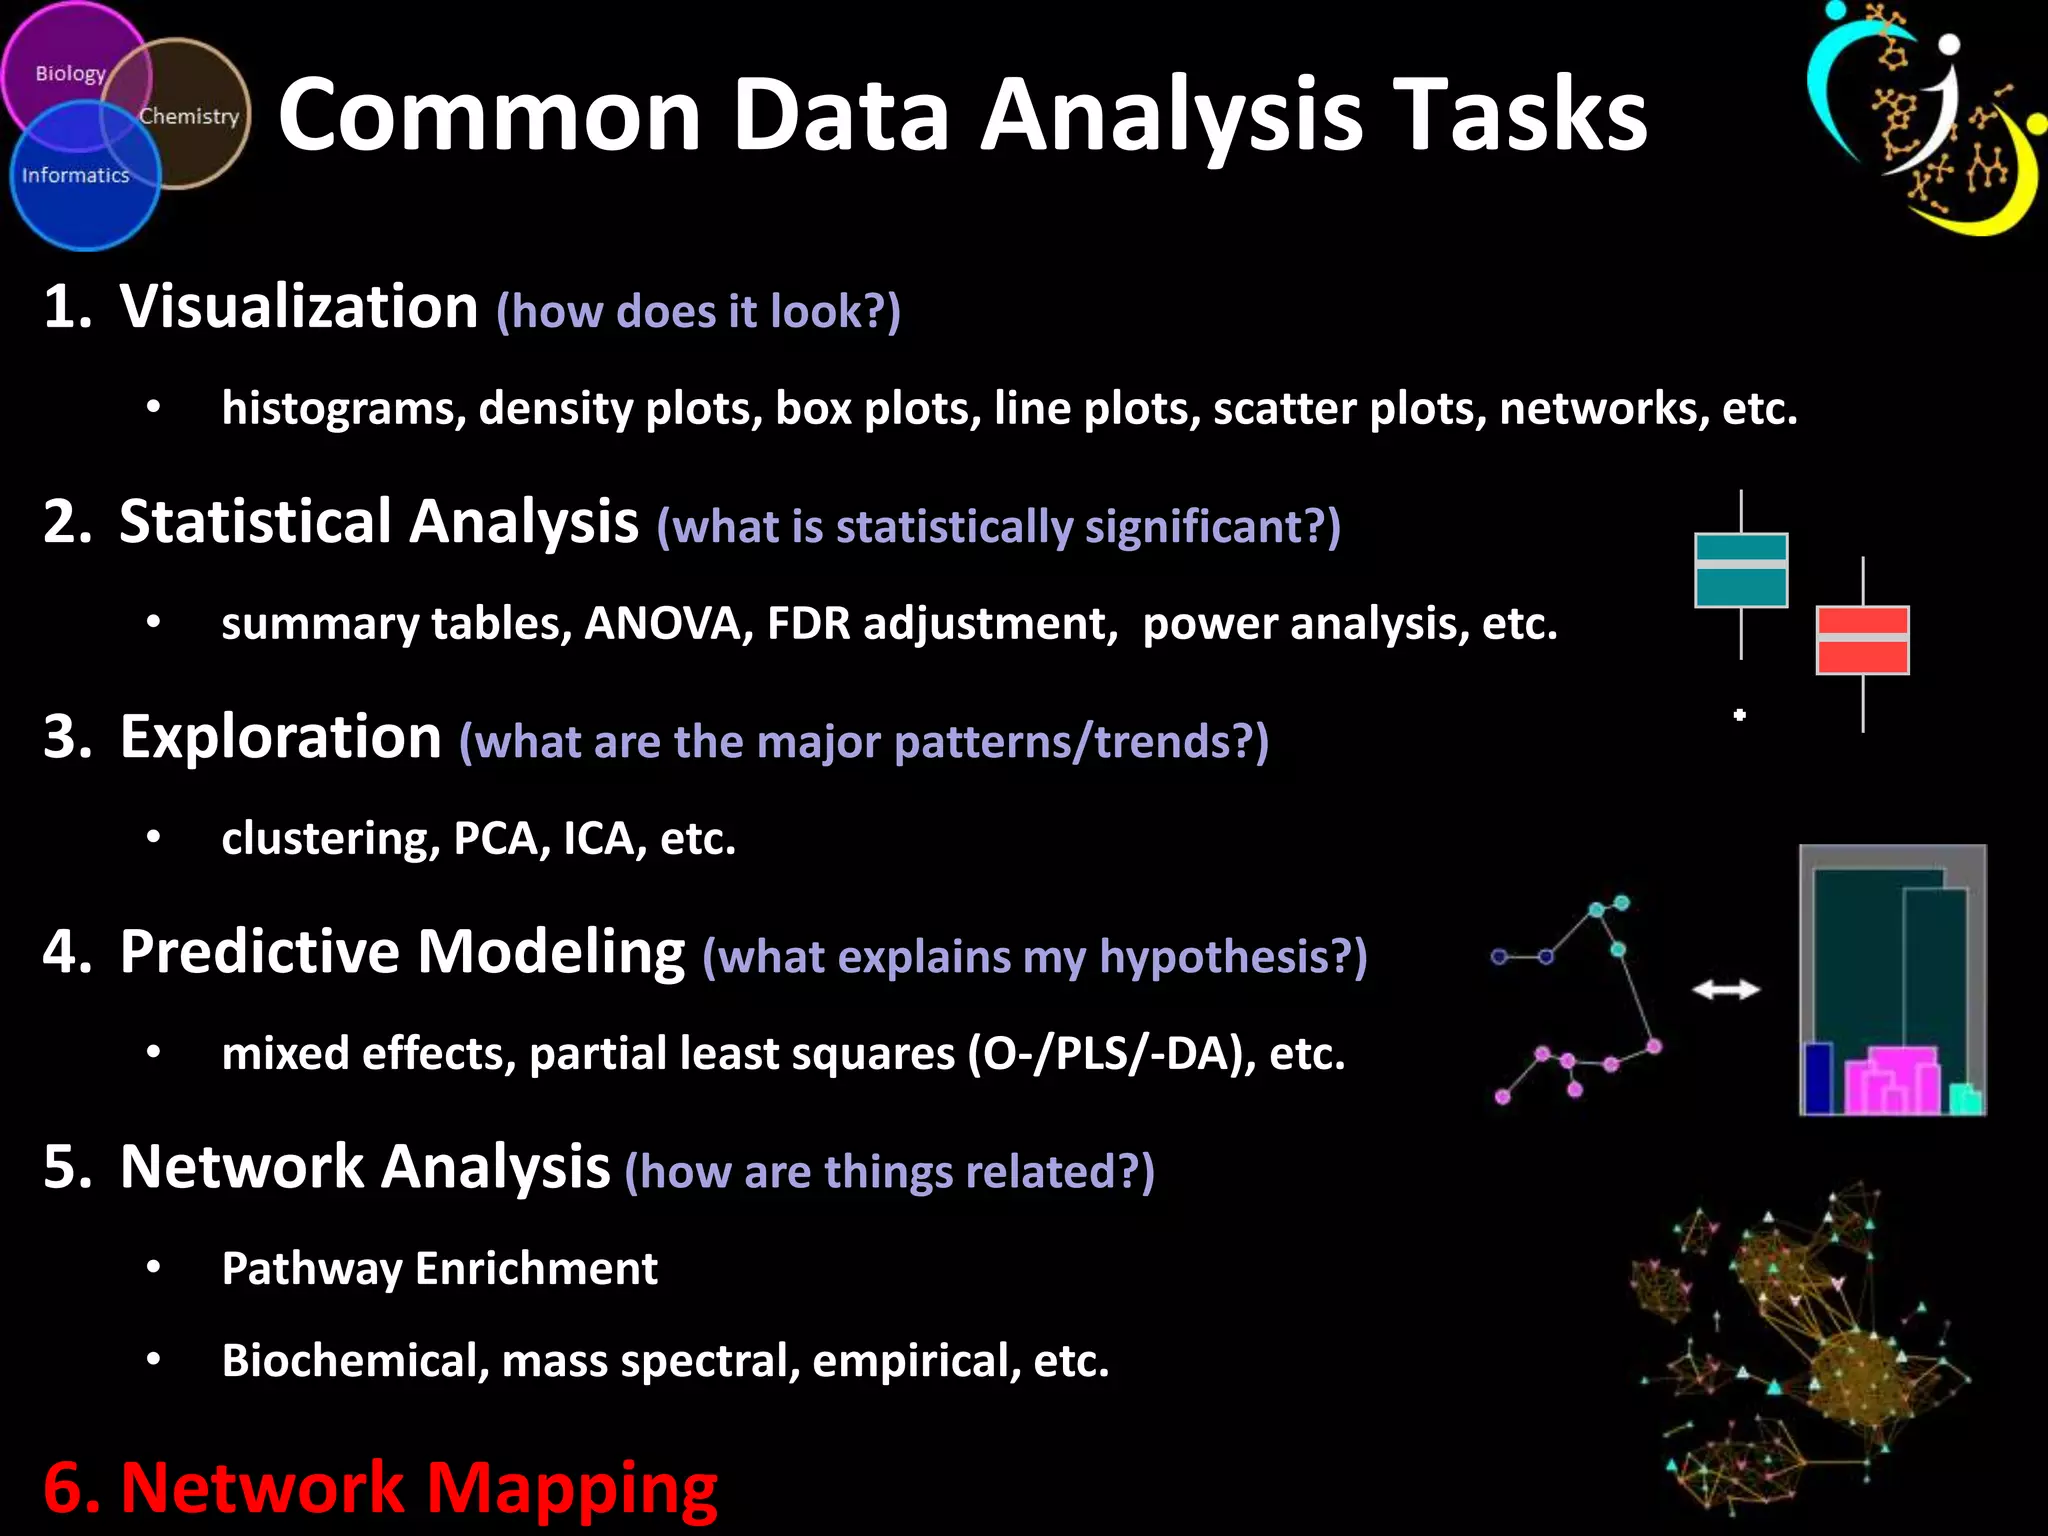
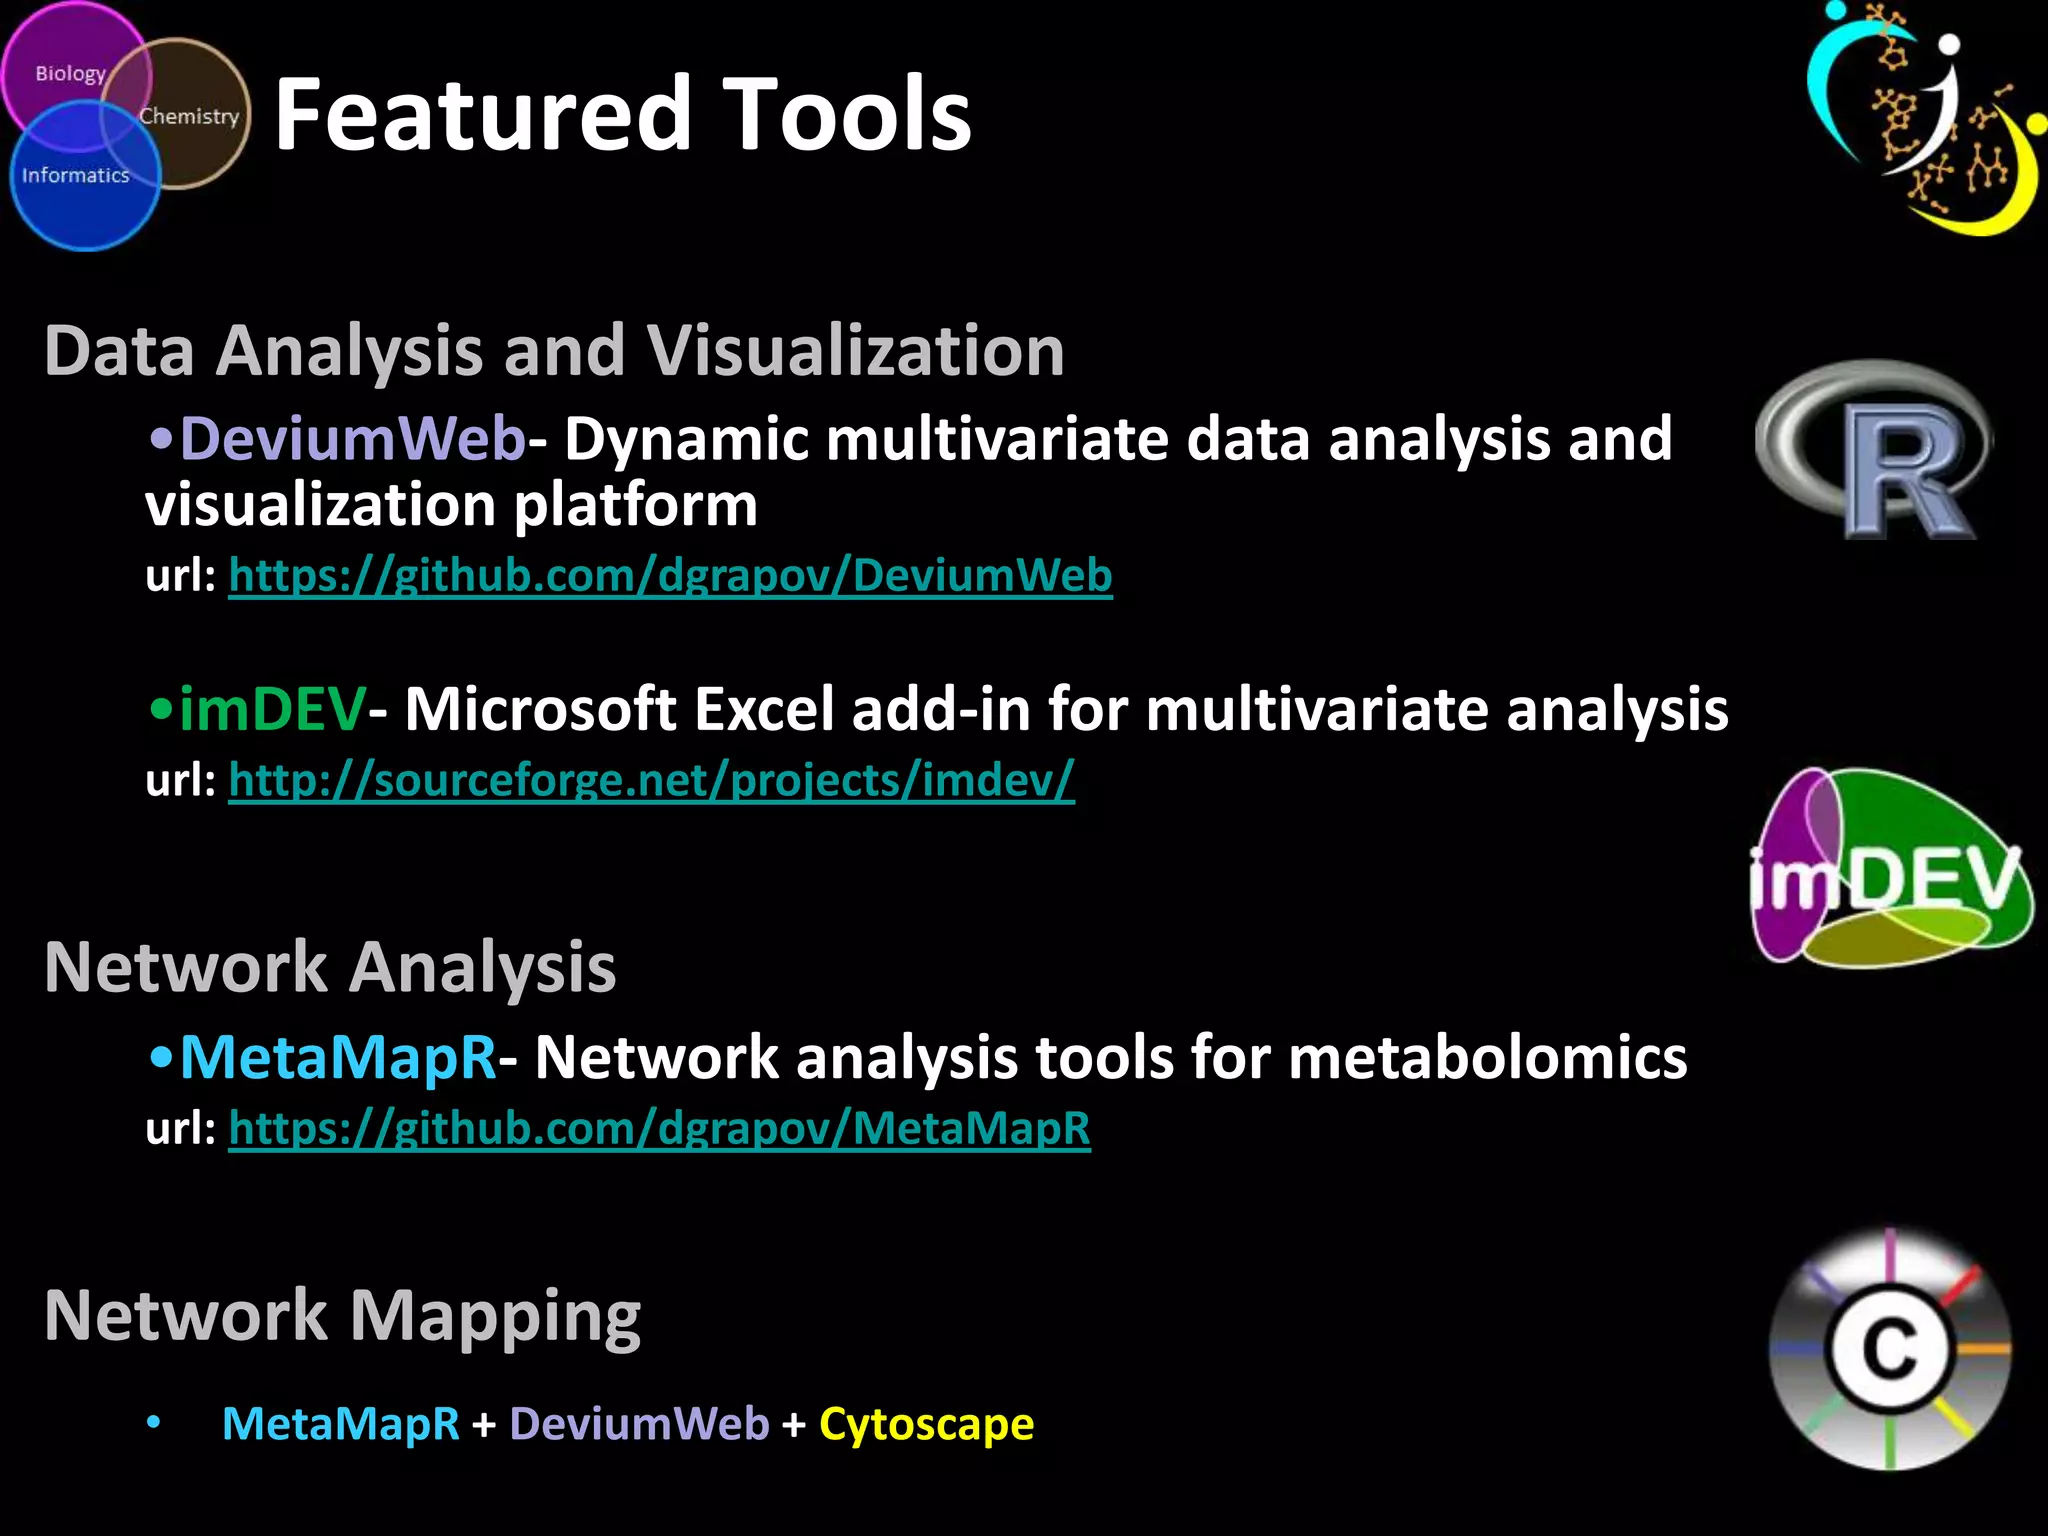
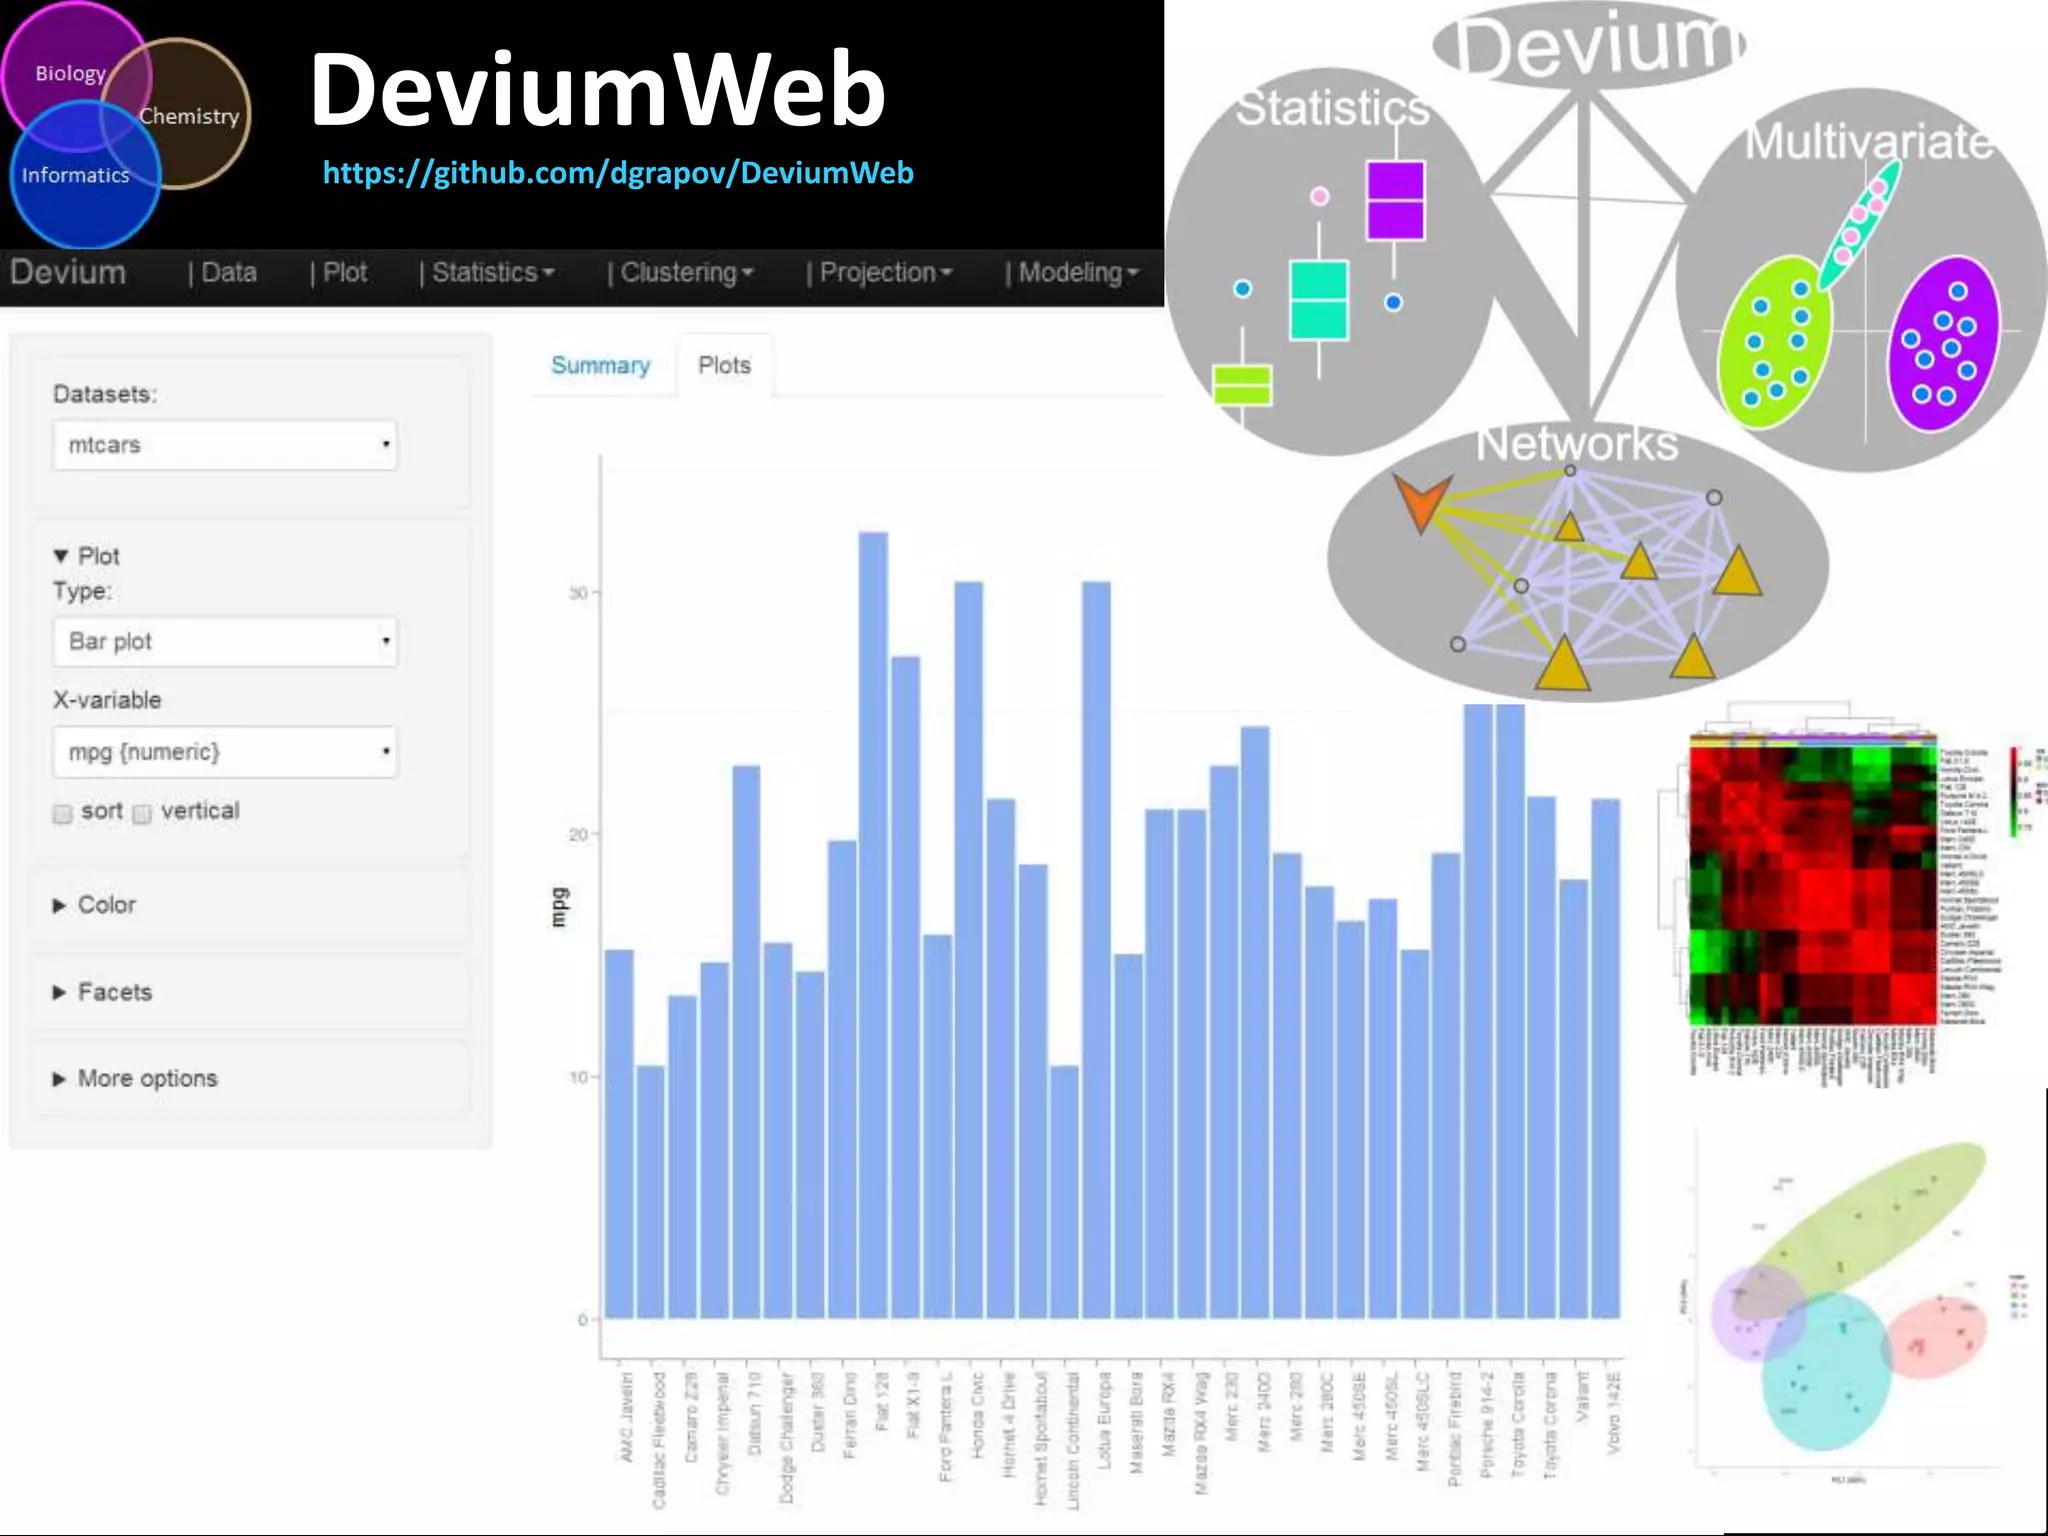
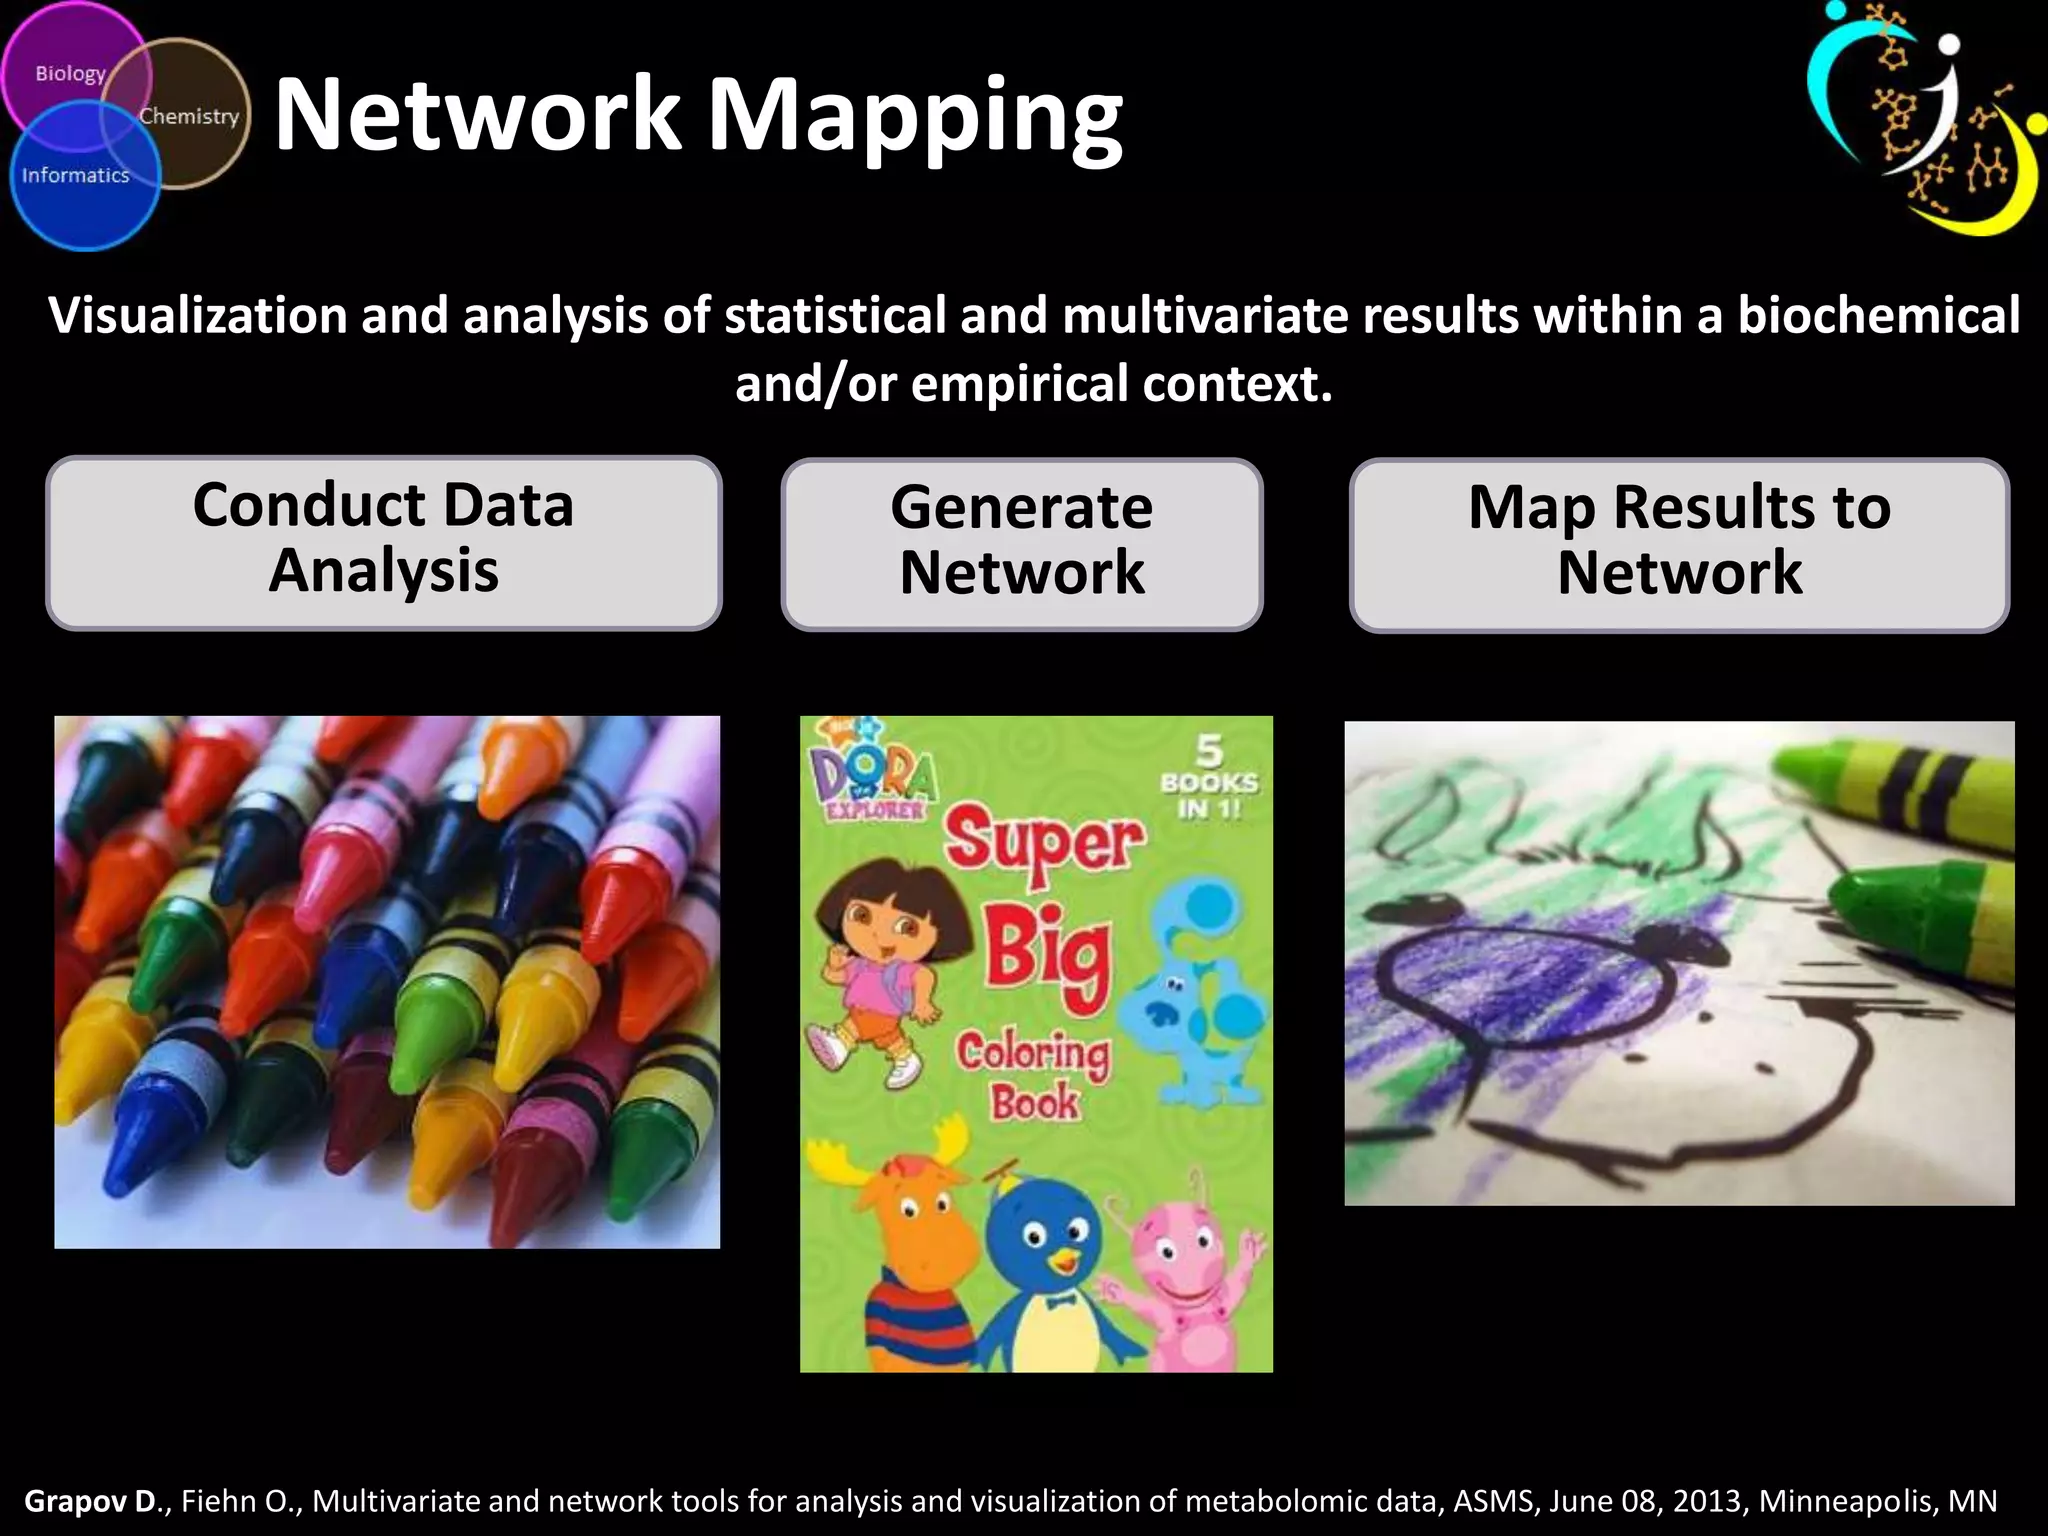
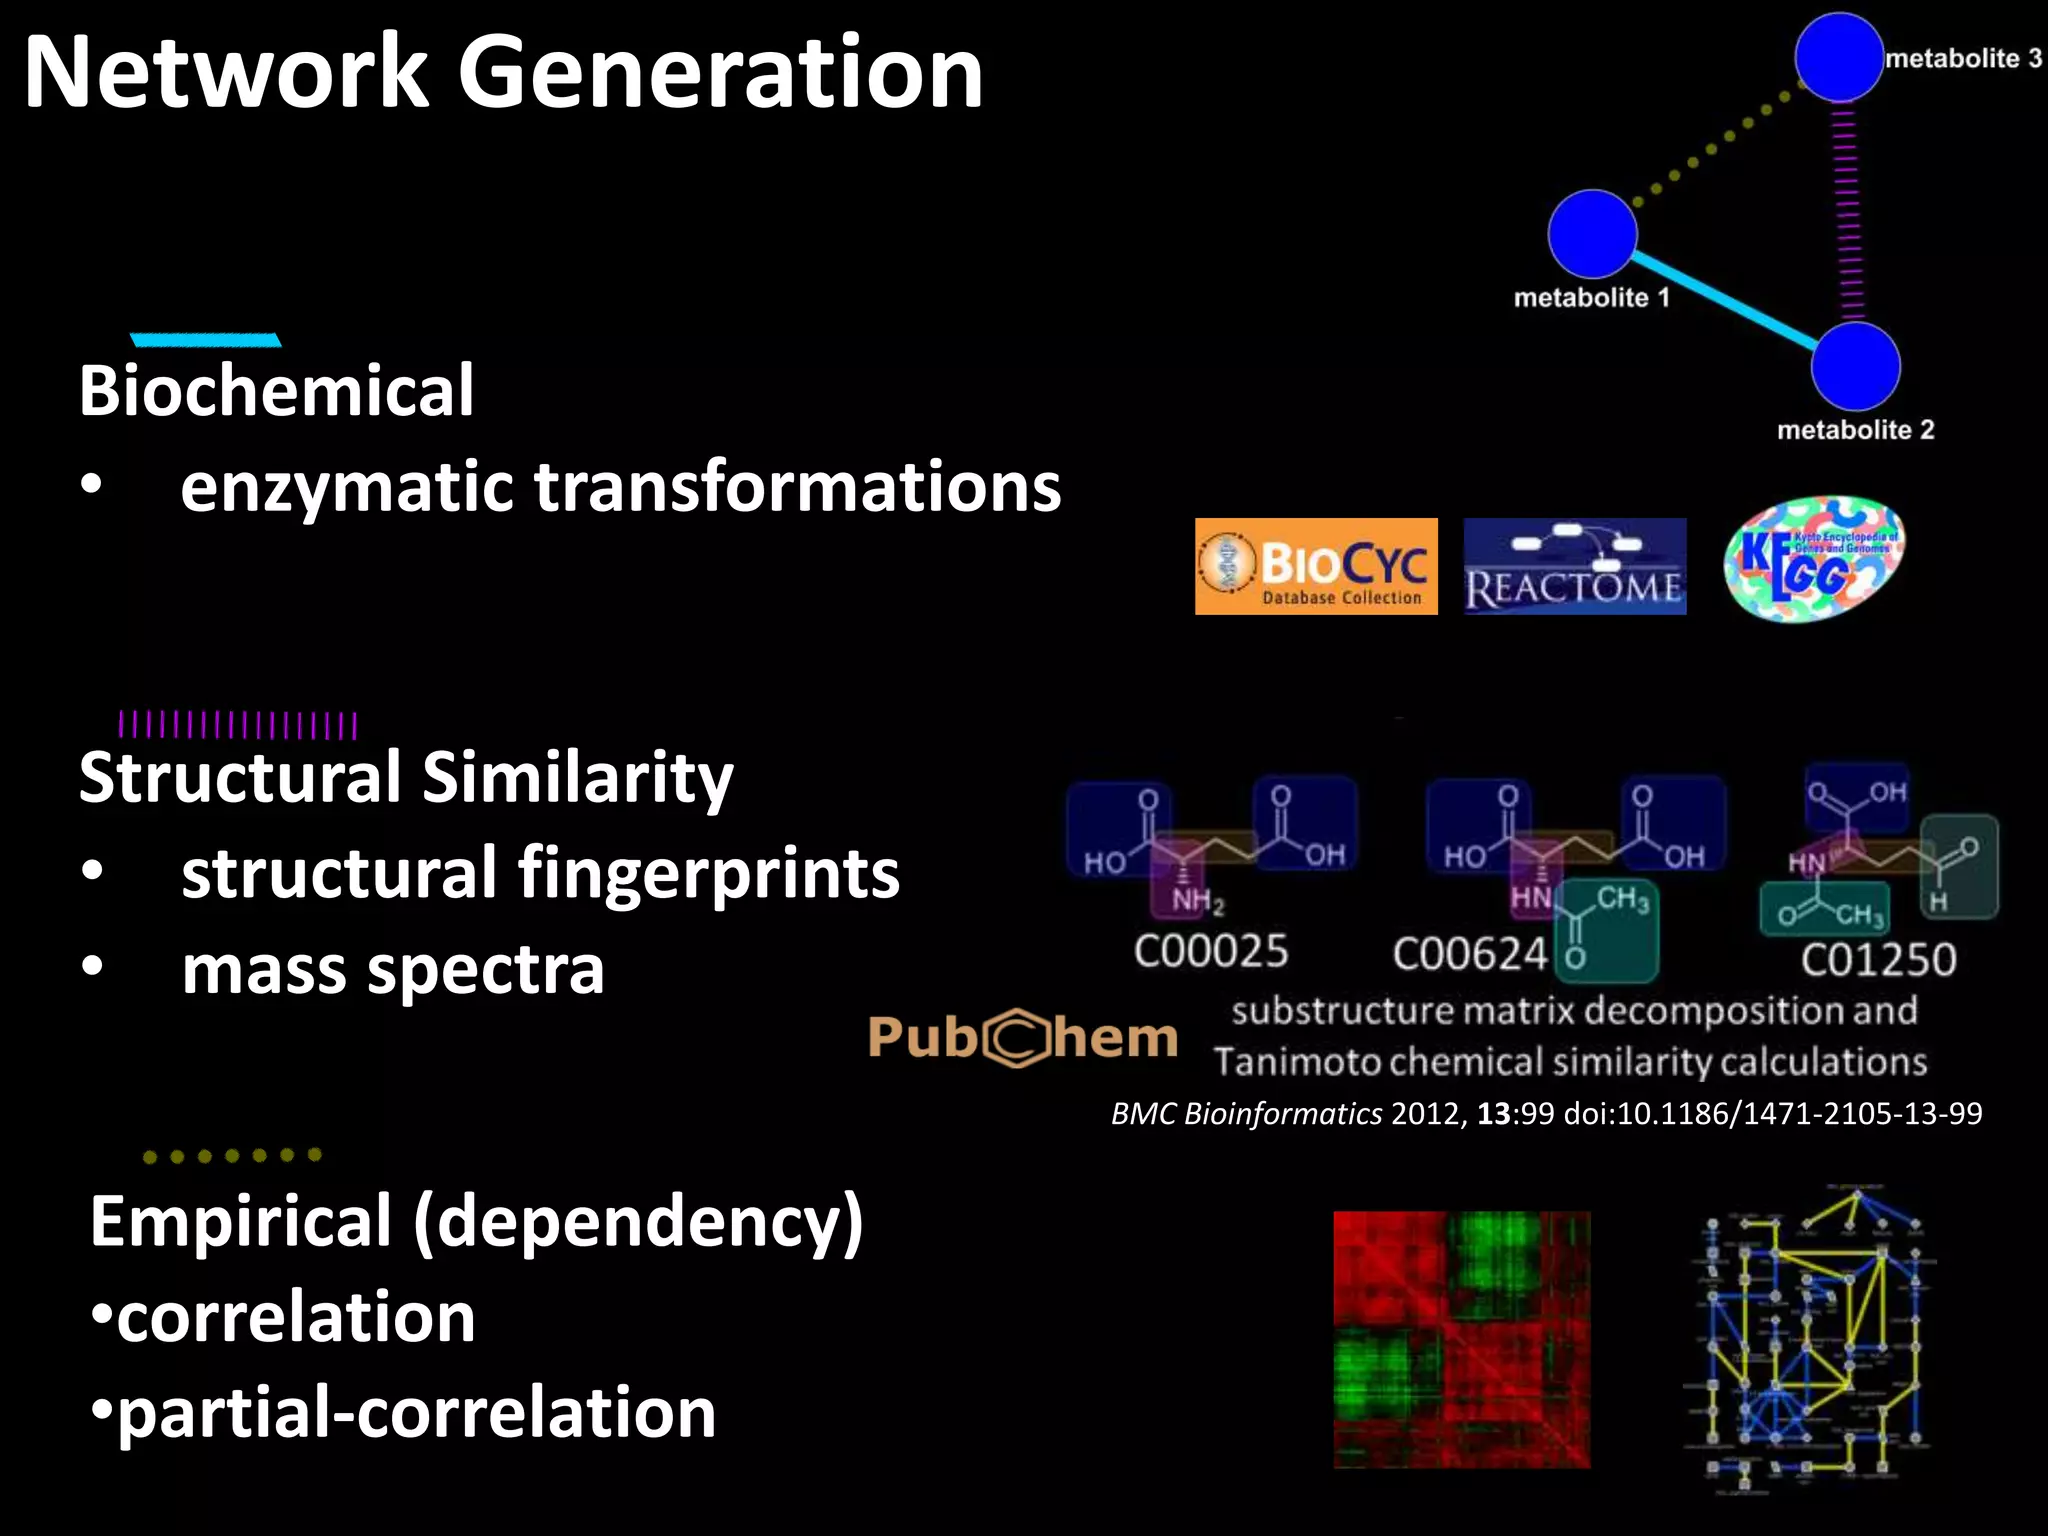
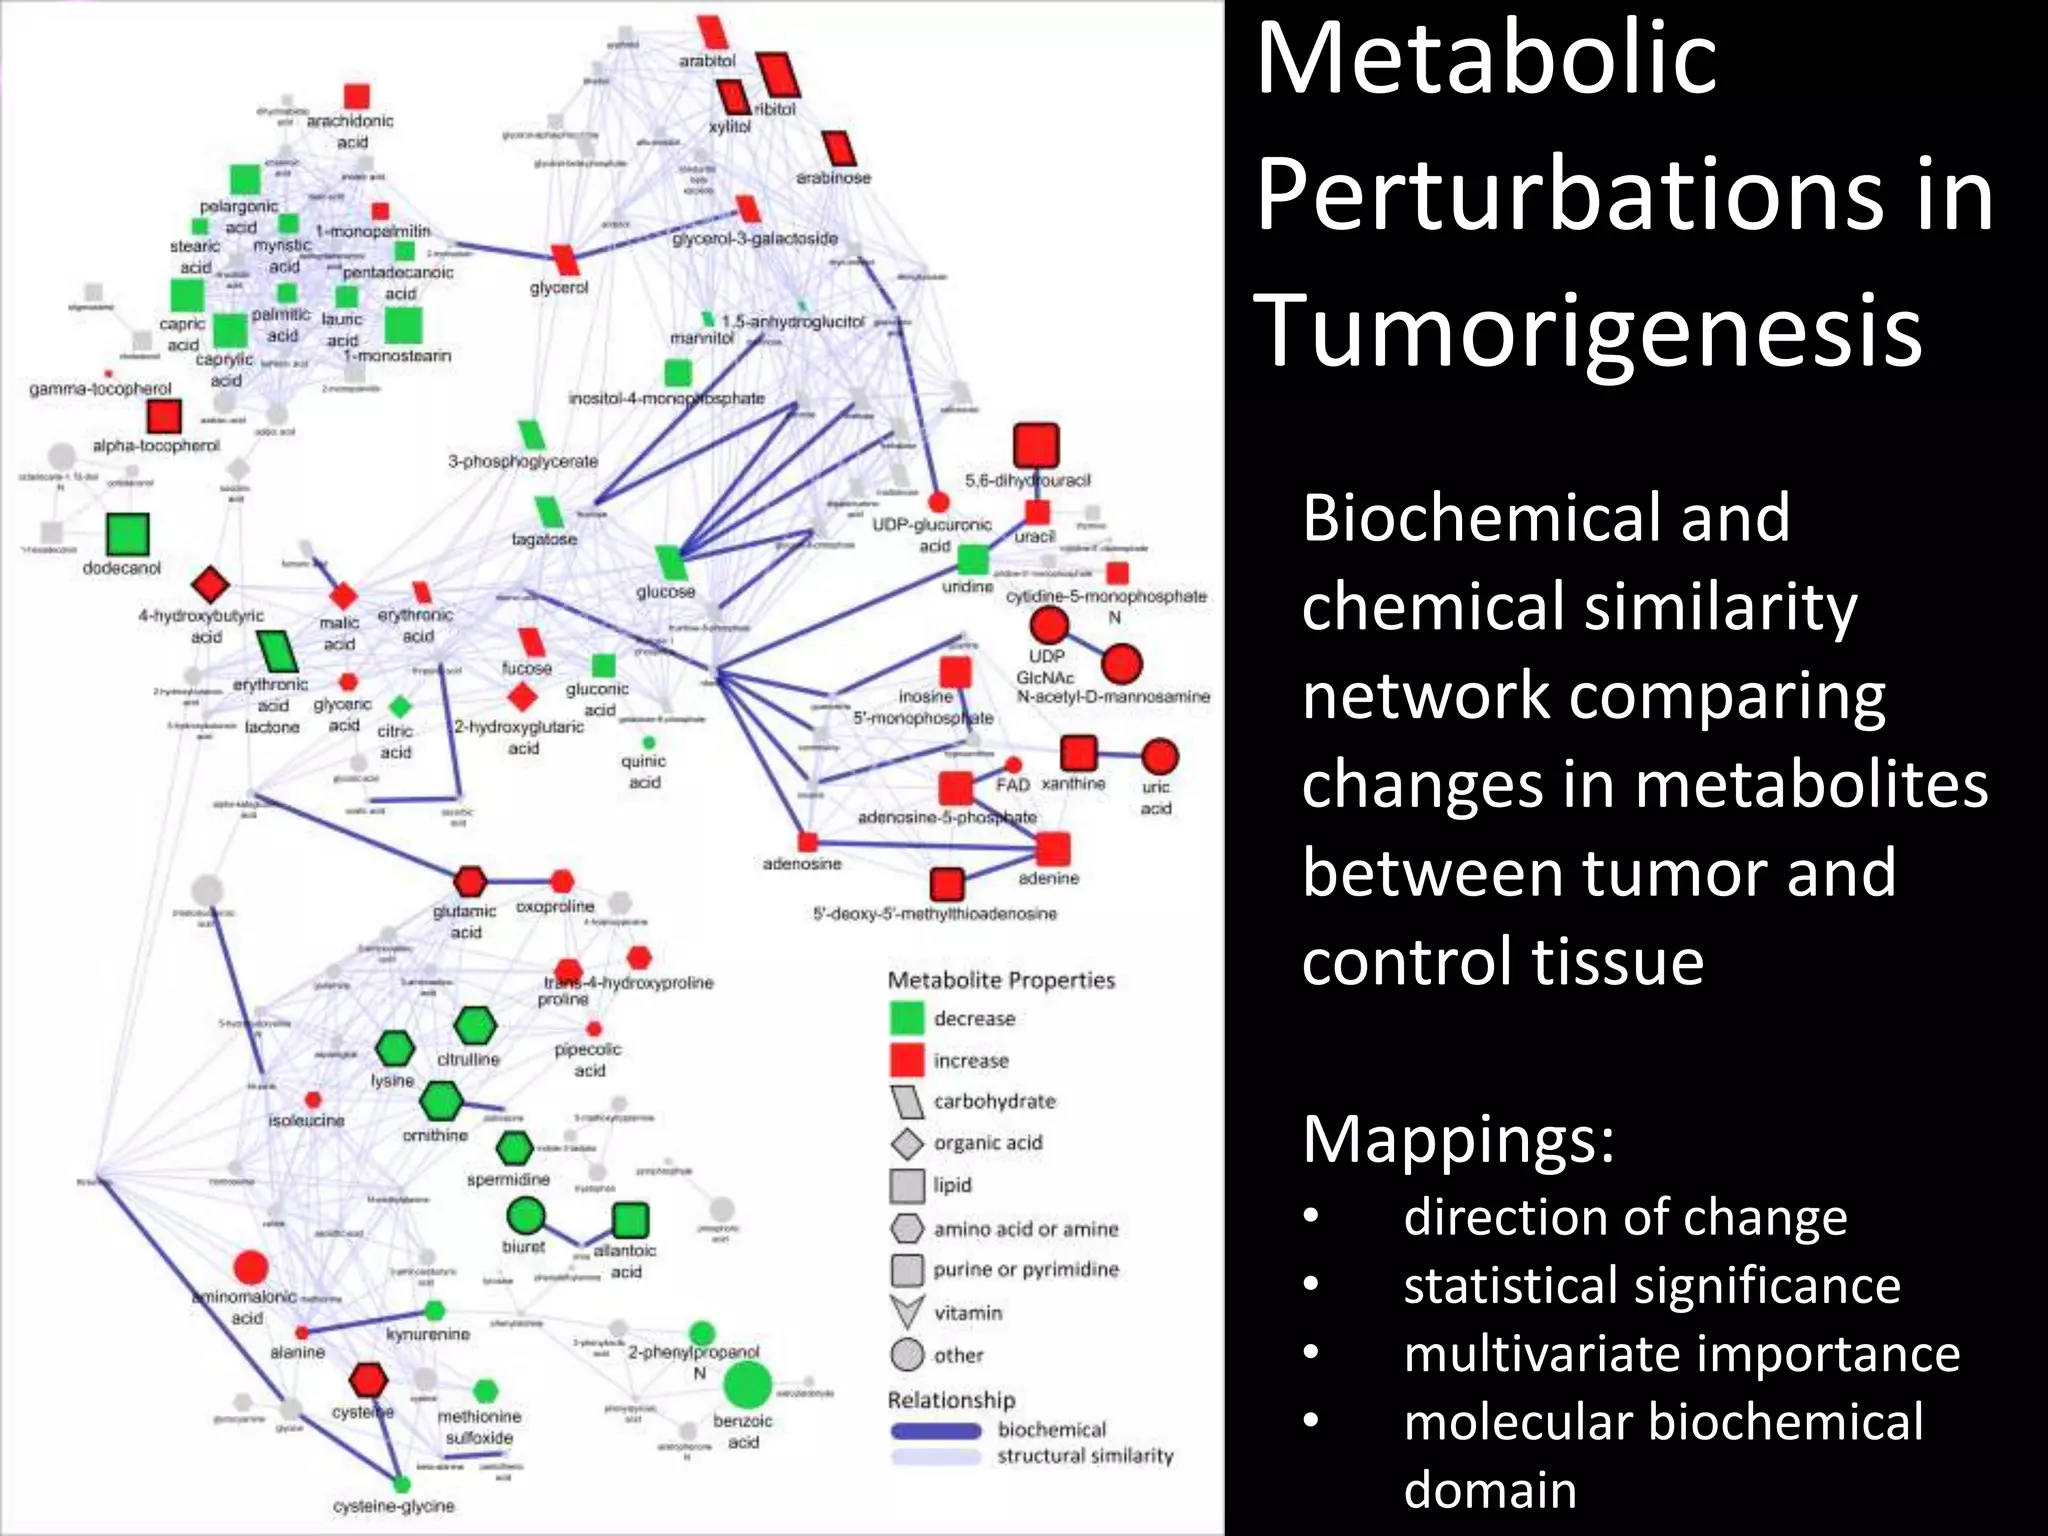
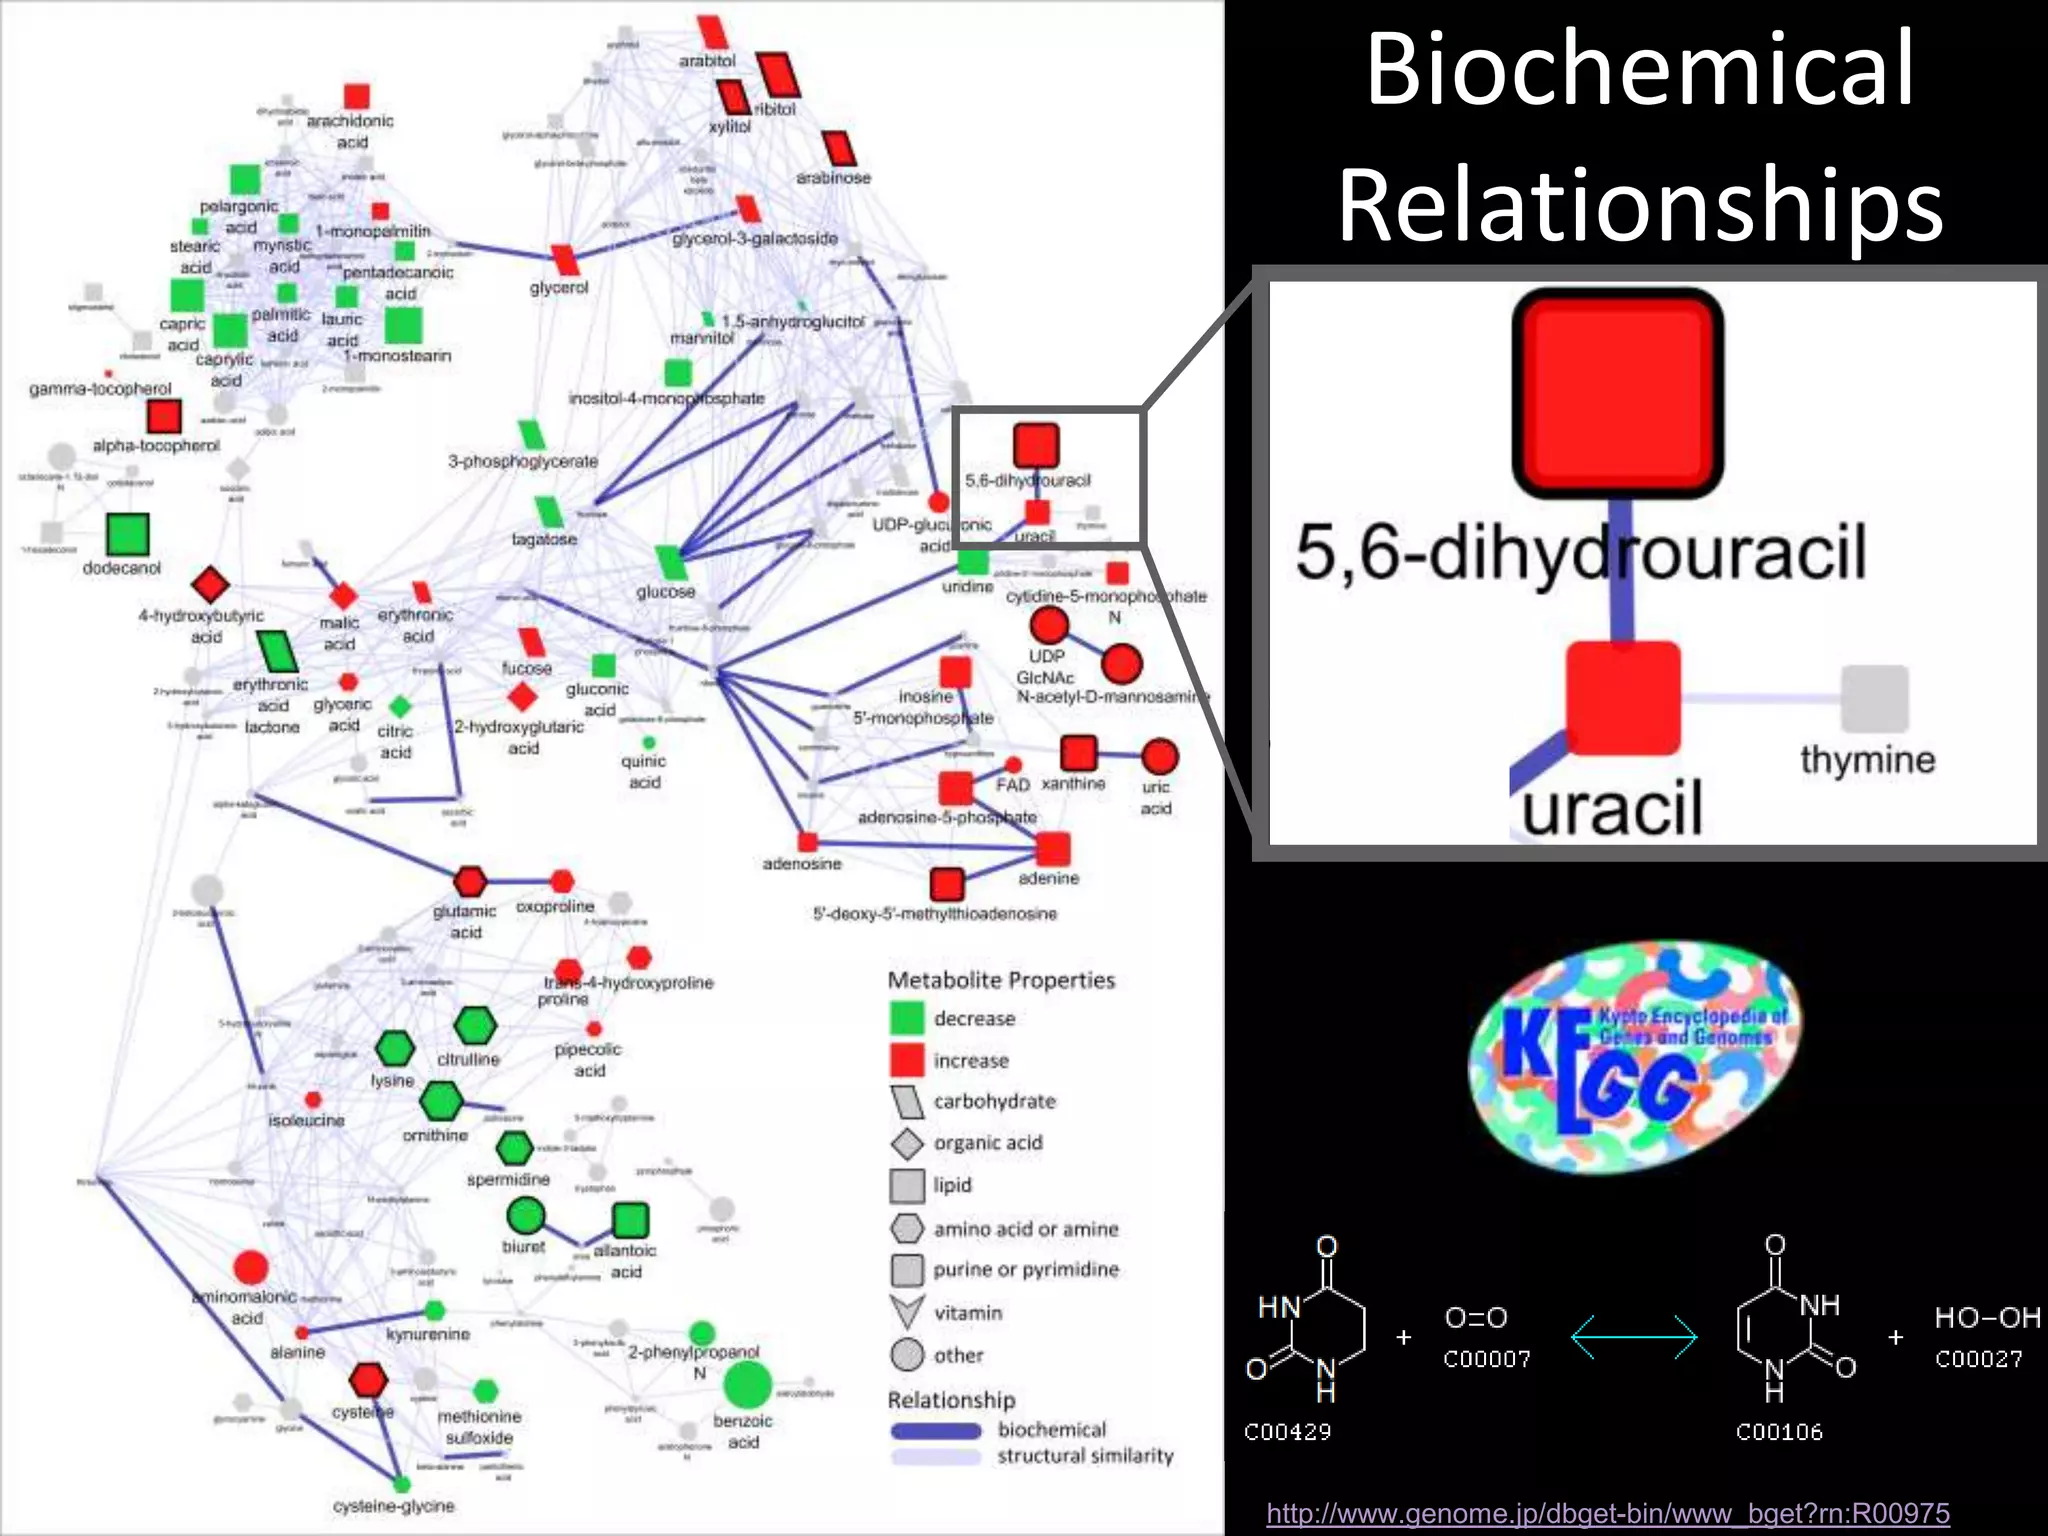
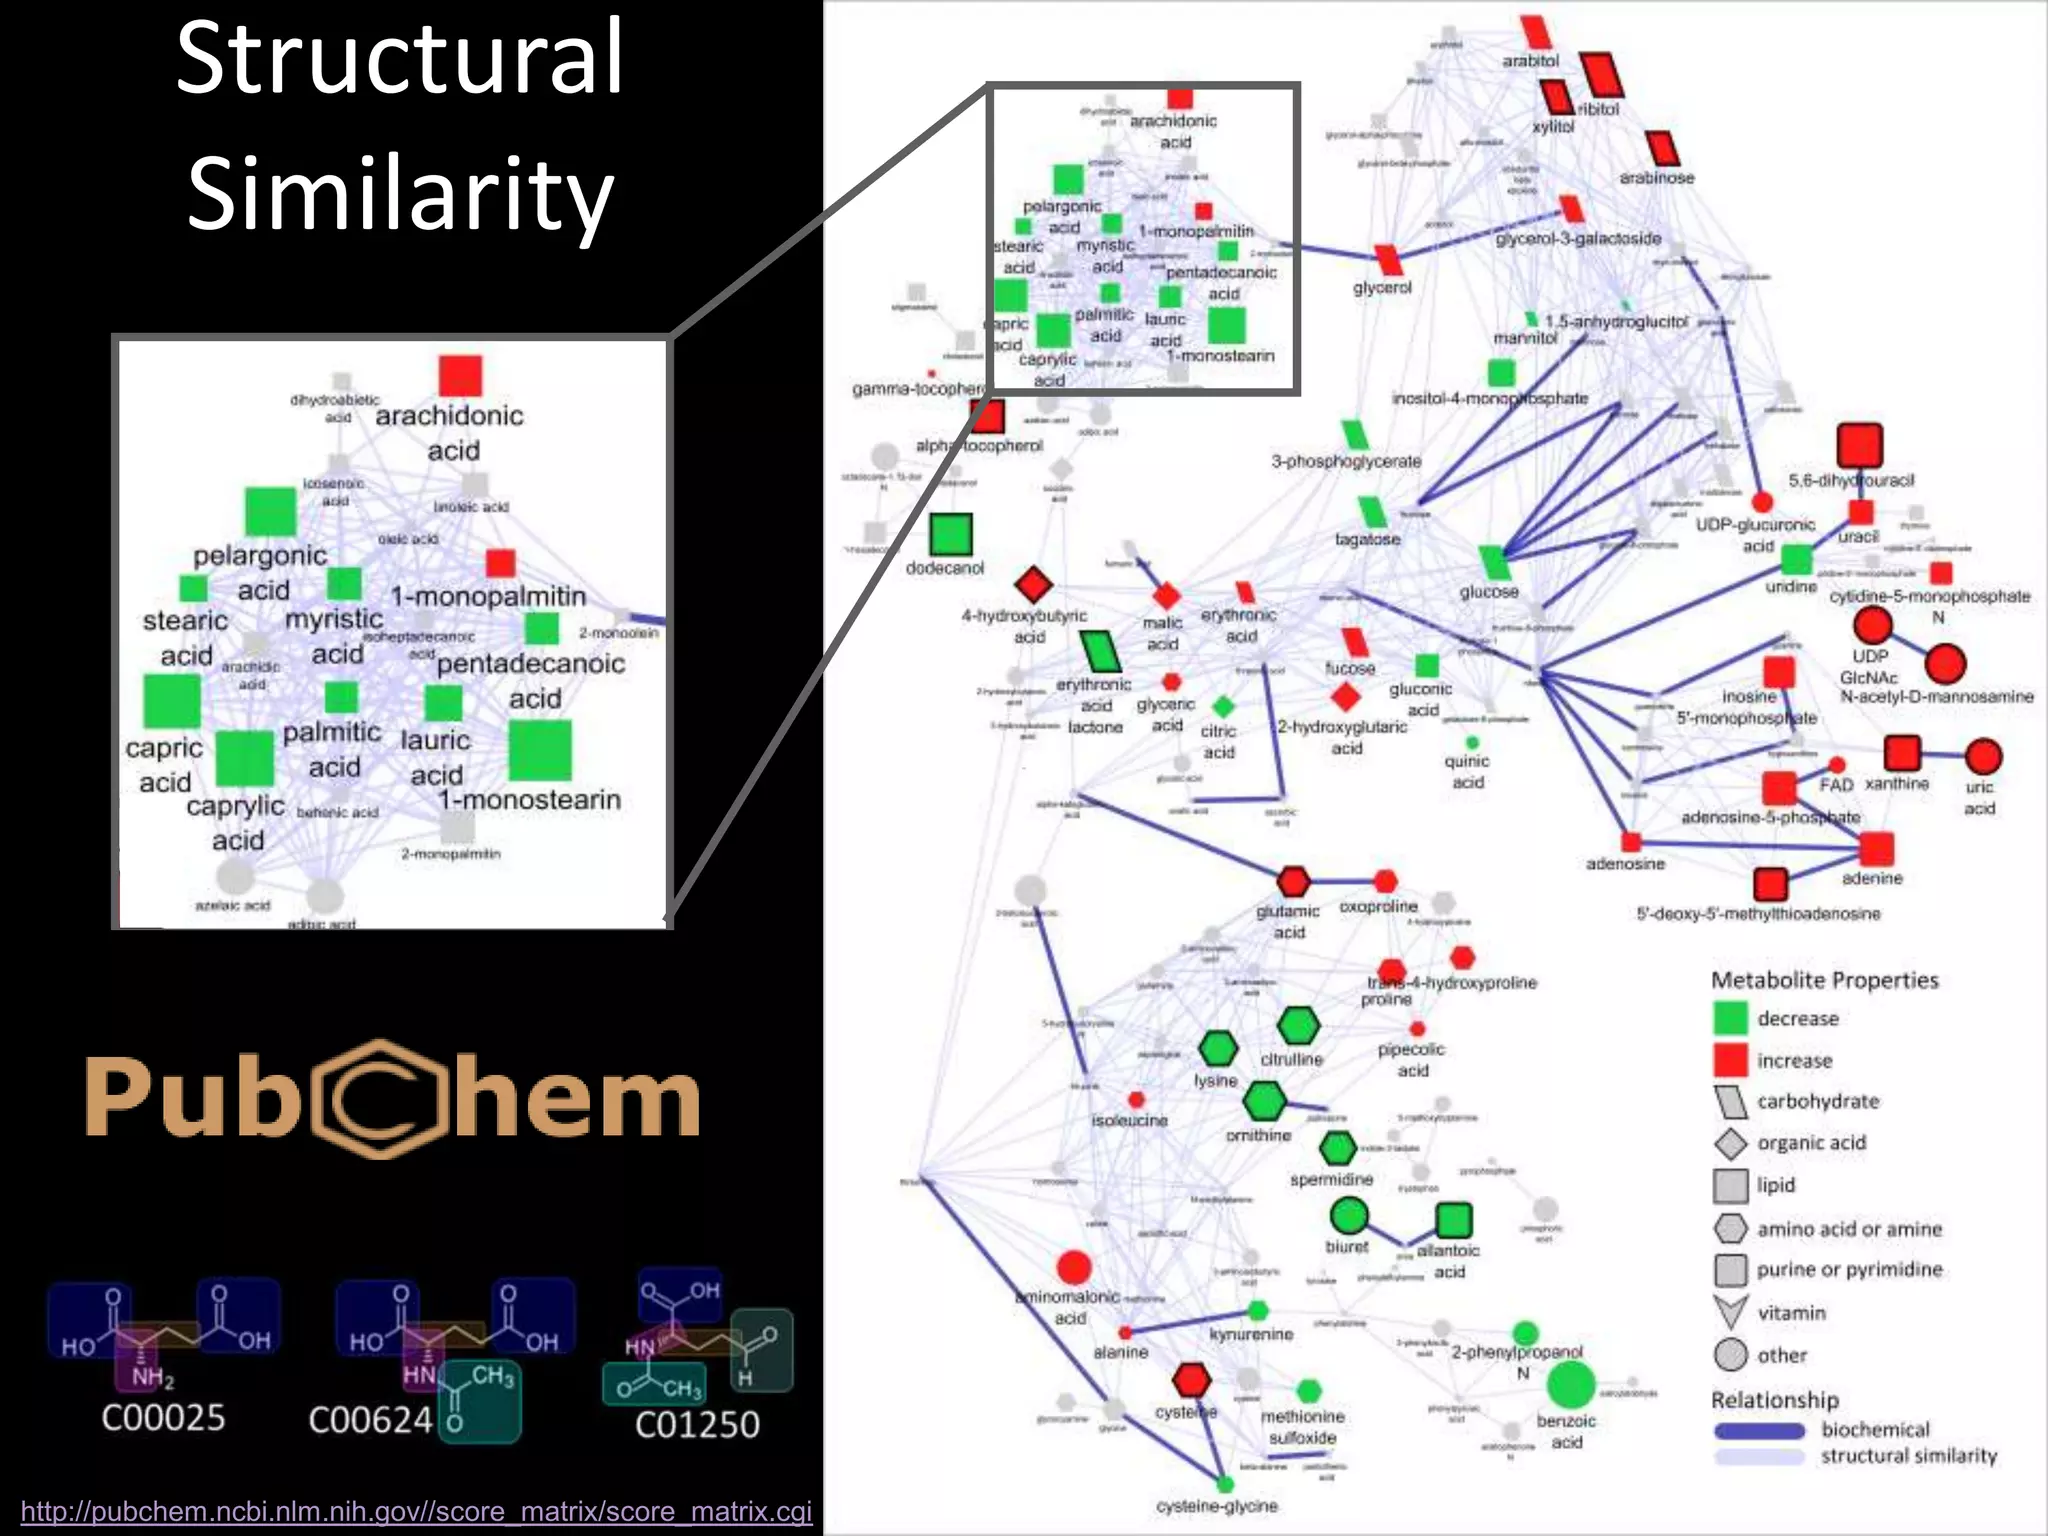
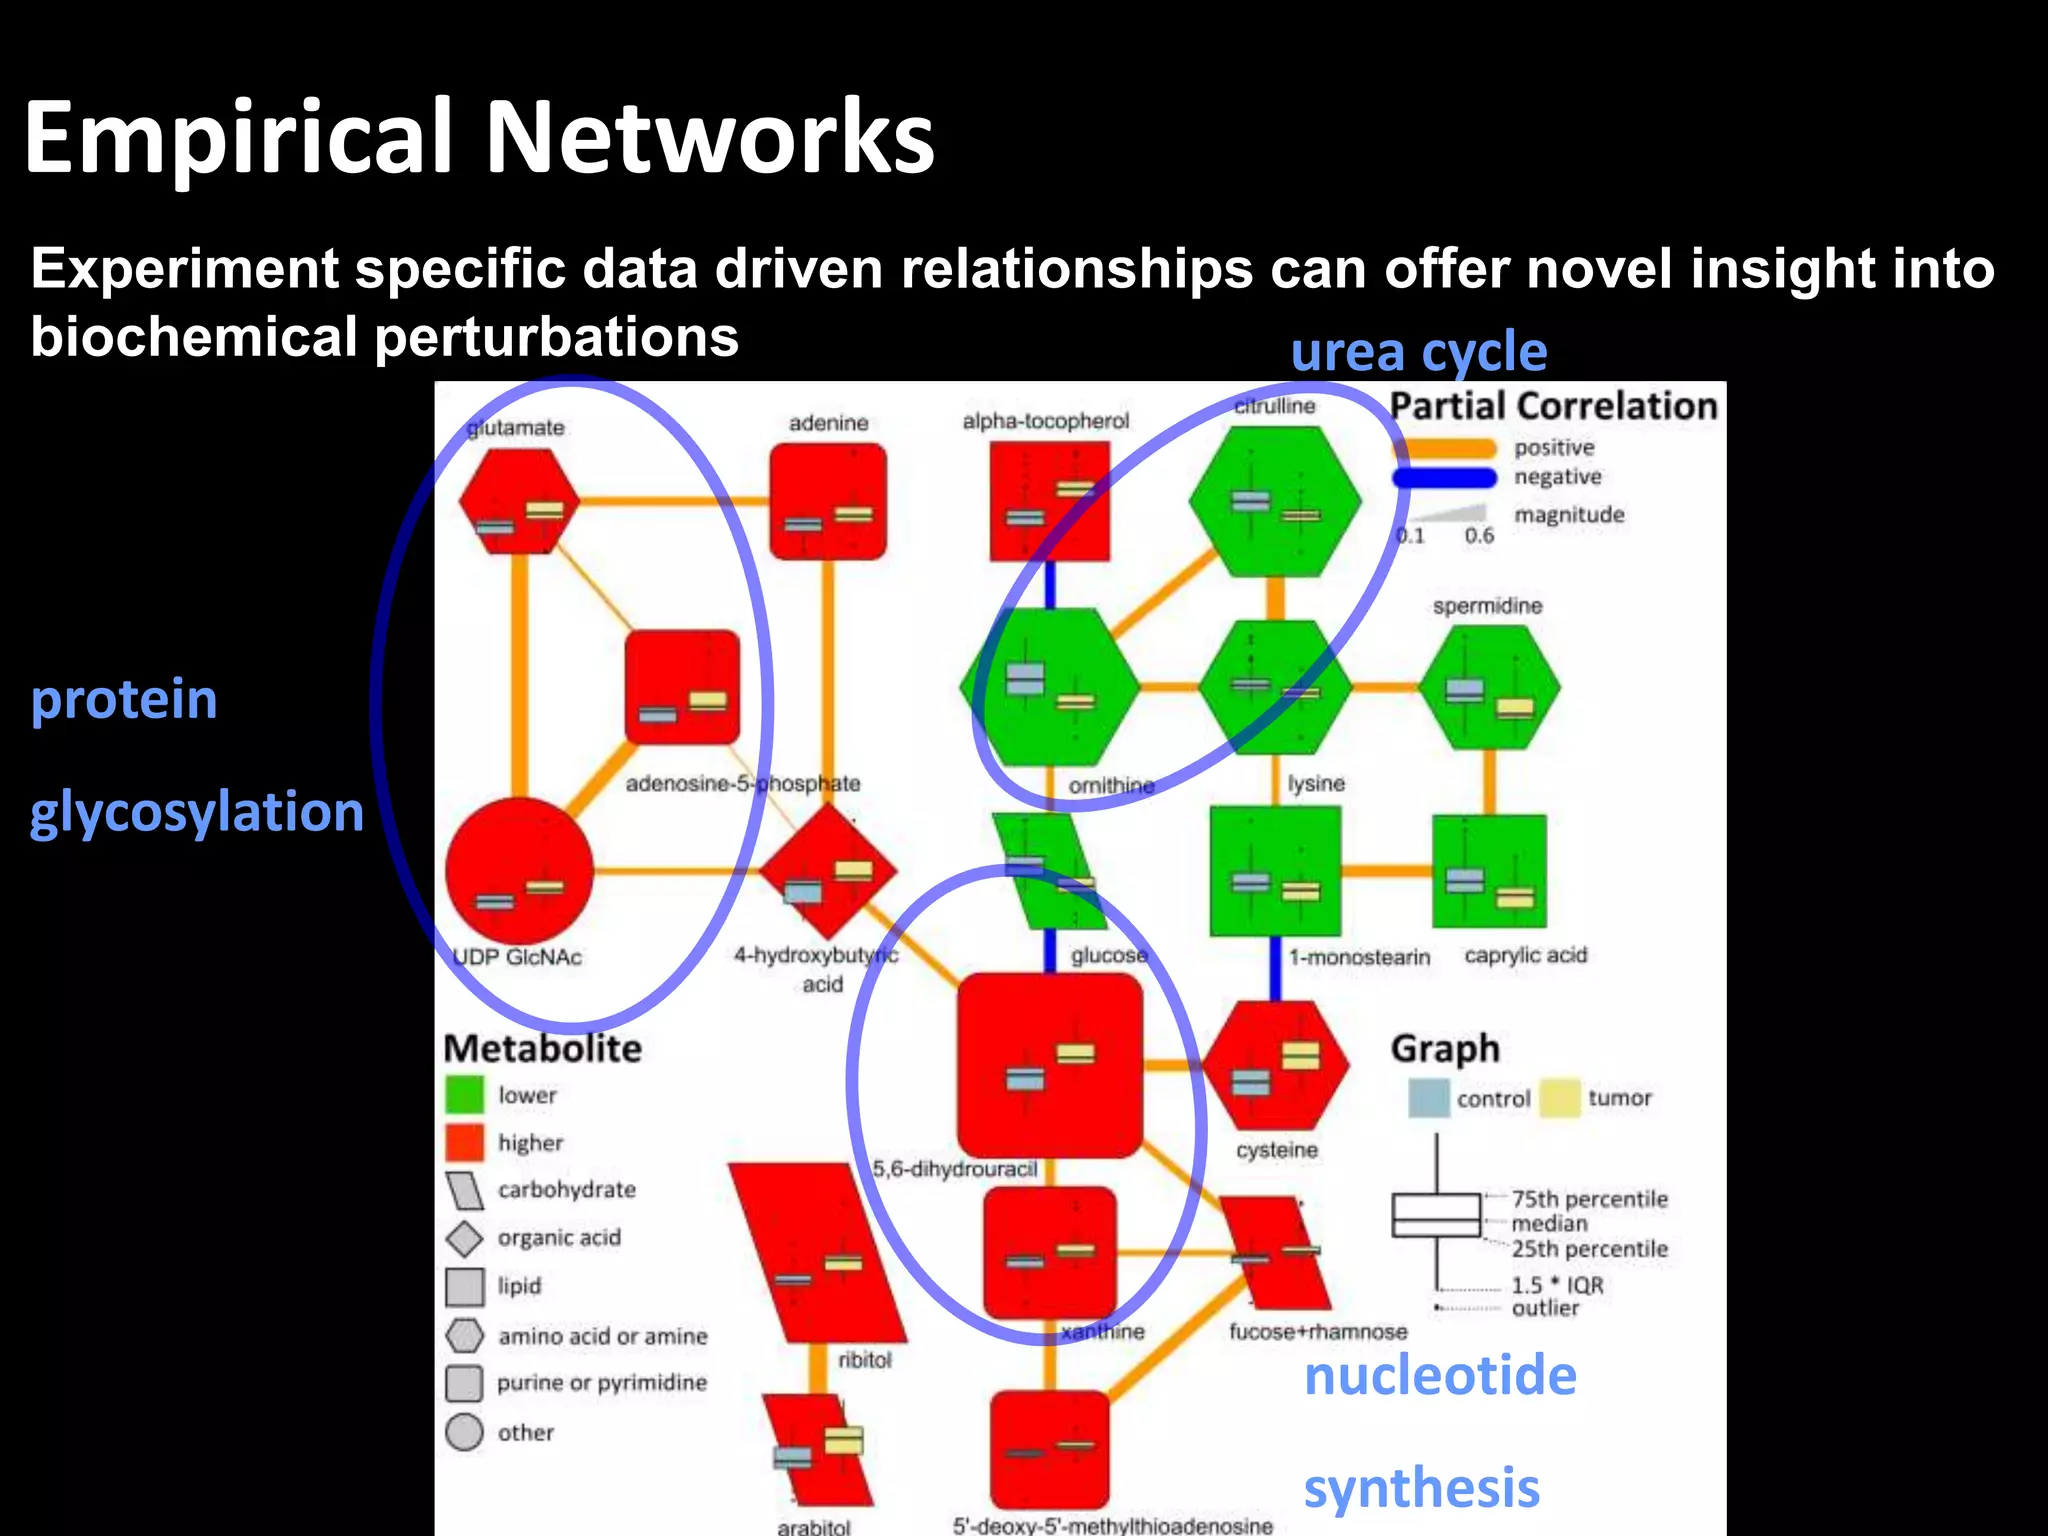
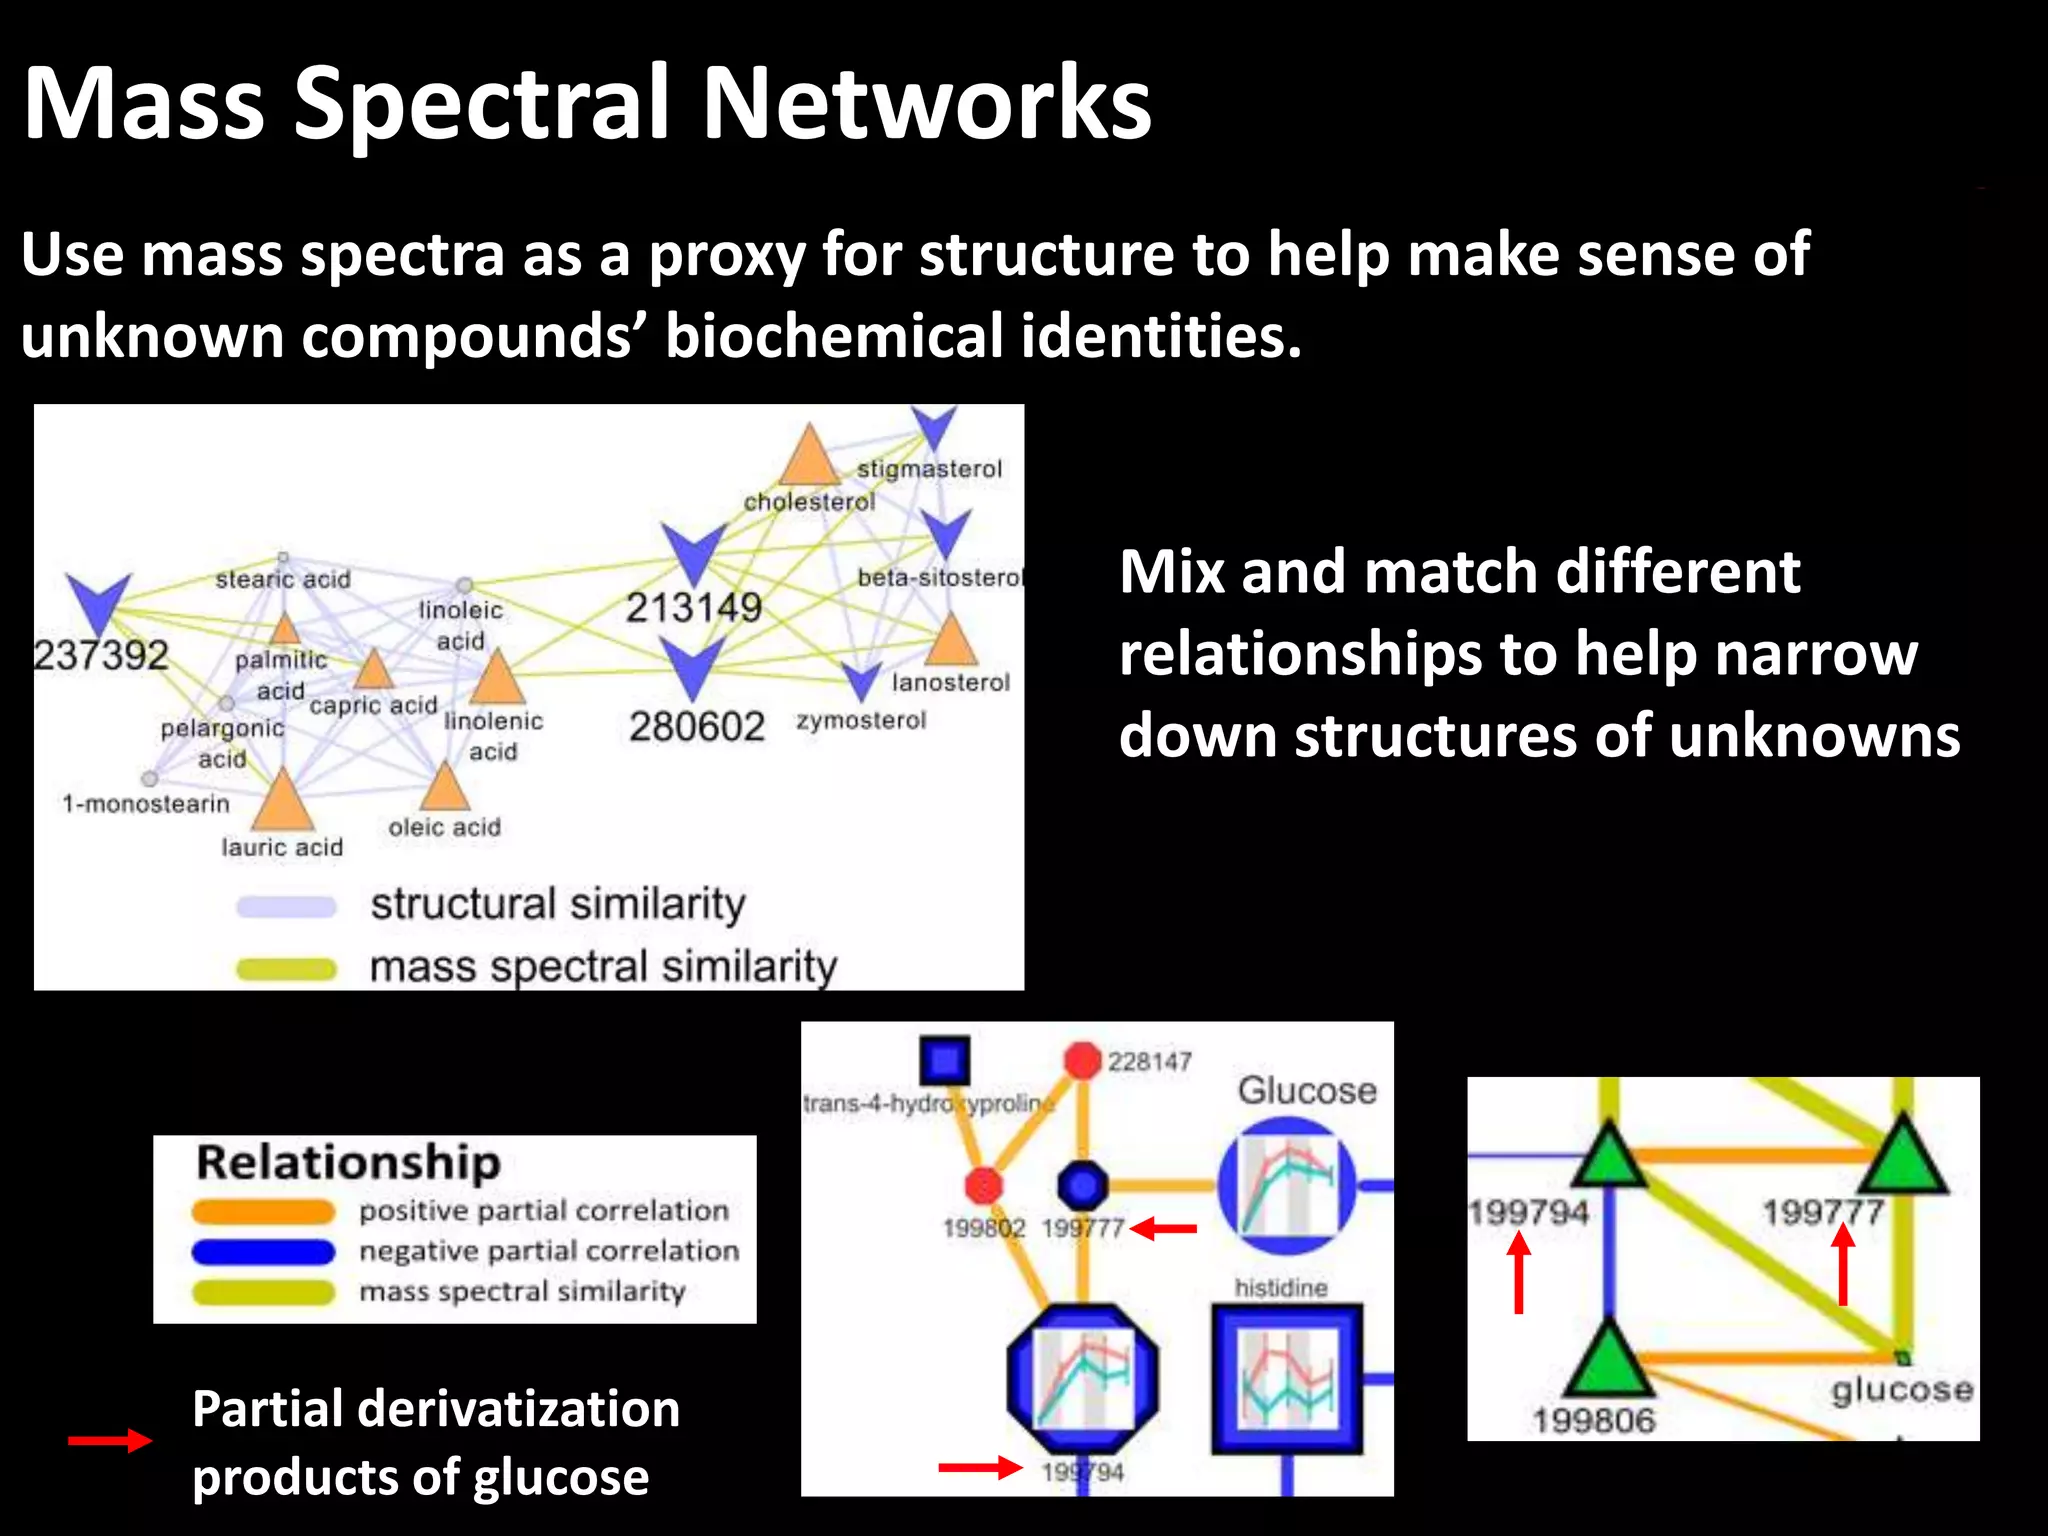
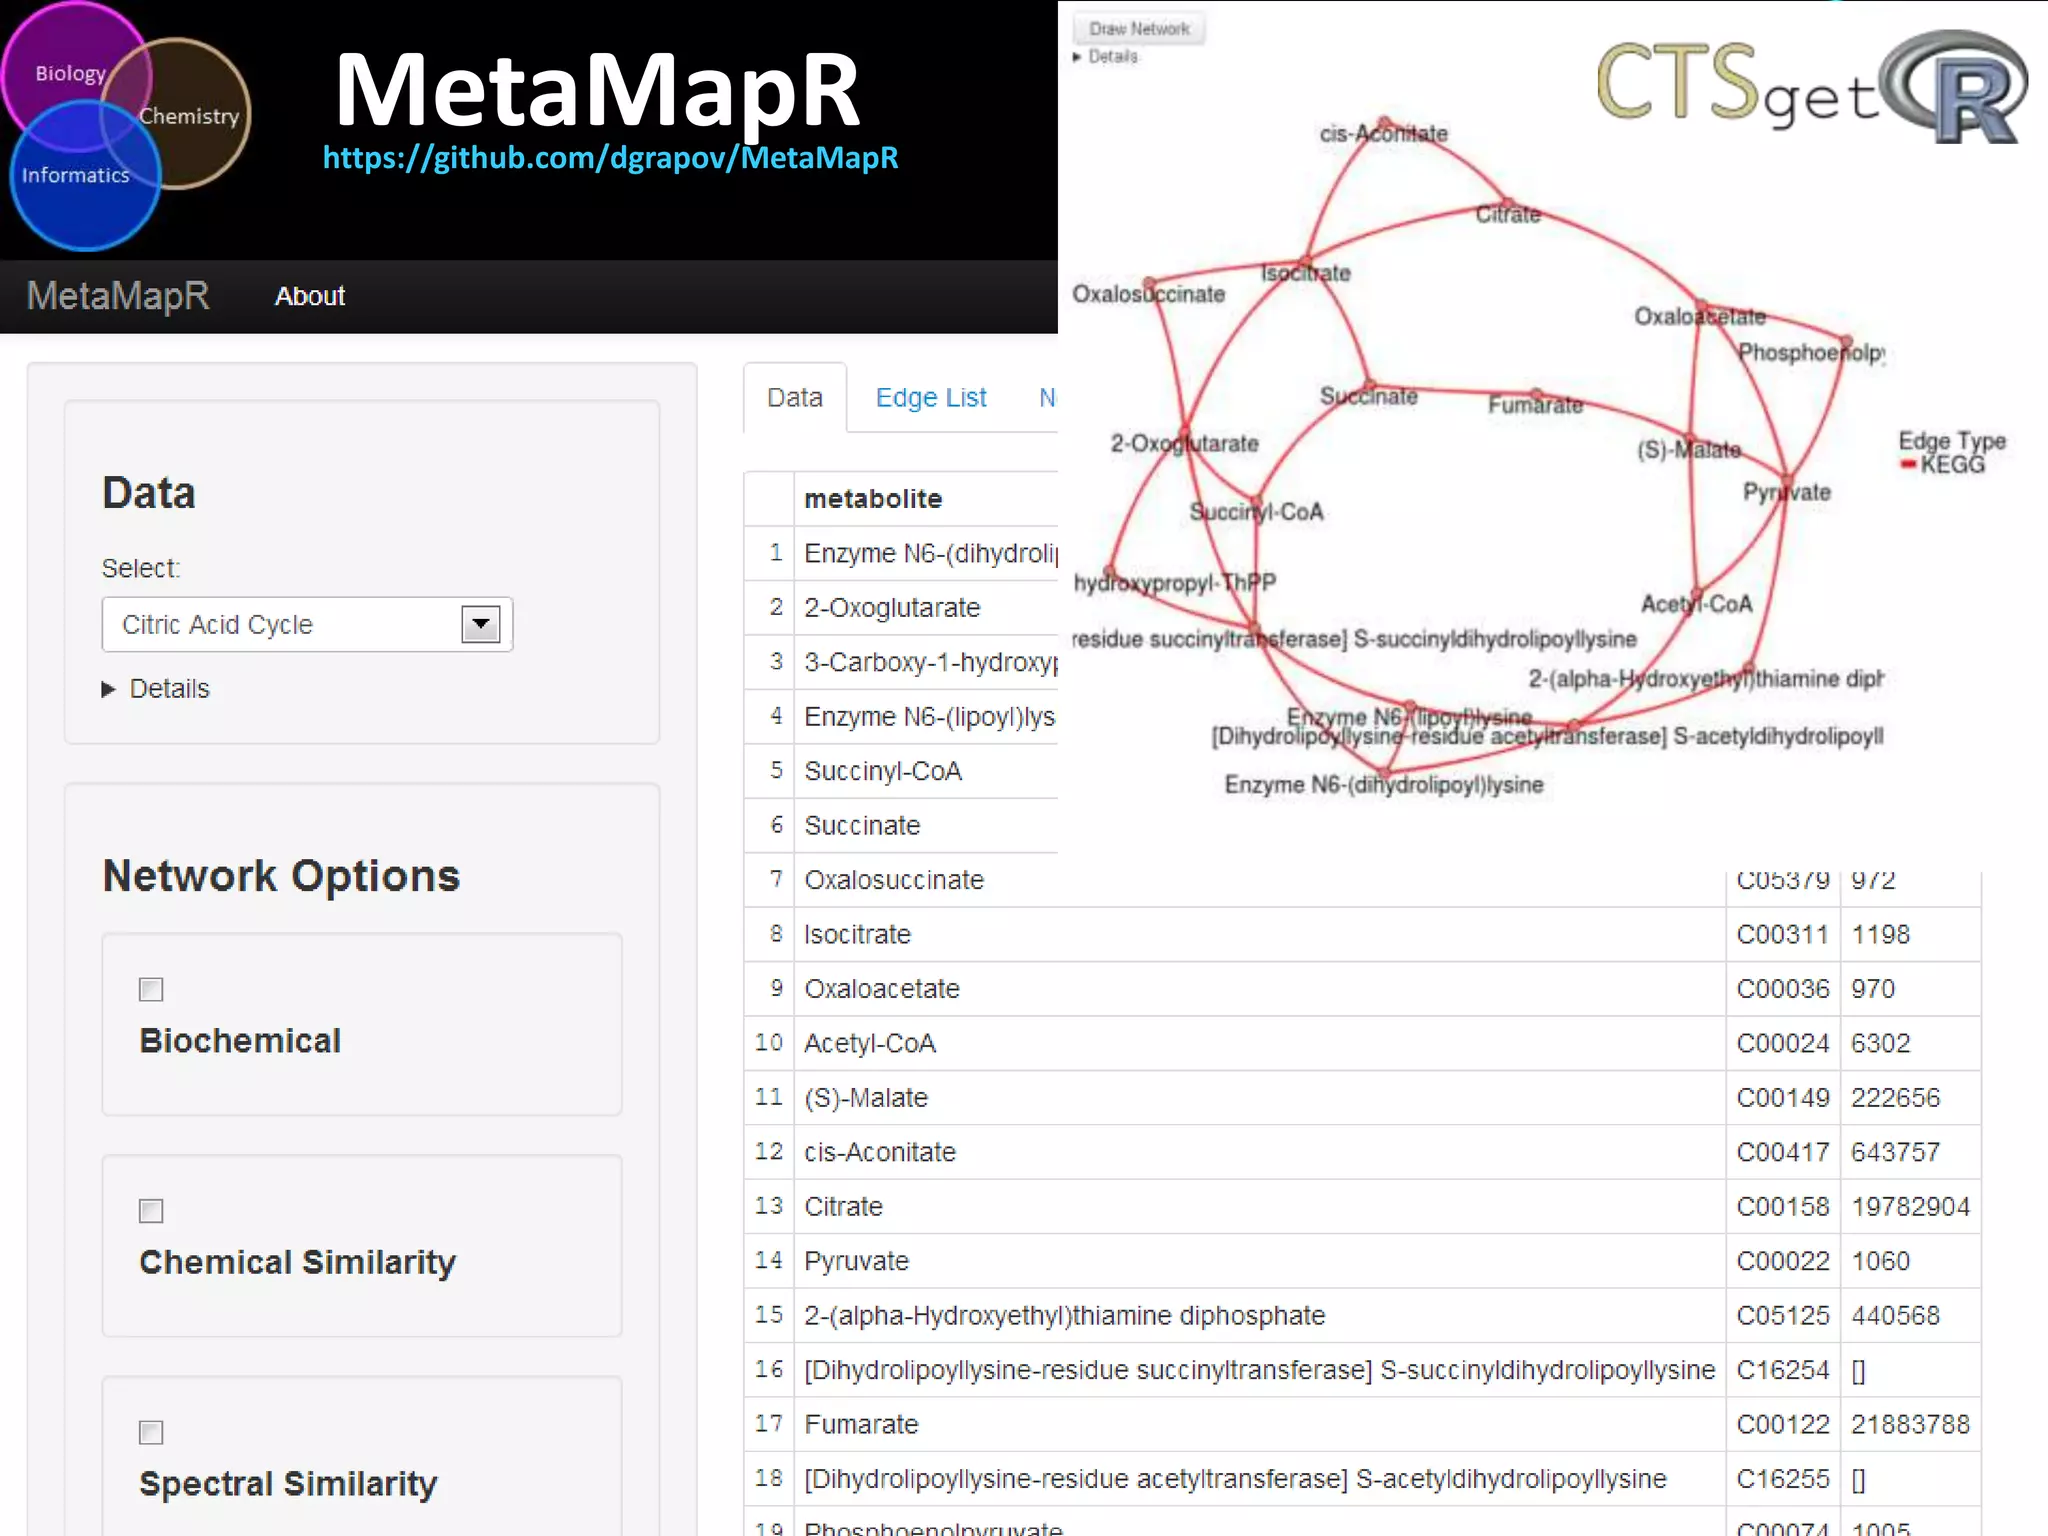
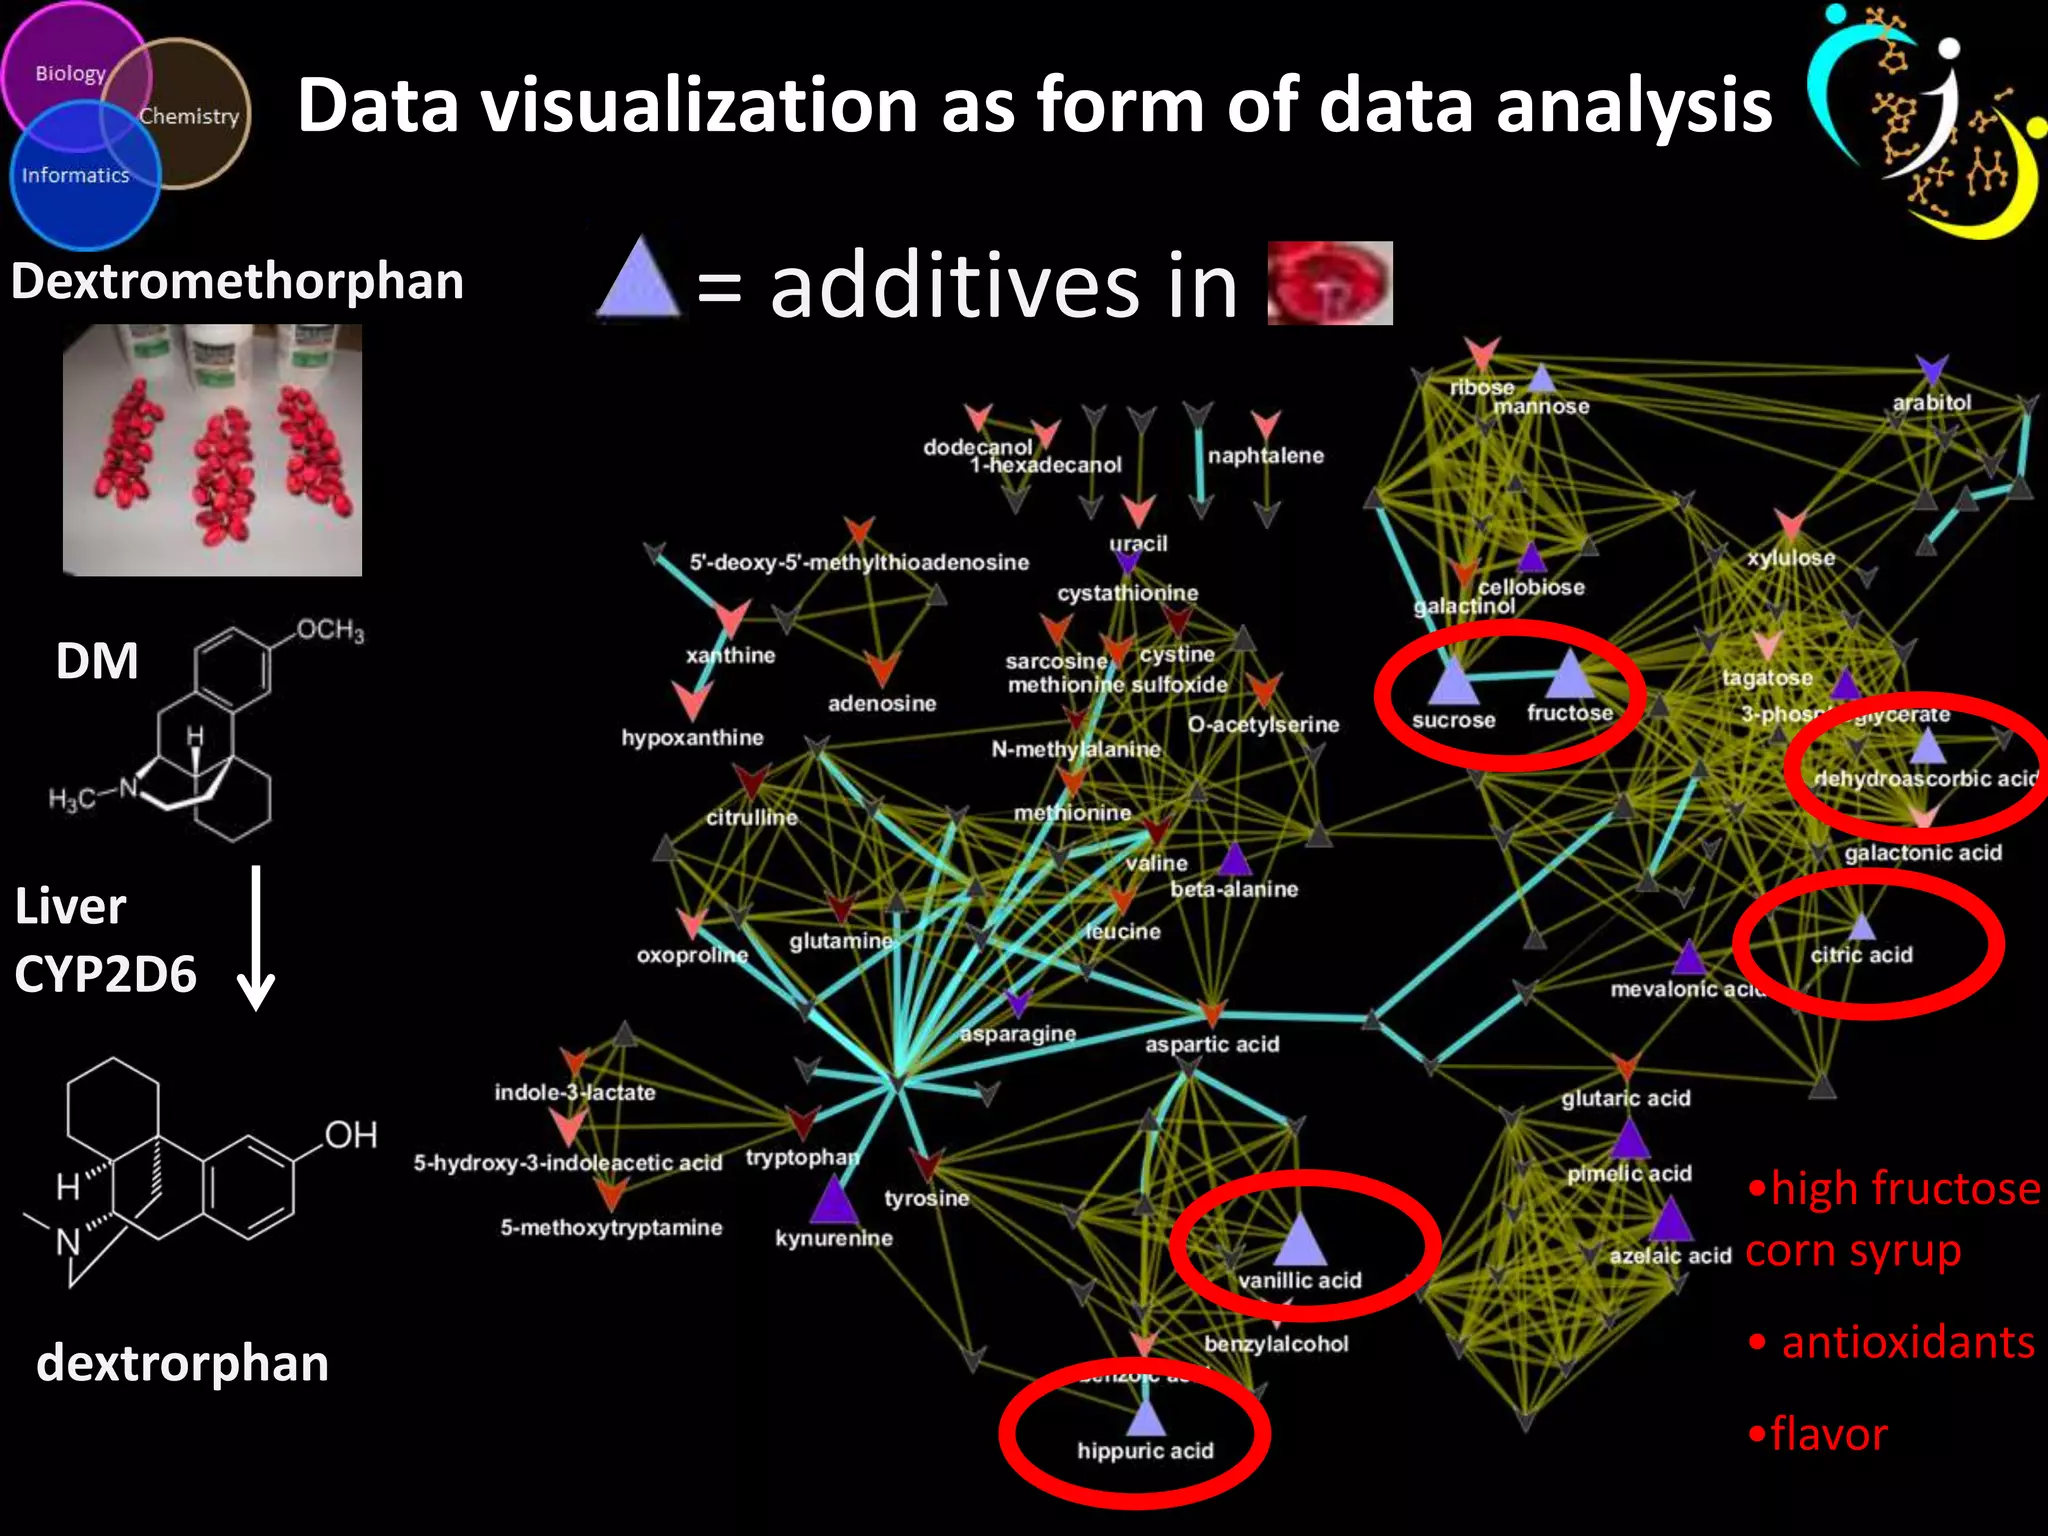
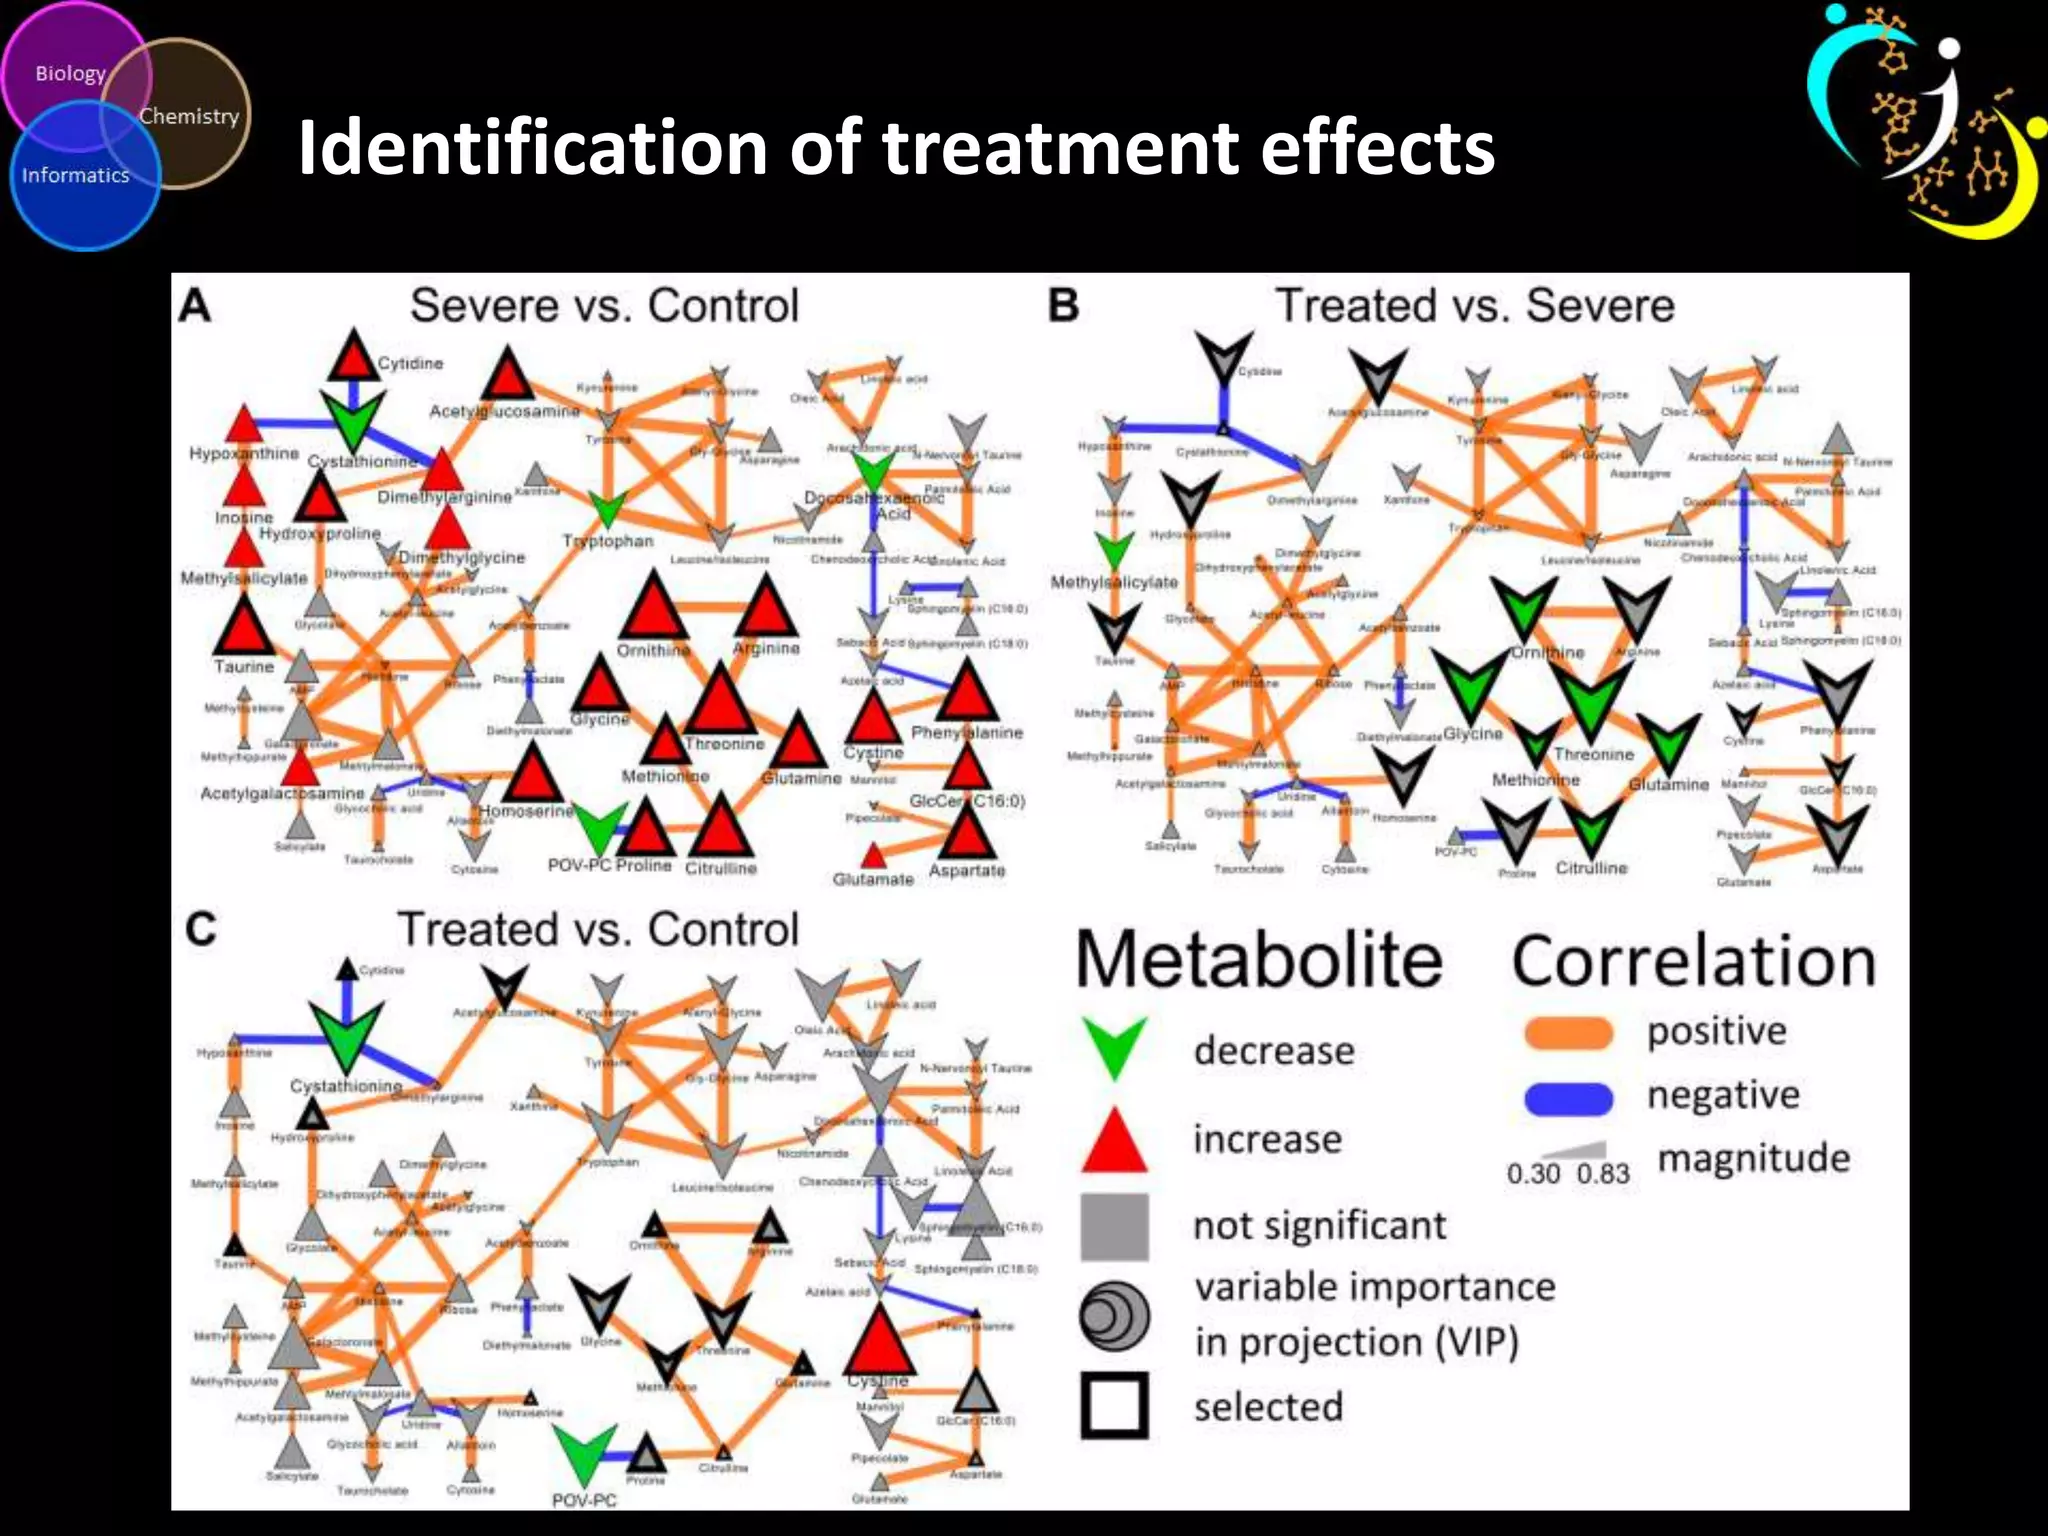
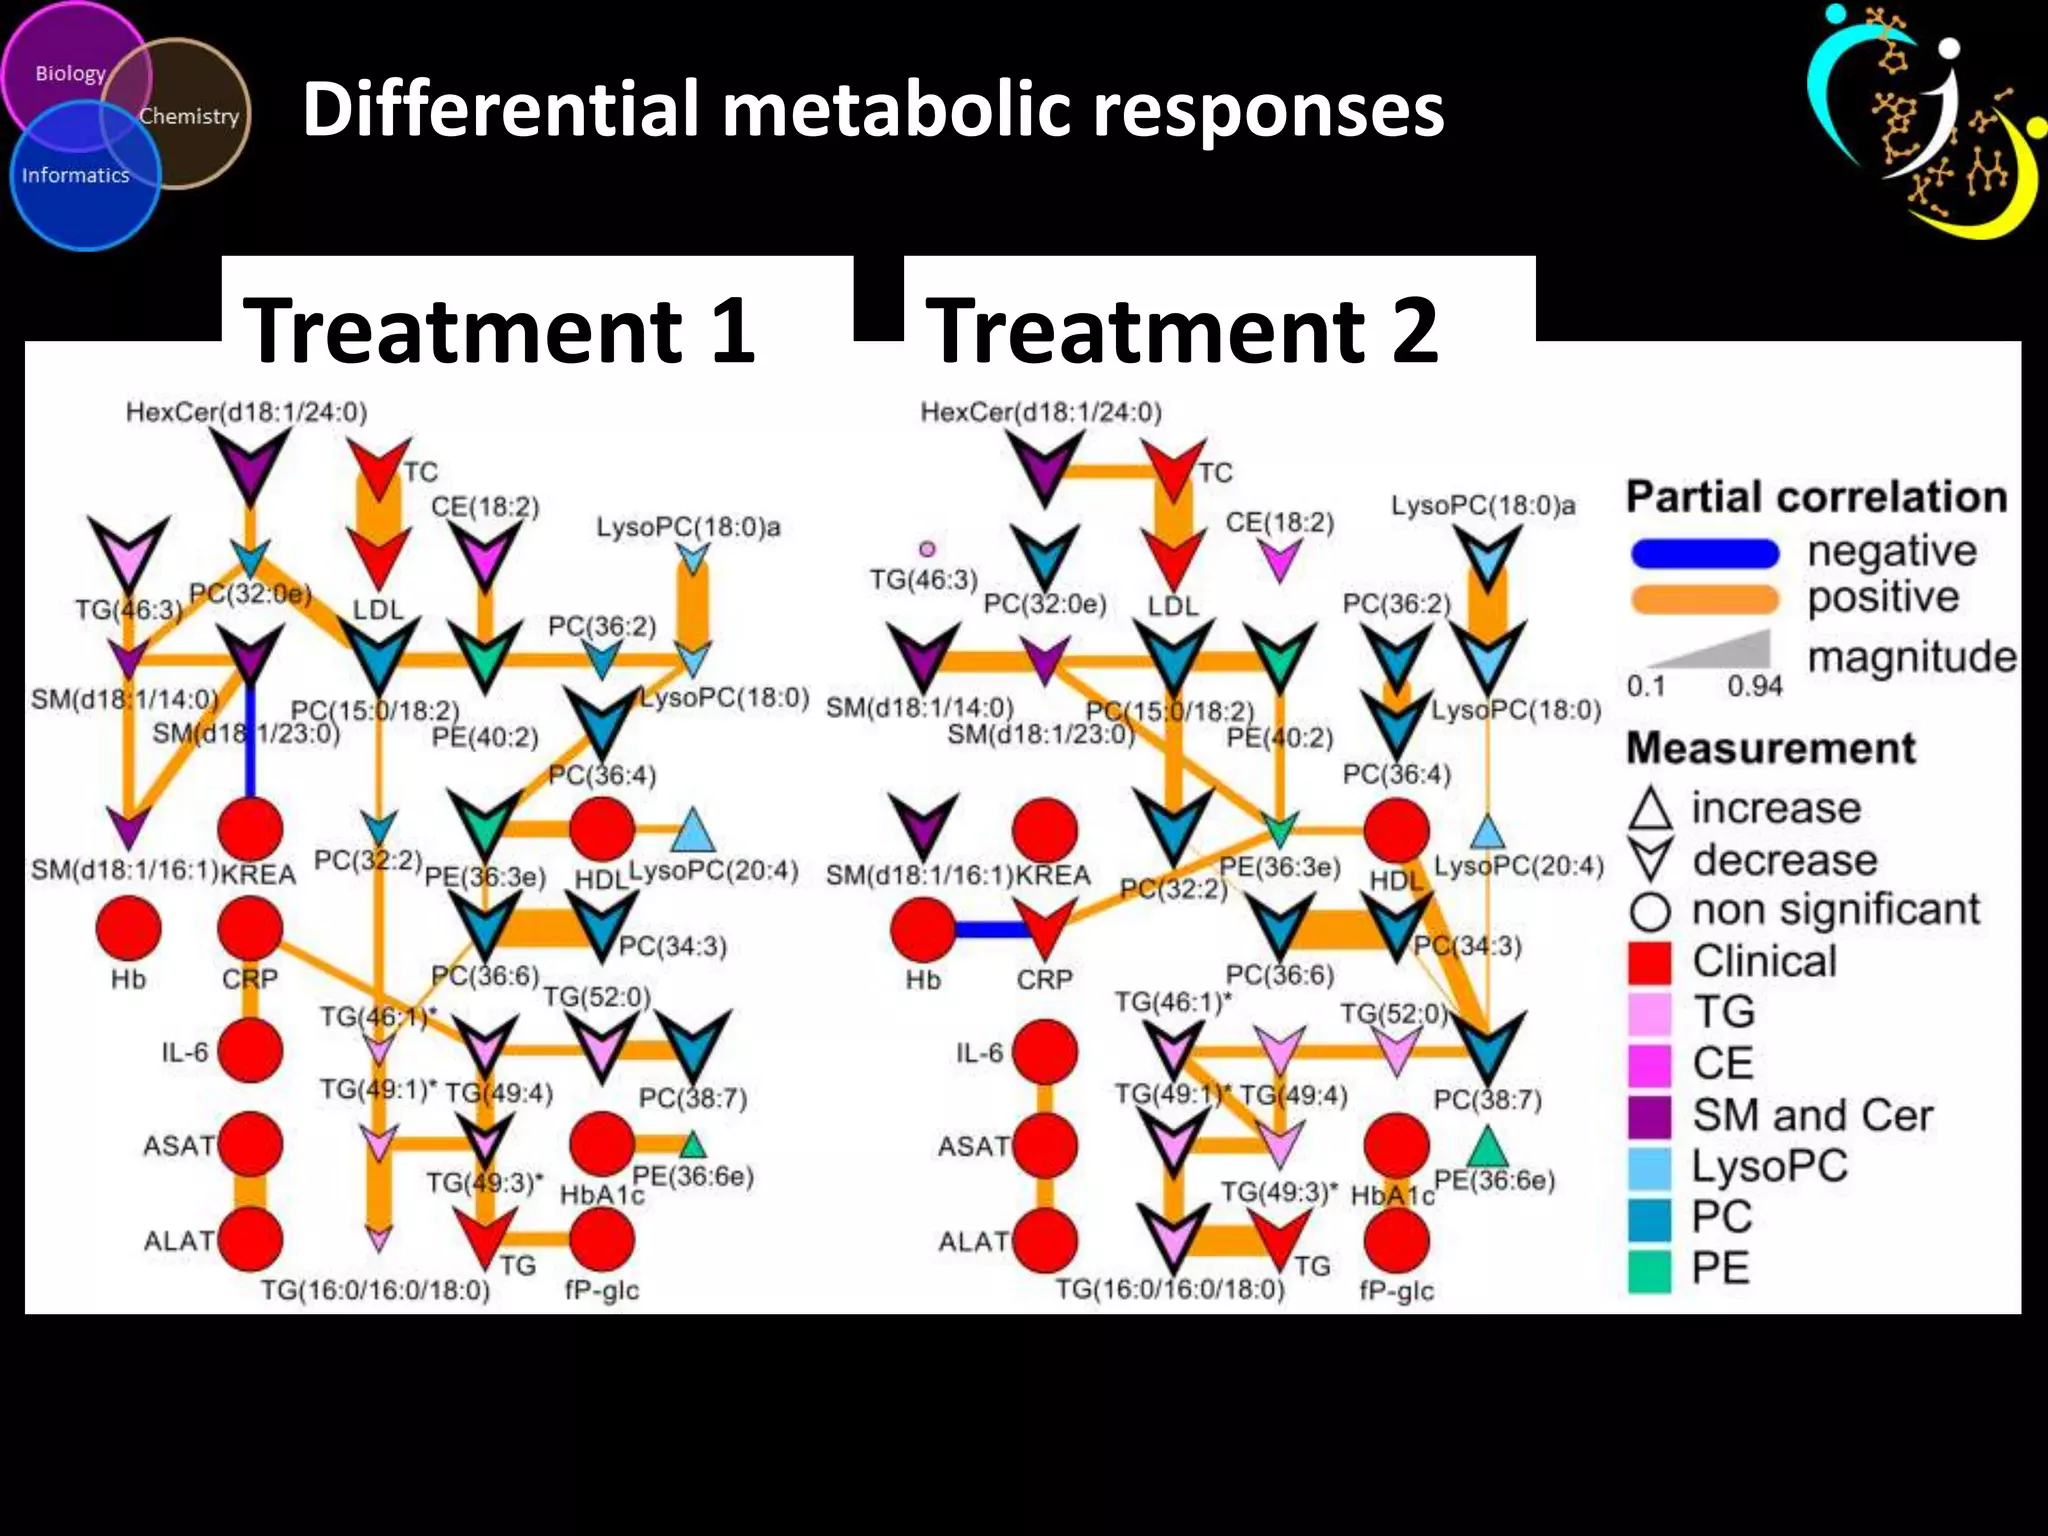
Analysis at the Metabolomic Scale
Dmitry Grapov, PhD
Tools for Metabolomic Data
Analysis and Visualization
1. Visualization (how does it look?)
• histograms, density plots, box plots, line plots, scatter plots, networks, etc.
2. Statistical Analysis (what is statistically significant?)
• summary tables, ANOVA, FDR adjustment, power analysis, etc.
3. Exploration (what are the major patterns/trends?)
• clustering, PCA, ICA, etc.
4. Predictive Modeling (what explains my hypothesis?)
• mixed effects, partial least squares (O-/PLS/-DA), etc.
5. Network Analysis (how are things related?)
• Pathway Enrichment
• Biochemical, mass spectral, empirical, etc.
6. Network Mapping
Common Data Analysis Tasks
Featured Tools
Data Analysis and Visualization
•DeviumWeb- Dynamic multivariate data analysis and
visualization platform
url: https://github.com/dgrapov/DeviumWeb
•imDEV- Microsoft Excel add-in for multivariate analysis
url: http://sourceforge.net/projects/imdev/
Network Analysis
•MetaMapR- Network analysis tools for metabolomics
url: https://github.com/dgrapov/MetaMapR
Network Mapping
• MetaMapR + DeviumWeb + Cytoscape
DeviumWeb
https://github.com/dgrapov/DeviumWeb
Network Mapping
Visualization and analysis of statistical and multivariate results within a biochemical
and/or empirical context.
Conduct Data
Analysis
Generate
Network
Map Results to
Network
Grapov D., Fiehn O., Multivariate and network tools for analysis and visualization of metabolomic data, ASMS, June 08, 2013, Minneapolis, MN
Network Generation
Biochemical
• enzymatic transformations
Structural Similarity
• structural fingerprints
• mass spectra
Empirical (dependency)
•correlation
•partial-correlation
BMC Bioinformatics 2012, 13:99 doi:10.1186/1471-2105-13-99
Metabolic
Perturbations in
Tumorigenesis
Biochemical and
chemical similarity
network comparing
changes in metabolites
between tumor and
control tissue
Mappings:
• direction of change
• statistical significance
• multivariate importance
• molecular biochemical
domain
Biochemical
Relationships
http://www.genome.jp/dbget-bin/www_bget?rn:R00975
Structural
Similarity
http://pubchem.ncbi.nlm.nih.gov//score_matrix/score_matrix.cgi
Empirical Networks
Experiment specific data driven relationships can offer novel insight into
biochemical perturbations urea cycle
nucleotide
synthesis
protein
glycosylation
Mass Spectral Networks
Use mass spectra as a proxy for structure to help make sense of
unknown compounds’ biochemical identities.
Mix and match different
relationships to help narrow
down structures of unknowns
Partial derivatization
products of glucose
MetaMapRhttps://github.com/dgrapov/MetaMapR
Data visualization as form of data analysis
DM
Liver
CYP2D6
Dextromethorphan = additives in
dextrorphan
•high fructose
corn syrup
• antioxidants
•flavor
Identification of treatment effects
Differential metabolic responses
Treatment 1 Treatment 2
Other Resources
•TeachingDemos- Tutorials and Demonstrations in R
•url: http://sourceforge.net/projects/teachingdemos/?source=directory
•url: https://github.com/dgrapov/TeachingDemos
•CDS Blog- Data analysis Case Studies and Tutorials
url: http://imdevsoftware.wordpress.com/
dgrapov@ucdavis.edu
metabolomics.ucdavis.edu
This research was supported in part by NIH 1 U24 DK097154

Metabolomic data analysis and visualization tools