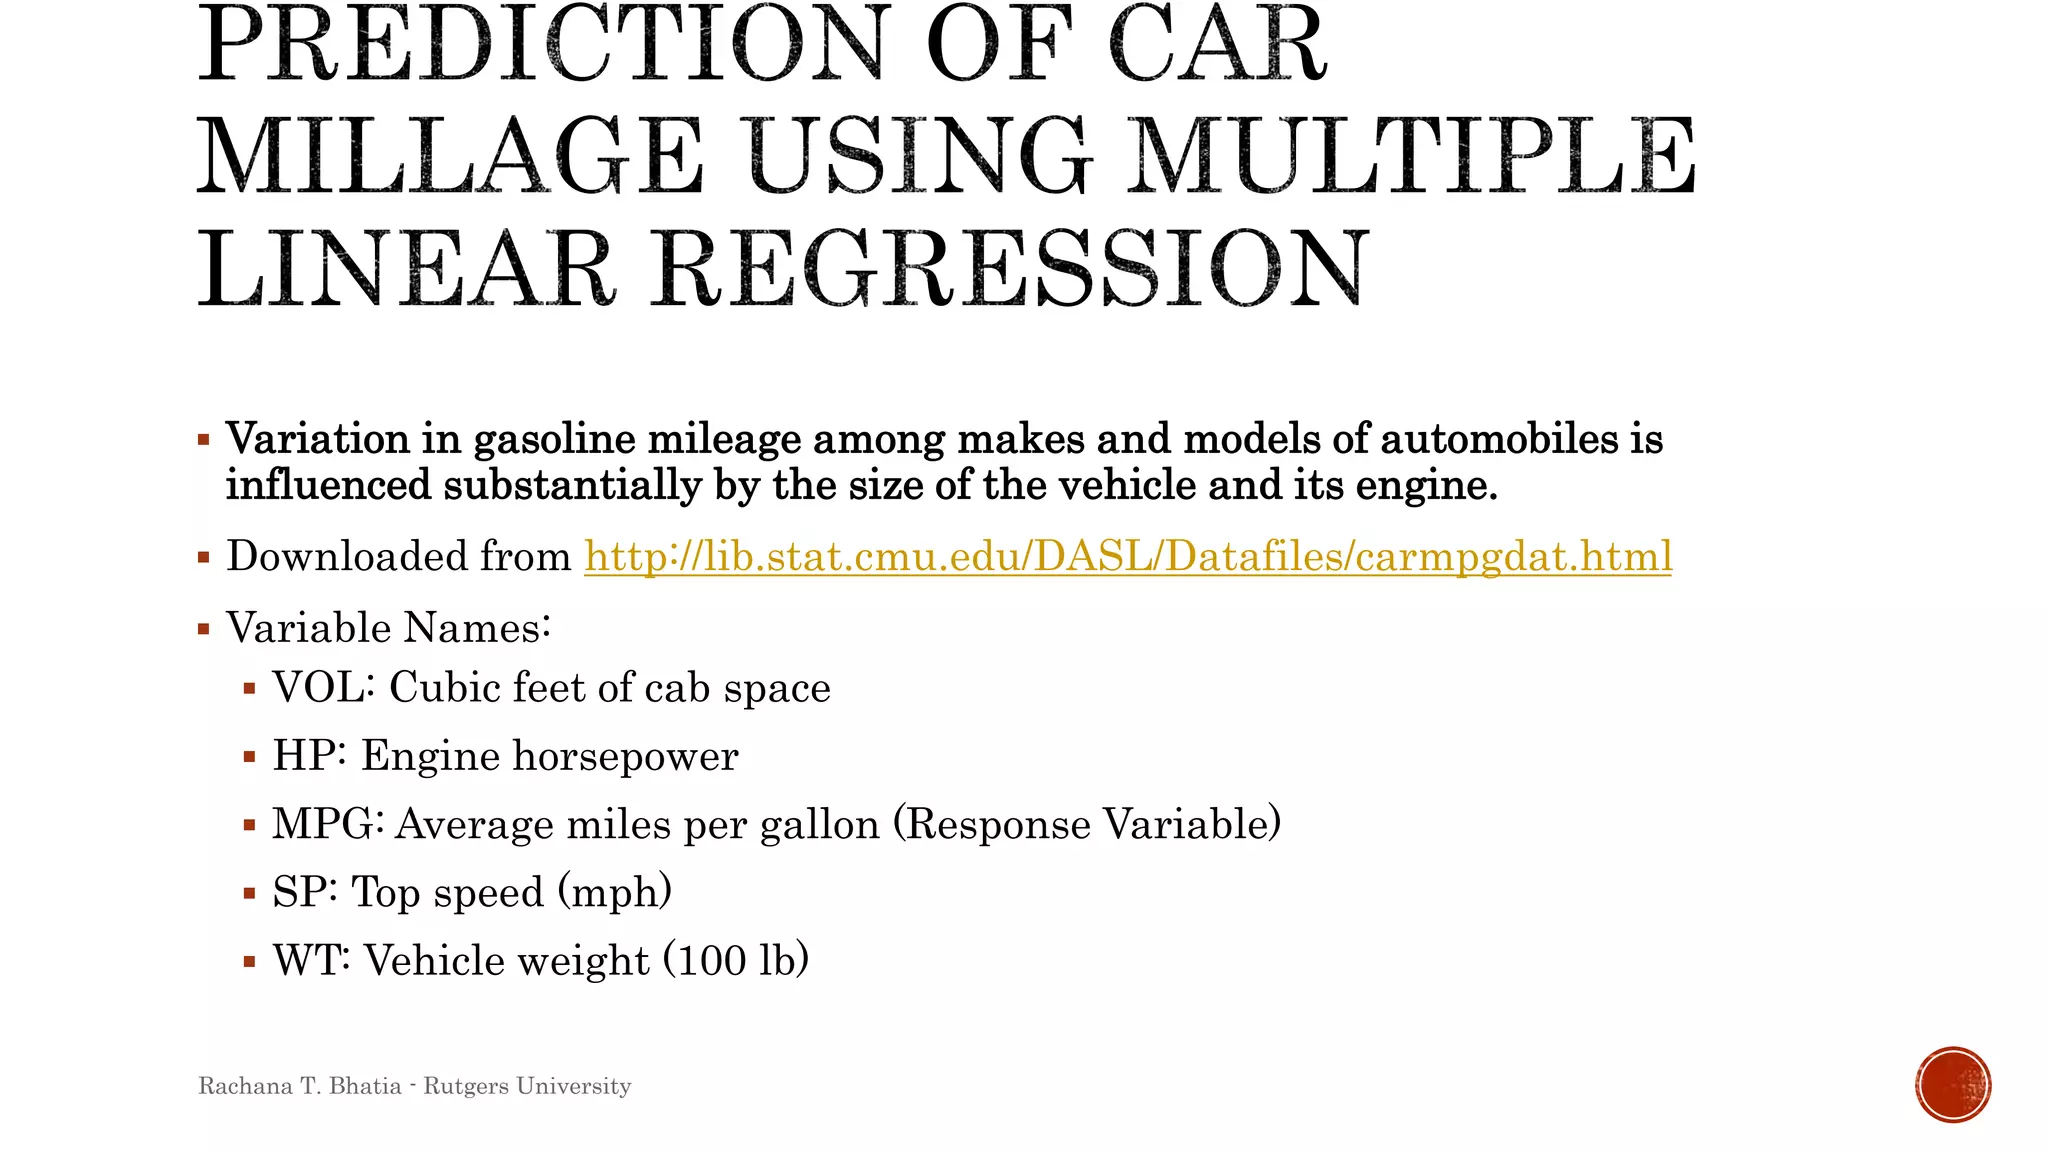
Multiple regression in R on Automobile data to predict
Gasoline Mileage
Rachana T. Bhatia - Rutgers University
ļ‚§ Basics of Regression Analysis
ļ‚§ Addressing Model Deviation of regression models
ļ‚§ Model selection criterion
ļ‚§ Types of regression Model
ļ‚§ Introduction to R
ļ‚§ Multiple regression (including polynomial regression) on Car Data
Rachana T. Bhatia - Rutgers University
ļ‚§ First step to learn predictive modelling
ļ‚§ Statistical technique for investigating and modeling the relationship between
variables
ļ‚§ Equation of straight line š’š = šœ· šŸŽ + šœ· šŸ š’™ + šœŗ
ļ‚§ šœŗ is a random variable that accounts for the failure of the model to fit the data
ļ‚§ š’™ explanatory variable & š‘¦ response variable
ļ‚§ Regression does not necessarily imply causality
Rachana T. Bhatia - Rutgers University
Linear Regression Analysis 5th edition Montgomery, Peck & ViningRachana T. Bhatia - Rutgers University
ļ‚§ Least squares estimation- minimize the sum of squares of the
differences between the observed response, yi, and the straight line
ļ‚§ Fitted values & Residuals
ļ‚§ Hypothesis Testing for the value of slope and intercept - T-tests
ļ‚§ Significant relation between the variables- reject Null Hypothesis
ļ‚§ Alternative approach : p-value
ļ‚§ Confidence Interval – associated with randomness of the data
ļ‚§ Prediction Interval – associated with the random variable yet to be
observed.
Rachana T. Bhatia - Rutgers University
ļ‚§ Linearity
ļ‚§ Homoscedasticity
ļ‚§ Errors normally distributed (for inferential purposes)
ļ‚§ Independent
ļ‚§ Constant variance
ļ‚§ There is a probability distribution for y at each value of x
with mean: E š‘Œ š‘„ = β0 + β1 š‘„
Variance: Var š‘Œ š‘„ = σ2
Rachana T. Bhatia - Rutgers University
ļ‚§ Looking at the scatter plot
ļ‚§ Q-Q plot – Quantiles of the residuals vs normal distribution
ļ‚§ Residual plot – Residuals Vs Explanatory variable
Rachana T. Bhatia - Rutgers University
ļ‚§ Correctable non-linearity (simple and monotone )
ļ‚§ Non-Correctable linearity
Rachana T. Bhatia - Rutgers University
ļ‚§ Define a new variable u as š‘¢ = š‘’ š‘„
Rachana T. Bhatia - Rutgers University
Some common transformations are:
v = ln(y)
v = p √y where p > 1 v = 1/y p where p > 0
Rachana T. Bhatia - Rutgers University
ļ‚§ How well a statistical model fits observed data
ļ‚§ How much of the total variation in Y is described by the variation in the
explanatory variables
ļ‚§ square of the sample correlation of the response variable and the explanatory
variable
ļ‚§ Lies between -āˆž to 1
ļ‚§ Adjusted R-squared- adjusted for the number of coefficients in the model relative
to the sample size in order to correct it for bias
Rachana T. Bhatia - Rutgers University
ļ‚§ Mean Square Error
ļ‚§ Coefficient of Determination - R2
ļ‚§ Adjusted R2
ļ‚§ AIC (Akaike’s Information Criterion) - smaller values are better
ļ‚§ BIC (Bayesian Information Criterion) - smaller values are better
Rachana T. Bhatia - Rutgers University
ļ‚§ LEVERAGE – ā€˜standardized’ measure the distance of the ith observation abscissa from
the mean of the explanatory variables
ļ‚§ DFBETAS - standardized measures how much estimation of βj is influenced by the ith
observation.
ļ‚§ DFFITS - standardized measures how much estimation of ith fitted value is influenced
by the ith observation
ļ‚§ COOK’S Distance -standardized measure of the distance between the fitted values
obtained using the whole sample and the fitted values obtained after removing the jth
observation
Rachana T. Bhatia - Rutgers University
ļ‚§ Simple linear Model
ļ‚§ Polynomial regression – relationship is not linear
ļ‚§ Multiple linear Model – more than one explanatory variables- Categorical Data
ļ‚§ Robust regression (Least Absolute Deviations, Huber/ Bisquare function) - Data
contaminated with outliers
ļ‚§ Logistic regression – Response variable Binary (Logit and Probit link function)
ļ‚§ Ridge Regression – High multicollinearity
ļ‚§ Step wise regression – High dimensions (Forward selection/ backward elimination)
Rachana T. Bhatia - Rutgers University
ļ‚§ A power tool for statistics and data modeling
ļ‚§ R is free
ļ‚§ R is a language
ļ‚§ Graphics and data visualization
ļ‚§ A flexible statistical analysis toolkit
ļ‚§ R Studio - an Integrated Development Environment (IDE) for the R programming
language.
Rachana T. Bhatia - Rutgers University
ļ‚§ Setting the working directory
ļ‚§ Installing packages, updating and loading the packages
ļ‚§ Importing and Converting Data
ļ‚§ Creating vectors, data frames
ļ‚§ Connection to the outside world(file, gzfile,bzfile, url)
ļ‚§ Atomic classes of vectors : integer • numeric • character • complex • logical
Rachana T. Bhatia - Rutgers University
ļ‚§ Data Frames (tabular data)-stores different class of
objects{read.table/read.csv/data.frame)
ļ‚§ Analogous code for writing the data
ļ‚§ Foreign package (read.xport, read.spss )
ļ‚§ Reading larger data sets (Specifying the column classes)
ļ‚§ Inspect objects/dataframes
ļ‚§ Missing Values (Na / NaN)
Rachana T. Bhatia - Rutgers University
ļ‚§ Exploratory Analysis
ļ‚§ Subsetting (using [], [[]],$ )
ļ‚§ which.max/ which.min
ļ‚§ Handling missing values (complete.cases(), is.na…, na.rm = T)
ļ‚§ Splitting
ļ‚§ Apply , sapply, tapply, mapply
ļ‚§ Descriptive Analysis
ļ‚§ Summary()
ļ‚§ Str()
ļ‚§ Sd(), var(), median() , quantile(), hist()
ļ‚§ By(), table()
ļ‚§ Statistical test- t test , chi square test
Rachana T. Bhatia - Rutgers University
ļ‚§ Variation in gasoline mileage among makes and models of automobiles is
influenced substantially by the size of the vehicle and its engine.
ļ‚§ Downloaded from http://lib.stat.cmu.edu/DASL/Datafiles/carmpgdat.html
ļ‚§ Variable Names:
ļ‚§ VOL: Cubic feet of cab space
ļ‚§ HP: Engine horsepower
ļ‚§ MPG: Average miles per gallon (Response Variable)
ļ‚§ SP: Top speed (mph)
ļ‚§ WT: Vehicle weight (100 lb)
Rachana T. Bhatia - Rutgers University
ļ‚§ Prof. Andrew Magyar - Stat 563 - Introduction to Linear Regression_Course
Material
ļ‚§ Linear Regression Analysis 5th edition Montgomery, Peck & Vining
ļ‚§ http://www.ats.ucla.edu/stat/stata/dae/rreg.htm
ļ‚§ https://www.coursera.org/learn/r-programming/home/welcome
Rachana T. Bhatia - Rutgers University

Introduction to Regression Analysis and R

  • 1.
    Multiple regression inR on Automobile data to predict Gasoline Mileage Rachana T. Bhatia - Rutgers University
  • 2.
    ļ‚§ Basics ofRegression Analysis ļ‚§ Addressing Model Deviation of regression models ļ‚§ Model selection criterion ļ‚§ Types of regression Model ļ‚§ Introduction to R ļ‚§ Multiple regression (including polynomial regression) on Car Data Rachana T. Bhatia - Rutgers University
  • 3.
    ļ‚§ First stepto learn predictive modelling ļ‚§ Statistical technique for investigating and modeling the relationship between variables ļ‚§ Equation of straight line š’š = šœ· šŸŽ + šœ· šŸ š’™ + šœŗ ļ‚§ šœŗ is a random variable that accounts for the failure of the model to fit the data ļ‚§ š’™ explanatory variable & š‘¦ response variable ļ‚§ Regression does not necessarily imply causality Rachana T. Bhatia - Rutgers University
  • 4.
    Linear Regression Analysis5th edition Montgomery, Peck & ViningRachana T. Bhatia - Rutgers University
  • 5.
    ļ‚§ Least squaresestimation- minimize the sum of squares of the differences between the observed response, yi, and the straight line ļ‚§ Fitted values & Residuals ļ‚§ Hypothesis Testing for the value of slope and intercept - T-tests ļ‚§ Significant relation between the variables- reject Null Hypothesis ļ‚§ Alternative approach : p-value ļ‚§ Confidence Interval – associated with randomness of the data ļ‚§ Prediction Interval – associated with the random variable yet to be observed. Rachana T. Bhatia - Rutgers University
  • 6.
    ļ‚§ Linearity ļ‚§ Homoscedasticity ļ‚§Errors normally distributed (for inferential purposes) ļ‚§ Independent ļ‚§ Constant variance ļ‚§ There is a probability distribution for y at each value of x with mean: E š‘Œ š‘„ = β0 + β1 š‘„ Variance: Var š‘Œ š‘„ = σ2 Rachana T. Bhatia - Rutgers University
  • 7.
    ļ‚§ Looking atthe scatter plot ļ‚§ Q-Q plot – Quantiles of the residuals vs normal distribution ļ‚§ Residual plot – Residuals Vs Explanatory variable Rachana T. Bhatia - Rutgers University
  • 8.
    ļ‚§ Correctable non-linearity(simple and monotone ) ļ‚§ Non-Correctable linearity Rachana T. Bhatia - Rutgers University
  • 9.
    ļ‚§ Define anew variable u as š‘¢ = š‘’ š‘„ Rachana T. Bhatia - Rutgers University
  • 10.
    Some common transformationsare: v = ln(y) v = p √y where p > 1 v = 1/y p where p > 0 Rachana T. Bhatia - Rutgers University
  • 11.
    ļ‚§ How wella statistical model fits observed data ļ‚§ How much of the total variation in Y is described by the variation in the explanatory variables ļ‚§ square of the sample correlation of the response variable and the explanatory variable ļ‚§ Lies between -āˆž to 1 ļ‚§ Adjusted R-squared- adjusted for the number of coefficients in the model relative to the sample size in order to correct it for bias Rachana T. Bhatia - Rutgers University
  • 12.
    ļ‚§ Mean SquareError ļ‚§ Coefficient of Determination - R2 ļ‚§ Adjusted R2 ļ‚§ AIC (Akaike’s Information Criterion) - smaller values are better ļ‚§ BIC (Bayesian Information Criterion) - smaller values are better Rachana T. Bhatia - Rutgers University
  • 13.
    ļ‚§ LEVERAGE ā€“ā€˜standardized’ measure the distance of the ith observation abscissa from the mean of the explanatory variables ļ‚§ DFBETAS - standardized measures how much estimation of βj is influenced by the ith observation. ļ‚§ DFFITS - standardized measures how much estimation of ith fitted value is influenced by the ith observation ļ‚§ COOK’S Distance -standardized measure of the distance between the fitted values obtained using the whole sample and the fitted values obtained after removing the jth observation Rachana T. Bhatia - Rutgers University
  • 14.
    ļ‚§ Simple linearModel ļ‚§ Polynomial regression – relationship is not linear ļ‚§ Multiple linear Model – more than one explanatory variables- Categorical Data ļ‚§ Robust regression (Least Absolute Deviations, Huber/ Bisquare function) - Data contaminated with outliers ļ‚§ Logistic regression – Response variable Binary (Logit and Probit link function) ļ‚§ Ridge Regression – High multicollinearity ļ‚§ Step wise regression – High dimensions (Forward selection/ backward elimination) Rachana T. Bhatia - Rutgers University
  • 15.
    ļ‚§ A powertool for statistics and data modeling ļ‚§ R is free ļ‚§ R is a language ļ‚§ Graphics and data visualization ļ‚§ A flexible statistical analysis toolkit ļ‚§ R Studio - an Integrated Development Environment (IDE) for the R programming language. Rachana T. Bhatia - Rutgers University
  • 16.
    ļ‚§ Setting theworking directory ļ‚§ Installing packages, updating and loading the packages ļ‚§ Importing and Converting Data ļ‚§ Creating vectors, data frames ļ‚§ Connection to the outside world(file, gzfile,bzfile, url) ļ‚§ Atomic classes of vectors : integer • numeric • character • complex • logical Rachana T. Bhatia - Rutgers University
  • 17.
    ļ‚§ Data Frames(tabular data)-stores different class of objects{read.table/read.csv/data.frame) ļ‚§ Analogous code for writing the data ļ‚§ Foreign package (read.xport, read.spss ) ļ‚§ Reading larger data sets (Specifying the column classes) ļ‚§ Inspect objects/dataframes ļ‚§ Missing Values (Na / NaN) Rachana T. Bhatia - Rutgers University
  • 18.
    ļ‚§ Exploratory Analysis ļ‚§Subsetting (using [], [[]],$ ) ļ‚§ which.max/ which.min ļ‚§ Handling missing values (complete.cases(), is.na…, na.rm = T) ļ‚§ Splitting ļ‚§ Apply , sapply, tapply, mapply ļ‚§ Descriptive Analysis ļ‚§ Summary() ļ‚§ Str() ļ‚§ Sd(), var(), median() , quantile(), hist() ļ‚§ By(), table() ļ‚§ Statistical test- t test , chi square test Rachana T. Bhatia - Rutgers University
  • 19.
    ļ‚§ Variation ingasoline mileage among makes and models of automobiles is influenced substantially by the size of the vehicle and its engine. ļ‚§ Downloaded from http://lib.stat.cmu.edu/DASL/Datafiles/carmpgdat.html ļ‚§ Variable Names: ļ‚§ VOL: Cubic feet of cab space ļ‚§ HP: Engine horsepower ļ‚§ MPG: Average miles per gallon (Response Variable) ļ‚§ SP: Top speed (mph) ļ‚§ WT: Vehicle weight (100 lb) Rachana T. Bhatia - Rutgers University
  • 20.
    ļ‚§ Prof. AndrewMagyar - Stat 563 - Introduction to Linear Regression_Course Material ļ‚§ Linear Regression Analysis 5th edition Montgomery, Peck & Vining ļ‚§ http://www.ats.ucla.edu/stat/stata/dae/rreg.htm ļ‚§ https://www.coursera.org/learn/r-programming/home/welcome Rachana T. Bhatia - Rutgers University