Downloaded 235 times
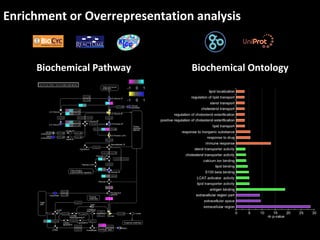
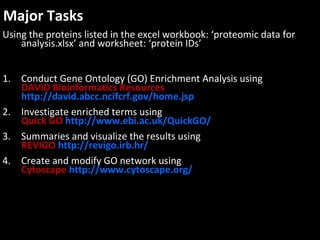
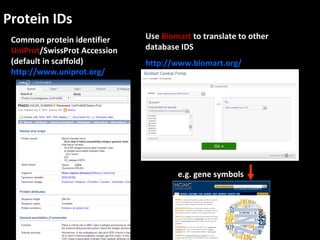
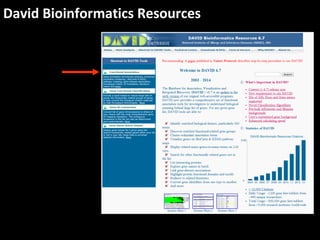
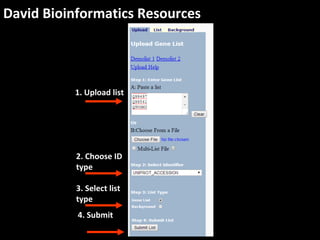
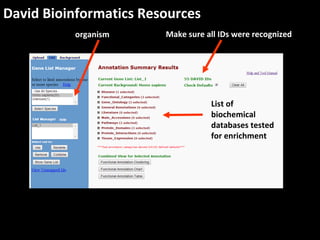
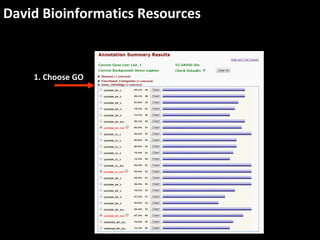
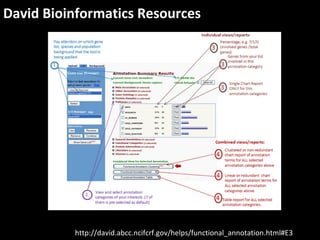
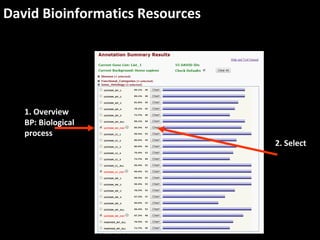
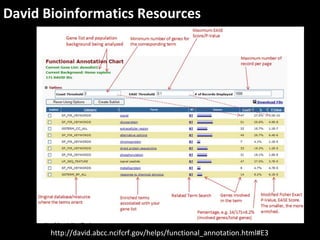
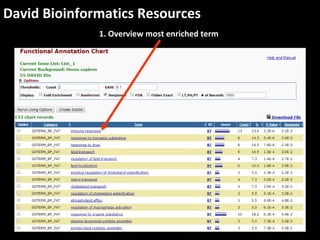
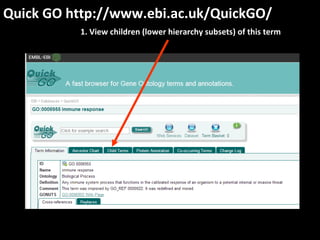
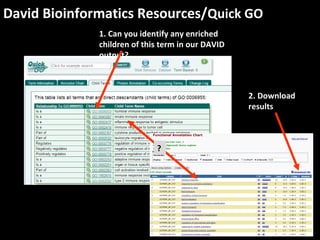
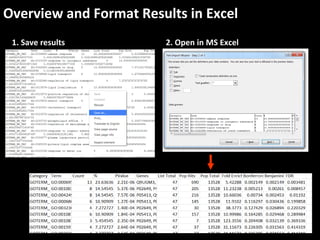
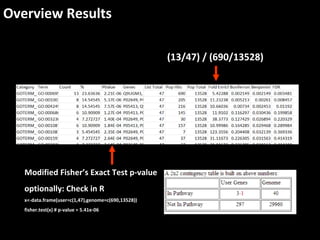
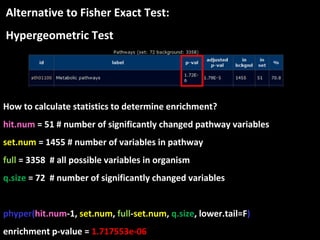
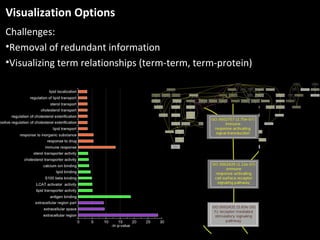
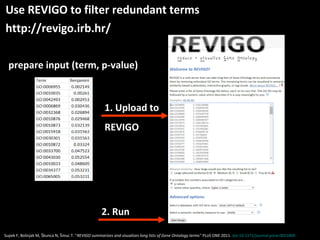
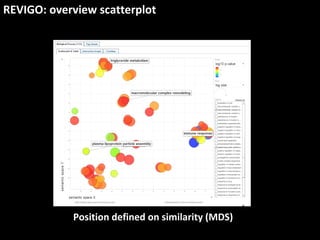
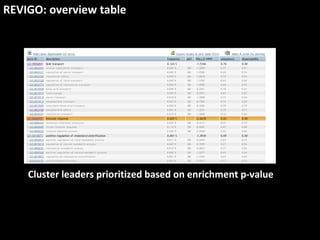
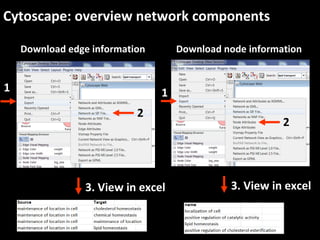
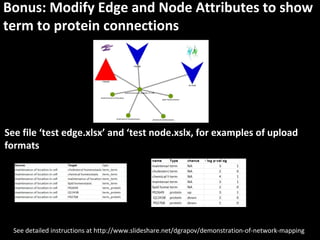

This document outlines a tutorial for conducting gene ontology network enrichment analysis using various bioinformatics resources, primarily focusing on the DAVID platform. Key tasks include conducting enrichment analysis, visualizing results with Revigo, and creating networks using Cytoscape. The tutorial also provides details on input requirements, statistical tests for enrichment, and links to relevant databases and tools.


![Polymer [ बहुलक ] Chemistry Notes PDF - Irfanullah Mehar - JJ Sir Chemistry.pdf](https://cdn.slidesharecdn.com/ss_thumbnails/polymerchemistrynotespdf-irfanullahmehar-jjsirchemistry-260210172118-3f9b37f7-thumbnail.jpg?width=640&height=640&fit=bounds)


