American Society of Mass Spectrommetry Conference 2014
•Download as PPTX, PDF•
2 likes•1,321 views

see higher resolution image: https://imdevsoftware.files.wordpress.com/2014/06/asms-2014-j-fahrman.png

Recommended
More Related Content
What's hot
What's hot (20)
Viewers also liked
Viewers also liked (13)
Similar to American Society of Mass Spectrommetry Conference 2014
Similar to American Society of Mass Spectrommetry Conference 2014 (20)
More from Dmitry Grapov
More from Dmitry Grapov (20)
Recently uploaded
Recently uploaded (20)
American Society of Mass Spectrommetry Conference 2014
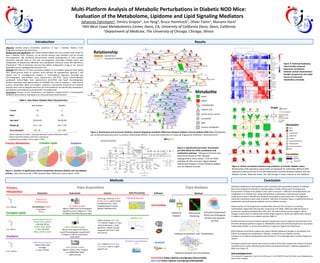
- 1. Unbiased metabolomics and lipidomics were combined with quantitative analysis of oxidized fatty acids (oxylipins) to identify circulating markers of beta-cell loss and T1D progression. Incorporation of these three platforms was used to measure > 1000 (397 annotated) lipids and metabolites in n=70 NOD mice. Advanced statistical, multivariate, functional and network analyses were used to identify key metabolic perturbations associated with T1D progression. Univariate comparisons were used to identify ~500 (192, annotated; Figure 1) significantly altered metabolites and lipids between diabetic and non-diabetic animals. Global markers of T1D progression included 69%, 52% and 37% increase in circulating carbohydrate, triglyceride and aromatic compounds and 150%, 140% and 140% decreases in prostacyclin, lysophosphotidylcholine (LPC) and 20-carbon ketone species oxylpins. Many changes in lipids were correlated with animal weight (Figure 4), which was significantly reduced in diabetic compared to non-diabetic animals (Table 1). Biochemical and structural similarity network analysis was used to integrate measurements from the three analytical platforms (Figure 2). Metabolites were connected based precursor to product relationships (KEGG) or structural similarities in molecular fingerprints (PubChem). KEGG pathway enrichment analysis was used to identify significant changes in arachidonic acid (Figure 3) and galactose metabolism in diabetic compared to non-diabetic animals. increases in circulating carbohydrates and reduction in 1,5-anhydroglucitol, a marker of glycemic control Orthogonal partial least squares discriminant analysis (O-PLS-DA) coupled with analysis of partial correlations was used to identify key biomarkers associated with type 1 diabetes progression in NOD mice (Figure 5). Acknowledgements This research is supported in part by the NIH grant 1 U24 DK097154 and NIH West Coast Metabolomics Center Pilot Program. Multi-Platform Analysis of Metabolic Perturbations in Diabetic NOD Mice: Evaluation of the Metabolome, Lipidome and Lipid Signaling Mediators Johannes Fahrmann1, Dmitry Grapov1, Jun Yang1, Bruce Hammock1, Oliver Fiehn1, Manami Hara2 1NIHWest Coast Metabolomics Center, Davis, CA; University of California Davis, Davis, California 2Department of Medicine, The University of Chicago, Chicago, Illinois Objective Identify plasma biomarkers predictive of Type 1 Diabetes Mellitus (T1D) progression and beta-cell destruction. Background and Significance Non-obese diabetic (NOD) mice are a widely-used model for type 1 diabetes (T1D). However, not all animals develop overt diabetes, and are termed non-progressors. We previously demonstrated marked heterogeneity in total residual pancreatic beta-cell mass in T1D and non-progressor littermates (>8-wk), which was independent of lymphocyte infiltration and endoplasmic reticulum stress. We identified a threshold of ~70% of total beta-cell mass loss before, independent of age or sex, animals developed chronic hyperglycemia and overt T1D. Methods NOD Mice (n=71) were assessed as diabetic or non-diabetic based on their fasting (4hr) blood glucose levels at sacrifice, which defined 30 hyperglycemic (glucose ≥ 250 mg/dL) and 41 normoglycemic animals. A multi-platform approach including: gas chromatography time-of-flight mass spectrometry (GC-TOF), liquid chromatography quadropole time-of-flight mass spectrometry (LC-Q-TOF) and liquid chromatography tandem quadrople mass spectrometry (LC-MS/MS) was used to measure > 1000 plasma primary metabolites, lipids and oxylipins. Statistical, multivariate, functional and network analyses were used to integrate data from the three platforms and identify key metabolomic and lipidomic perturbations associated with T1D progression. Conclusions Analysis of the metabolome and lipidome revealed distinct T1D-dependent metabolic perturbations extending to all measured biochemical domains. Results Table 1. Non-Obese Diabetic Mice Characteristics Non-Diabetic Diabetic Female 18 6 Male 23 24 Age (wks)† 36 (26,40) 38 (26,40) Weight (g) 27.3 ± 4.8 19.5 ± 4.8‡ Glucose(mg/dL) 94 ± 34 513 ± 101‡ * values reported as mean ± standard deviation unless otherwise noted † values reported median (minimum, maximum) ‡ unpaired two-sample t-test p-value ≤ 0.05 Figure 2. Biochemical and structural similarity network displaying metabolic differences between diabetic and non-diabetic NOD mice. Metabolites are connected based precursor to product relationships (KEGG) or structural similarities in molecular fingerprints (PubChem, Tanimoto>0.07). Figure 3. Significantly perturbed eicosanoids (p<0.05) within the KEGG arachidonic acid metabolism pathway. Pathway enrichment was determined based on FDR adjusted hypergeometric test p-values < 0.05 for KEGG pathways for Mus musculus. Figure displays relative fold changes in means between diabetic and non-diabetic animals. Figure 5. Partial correlations between top predictors of animals’ diabetic status. Relationships (FDR adjusted p-value<0.05) are displayed for statistically different (FDR adjusted p-value<0.05 )and O-PLS-DA selected discriminants between diabetic and non- diabetic animals. Node size shows the fold change in means relative to non-diabetics. Figure 4. Heatmap displaying hierarchically clustered Spearman correlations between animal characteristics (weight and glucose) and major classes of measured metabolites and lipids. Introduction Methods Conclusion Primary Metabolites Complex Lipids Oxylipins 15µL Plasma 10µL Plasma 250µL Plasma Extraction Chilled 3:3:2 ACN/IPA/Water Derivatization: MeOX in pyridine + MSTFA Liquid-Liquid Extraction Chilled 225µL MeOH (+QC Mix ISTDs) Chilled 750µL MTBE (+ 22:1 CE ISTD) 188µL distilled water Solid Phase Extraction Waters Oasis HLB Cartidges (+ type 1 ISTDs) Instrument GC-TOFMS Analysis Agilent 7890A Gas Chromatograph coupled to a Leco Pegasus IV Time- Of-Flight (TOF) Mass Spectrometer UHPLC-QTOFMS Analysis Infinity Ultra High Performance Liquid Chromatograph coupled with an Agilent 1290 Accurate Mass- 6530-QTOF UPLC-MS/MS Analysis Agilent 1200 SL UPLC coupled to a 4000QTRAP Mass Spectrometer Column 30m long, 0.25mm i.d. Rtx5 Sil-MS column with 0.25µM 5% diphenyl film; +10m integrated guard column (Restek, Bellefonte PA) Waters Acquity UPLC CSH C18 (100mm length x 2.1mm internal diamtere; 1.7µM particles) + Water Acquity Vanguard CSH C18 1.7µM Pre-column 2.1 x 150mm Eclipse Plus C18 column with a 1.8µM particle size Data Processing Fiehnlab BinBase DB MzMine 2.10 AB SCIEX Analyst Software 1.4.2 Primary Metabolites Complex Lipids Oxylipins Figure 1. Number of significantly altered metabolites between diabetic and non-diabetic animals. False discovery rate (FDR) adjusted Mann-Whitney U test p-value < 0.05. Data Acquisition Data Analysis Statistical Analysis Hierarchical Clustering Principal Components (PCA) and Orthogonal Partial Least Squares (O-PLS) DeviumWeb (https://github.com/dgrapov/DeviumWeb) MetmapR (https://github.com/dgrapov/MetaMapR) DeviumWeb Software Method MetMapR Network Analysis and Visualization Pathway Enrichment and Visualization