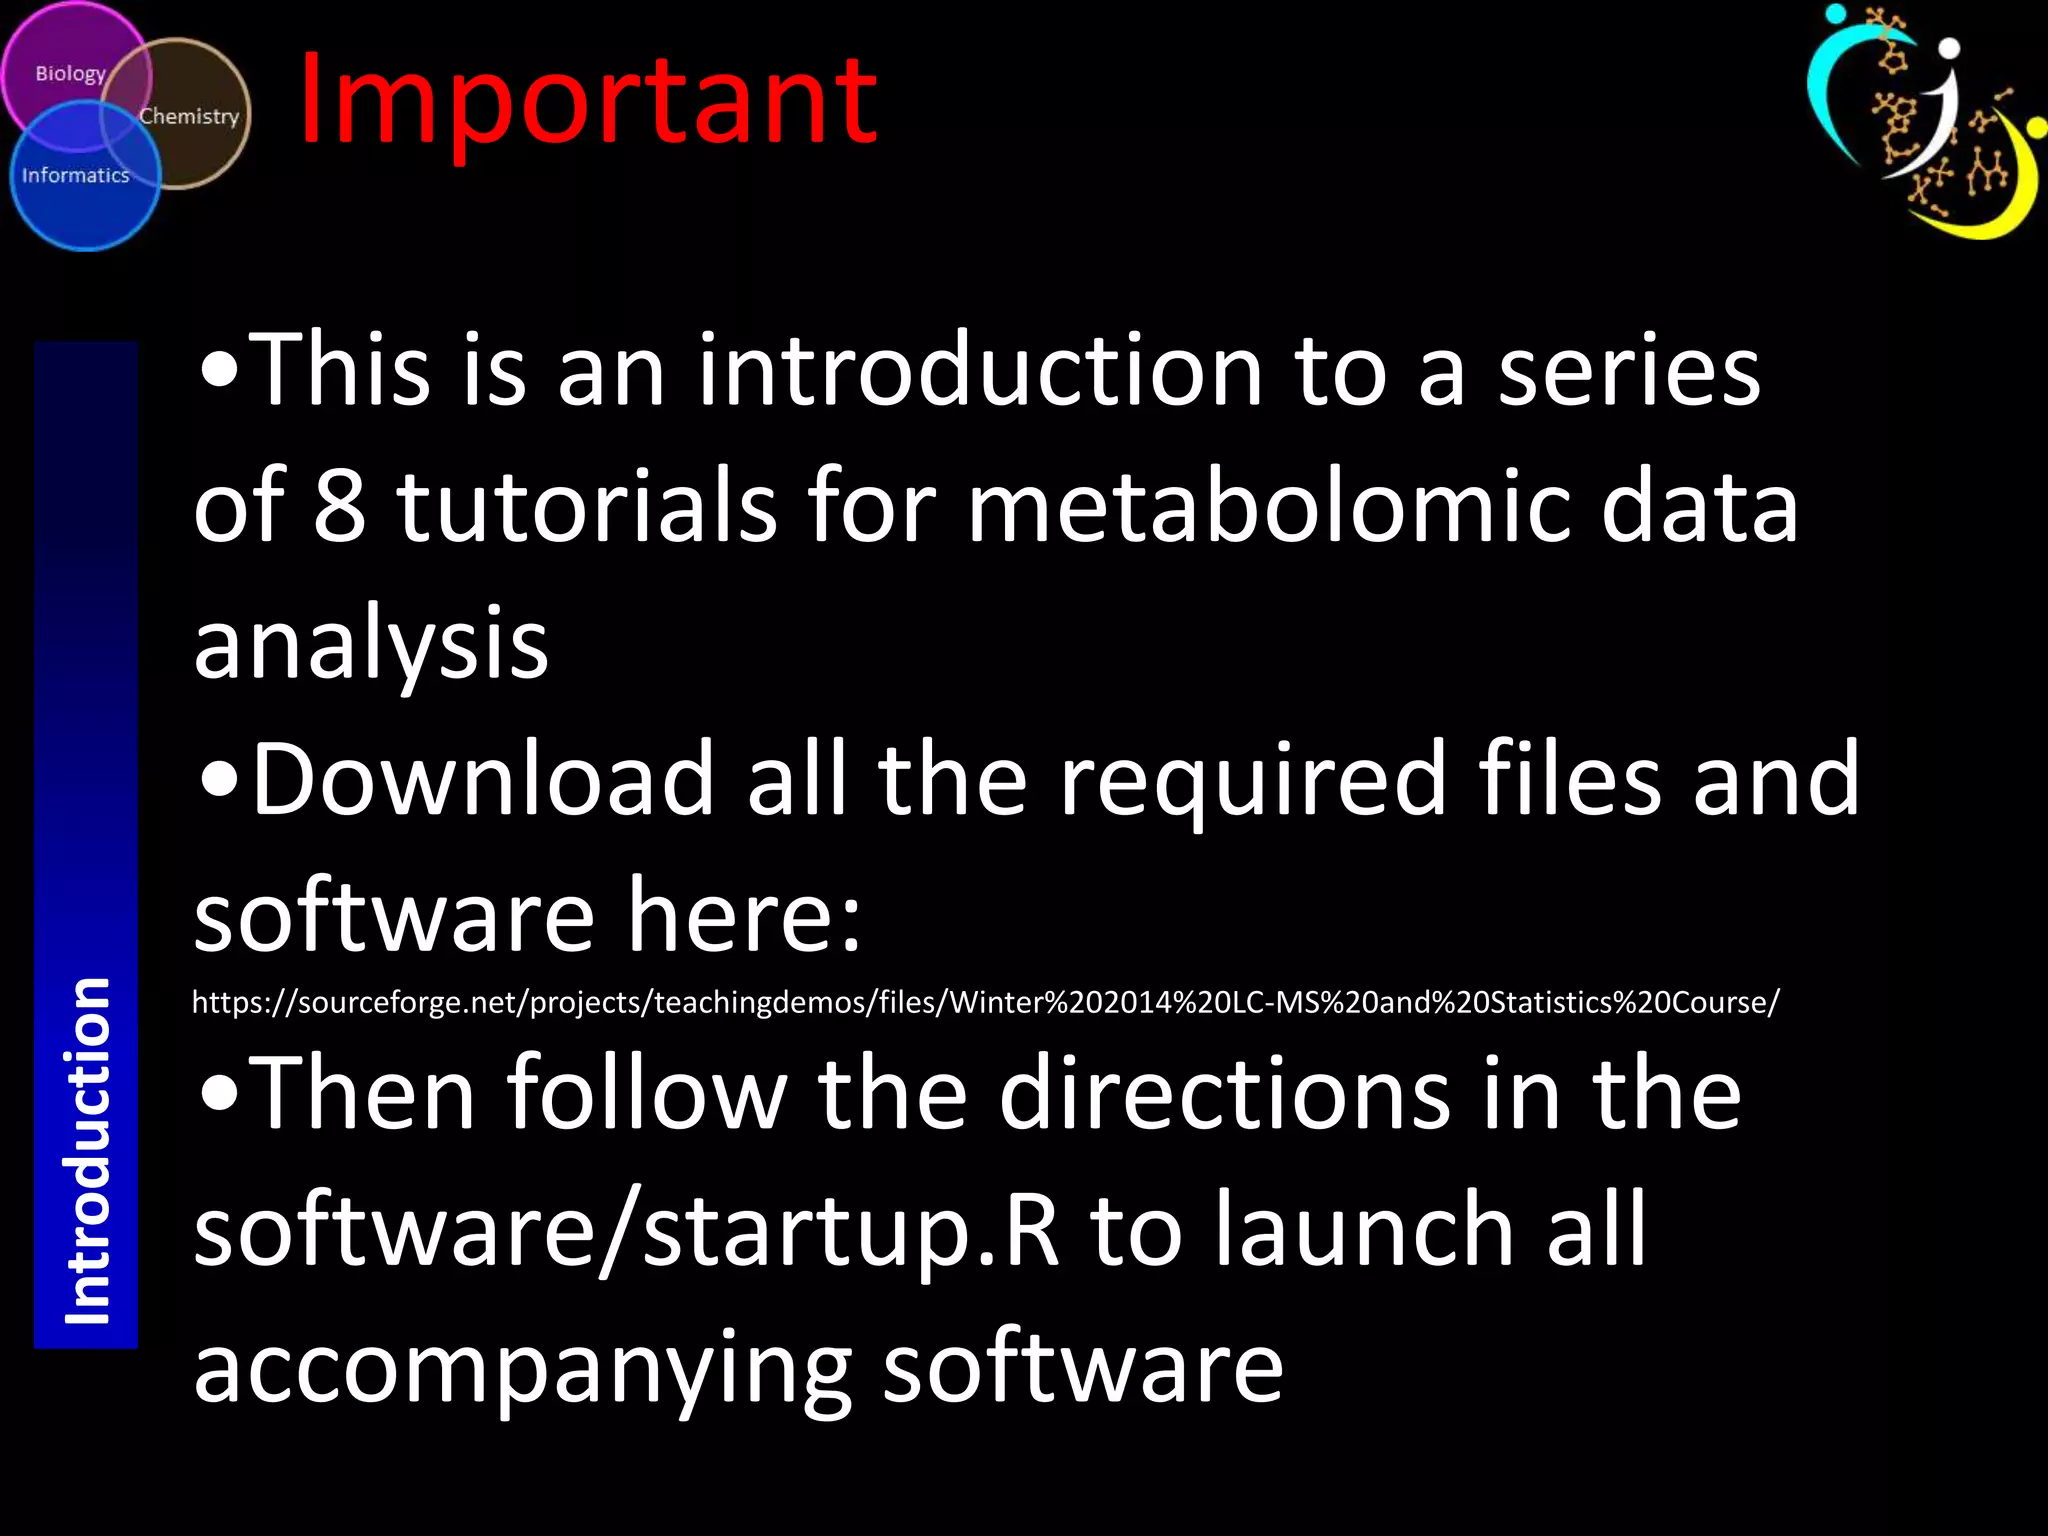
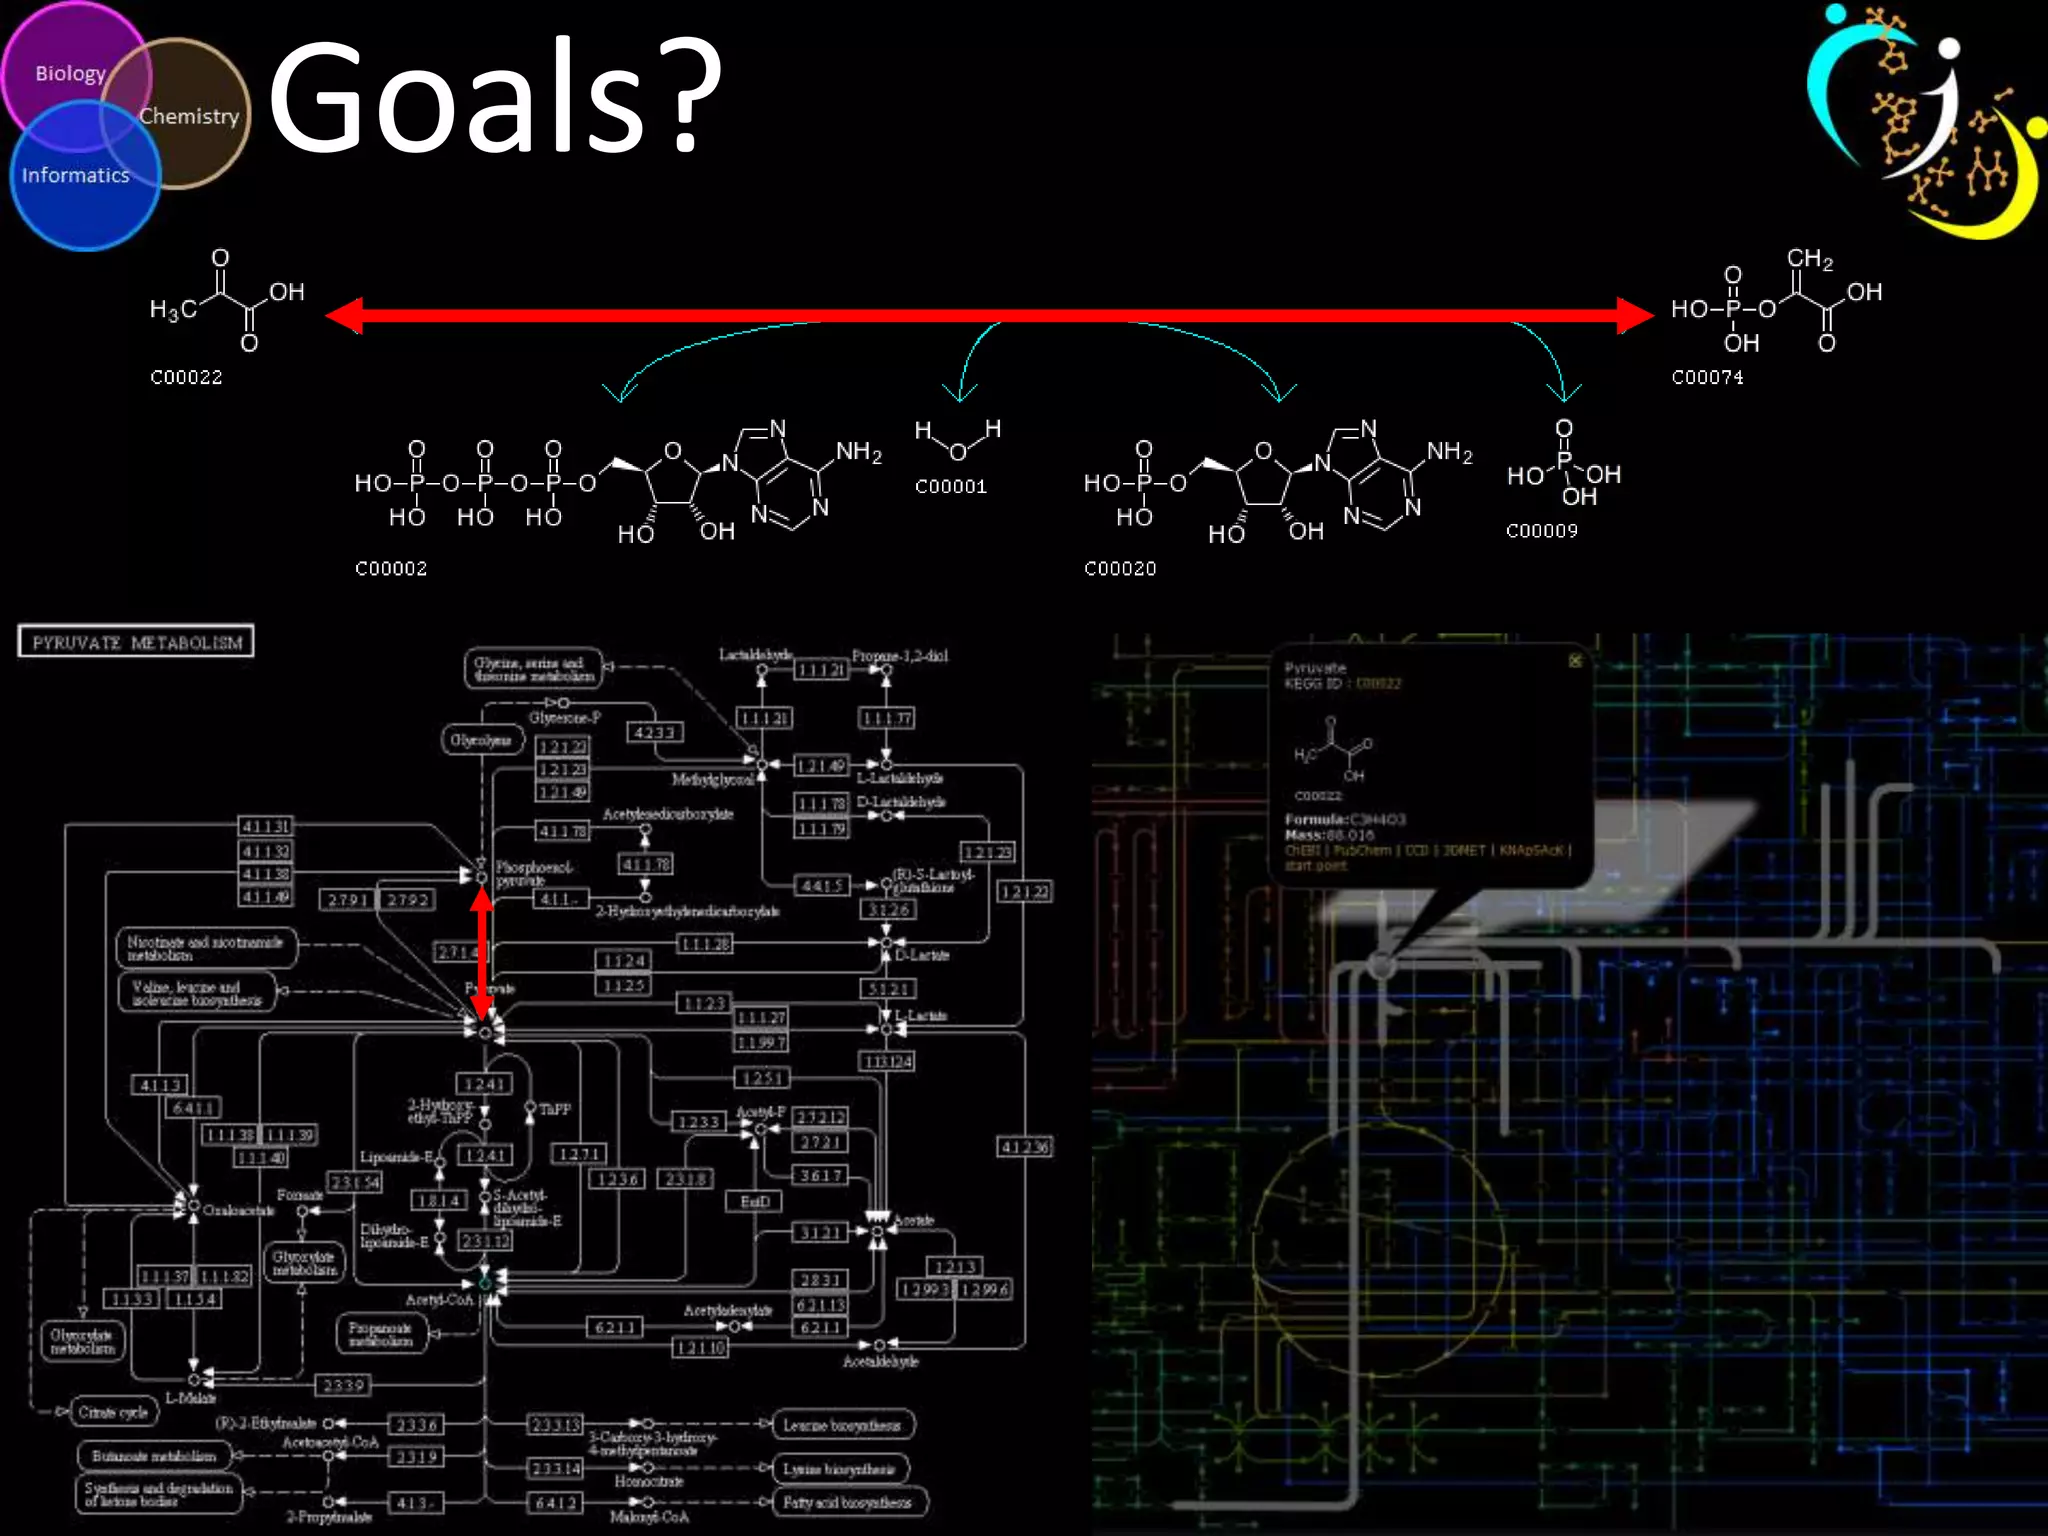
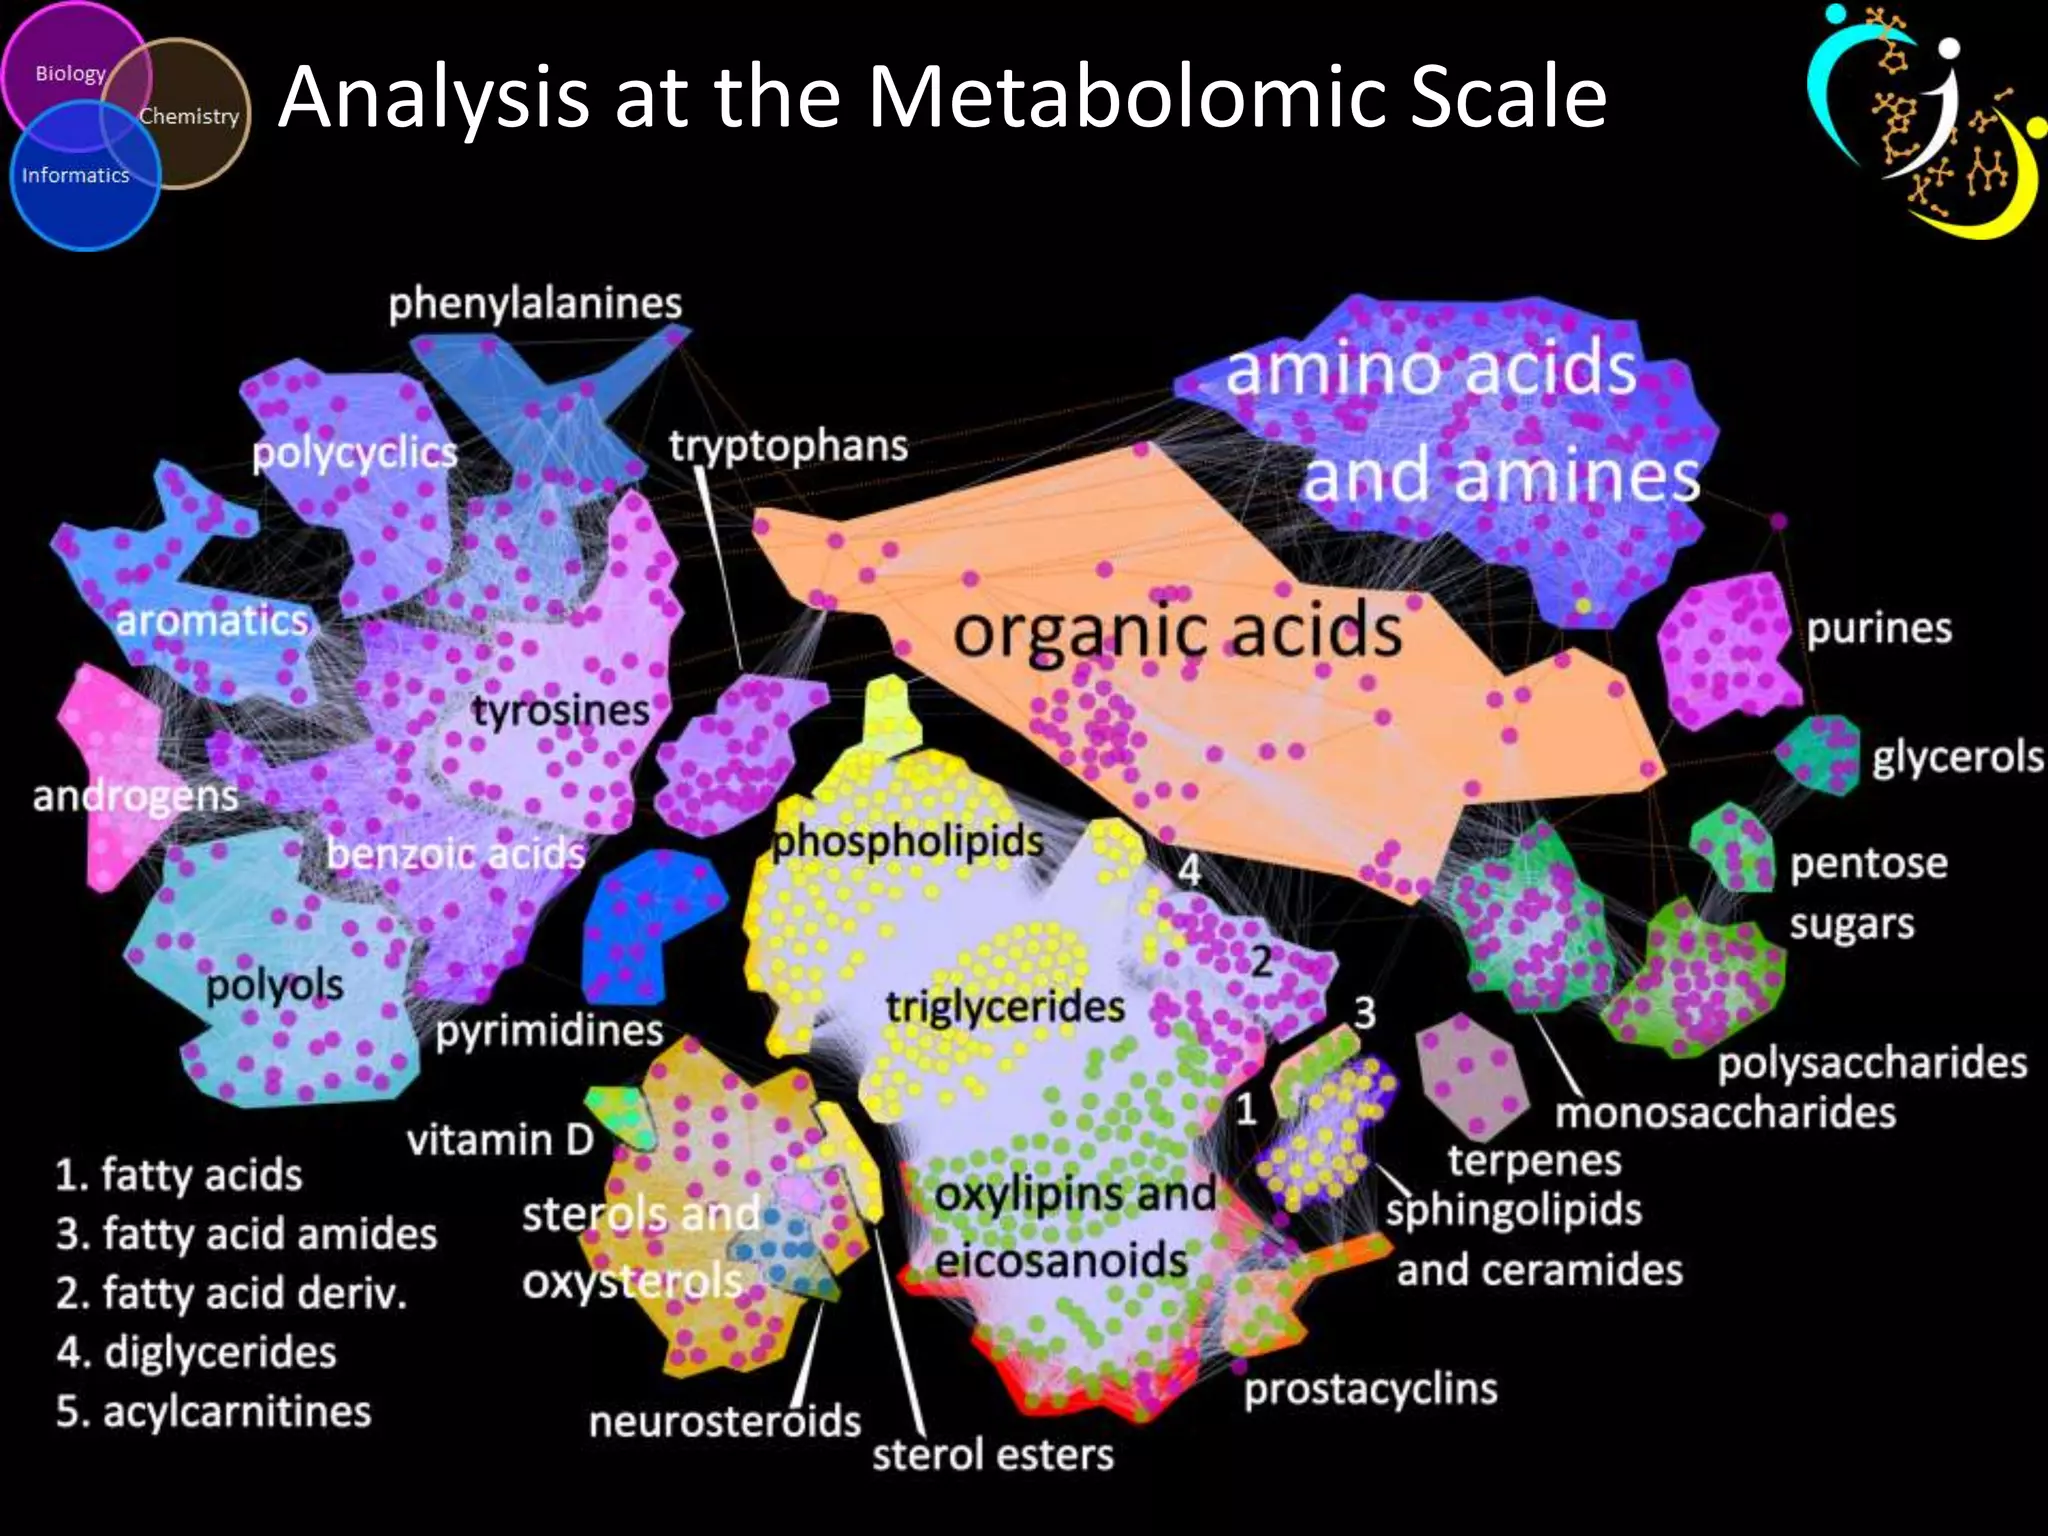
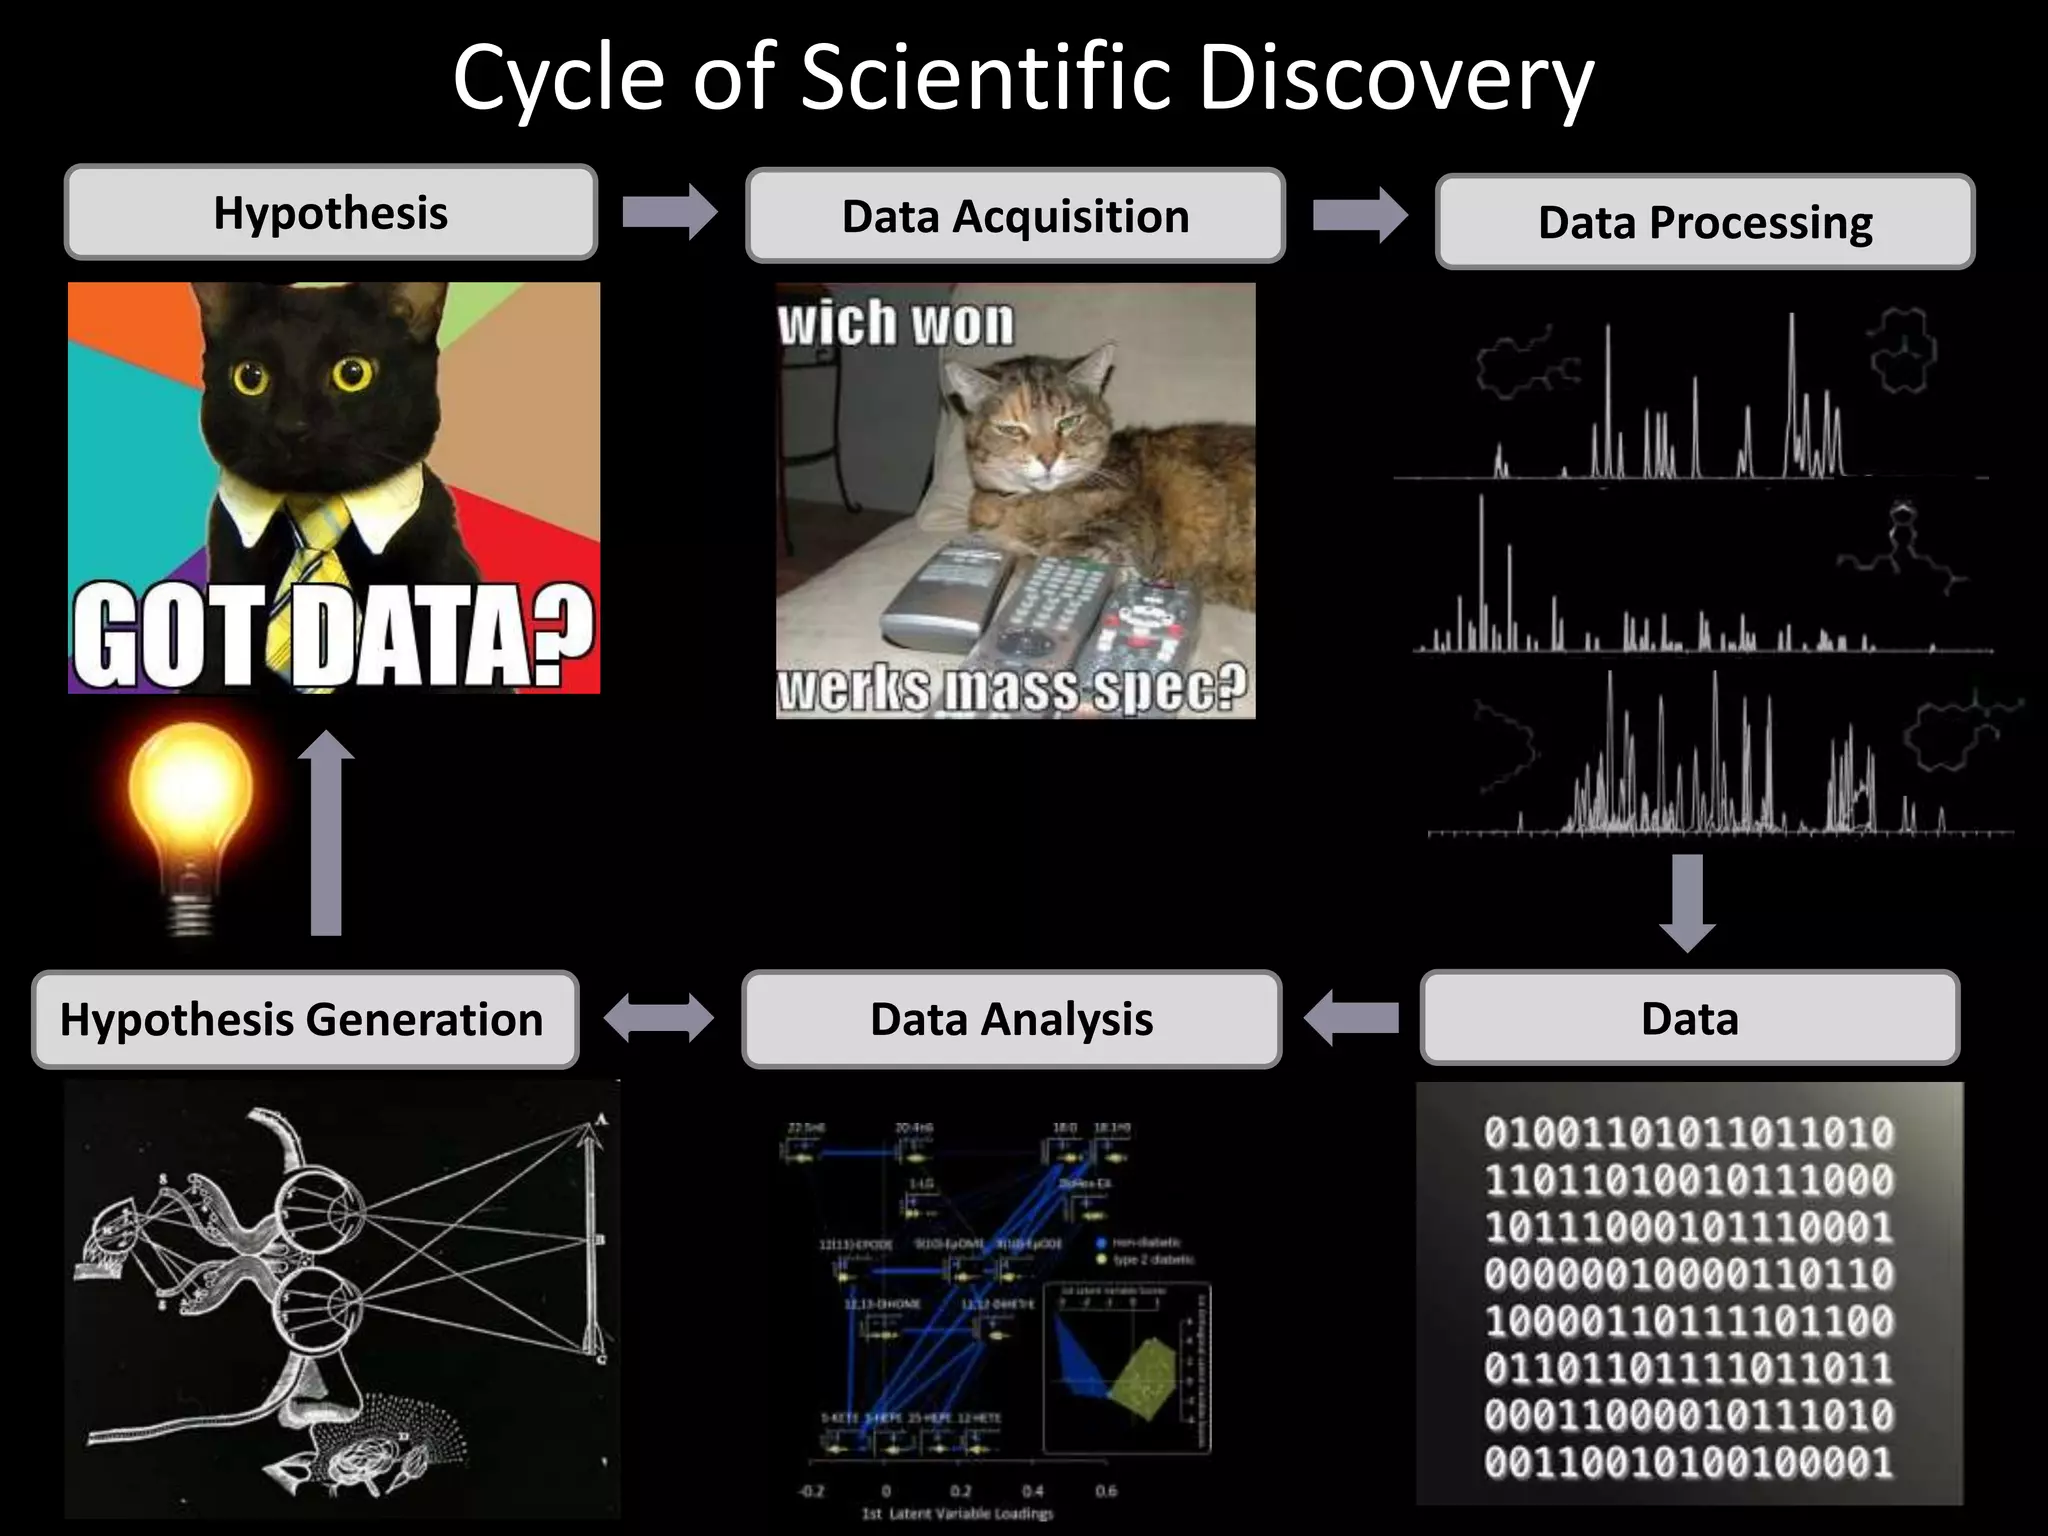
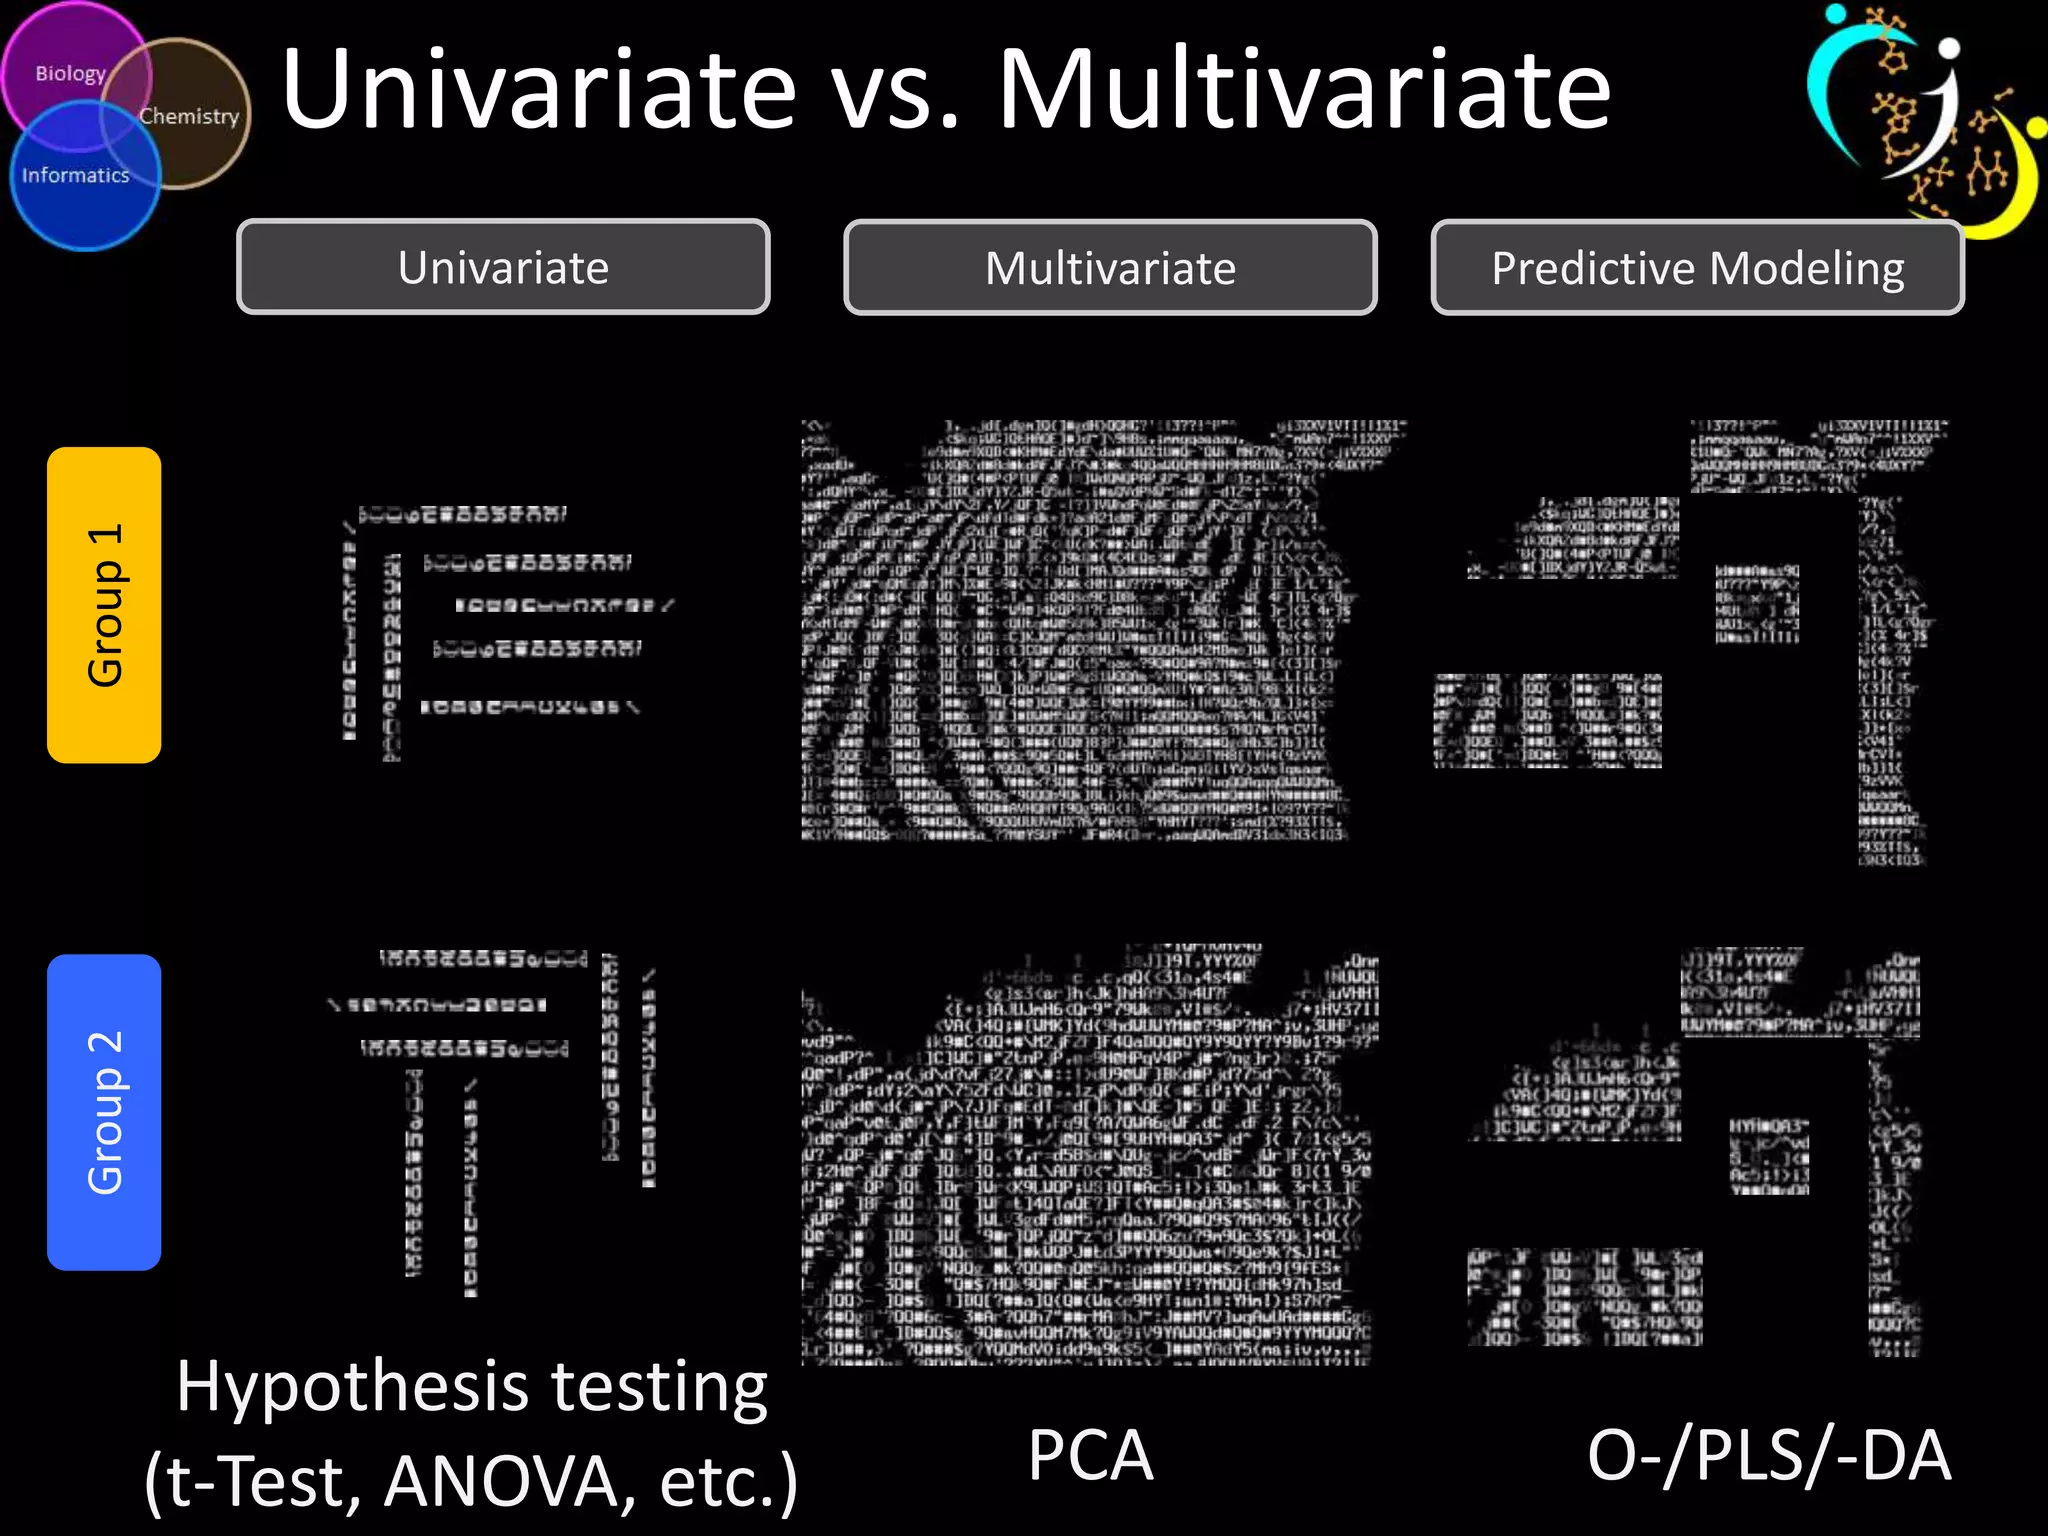
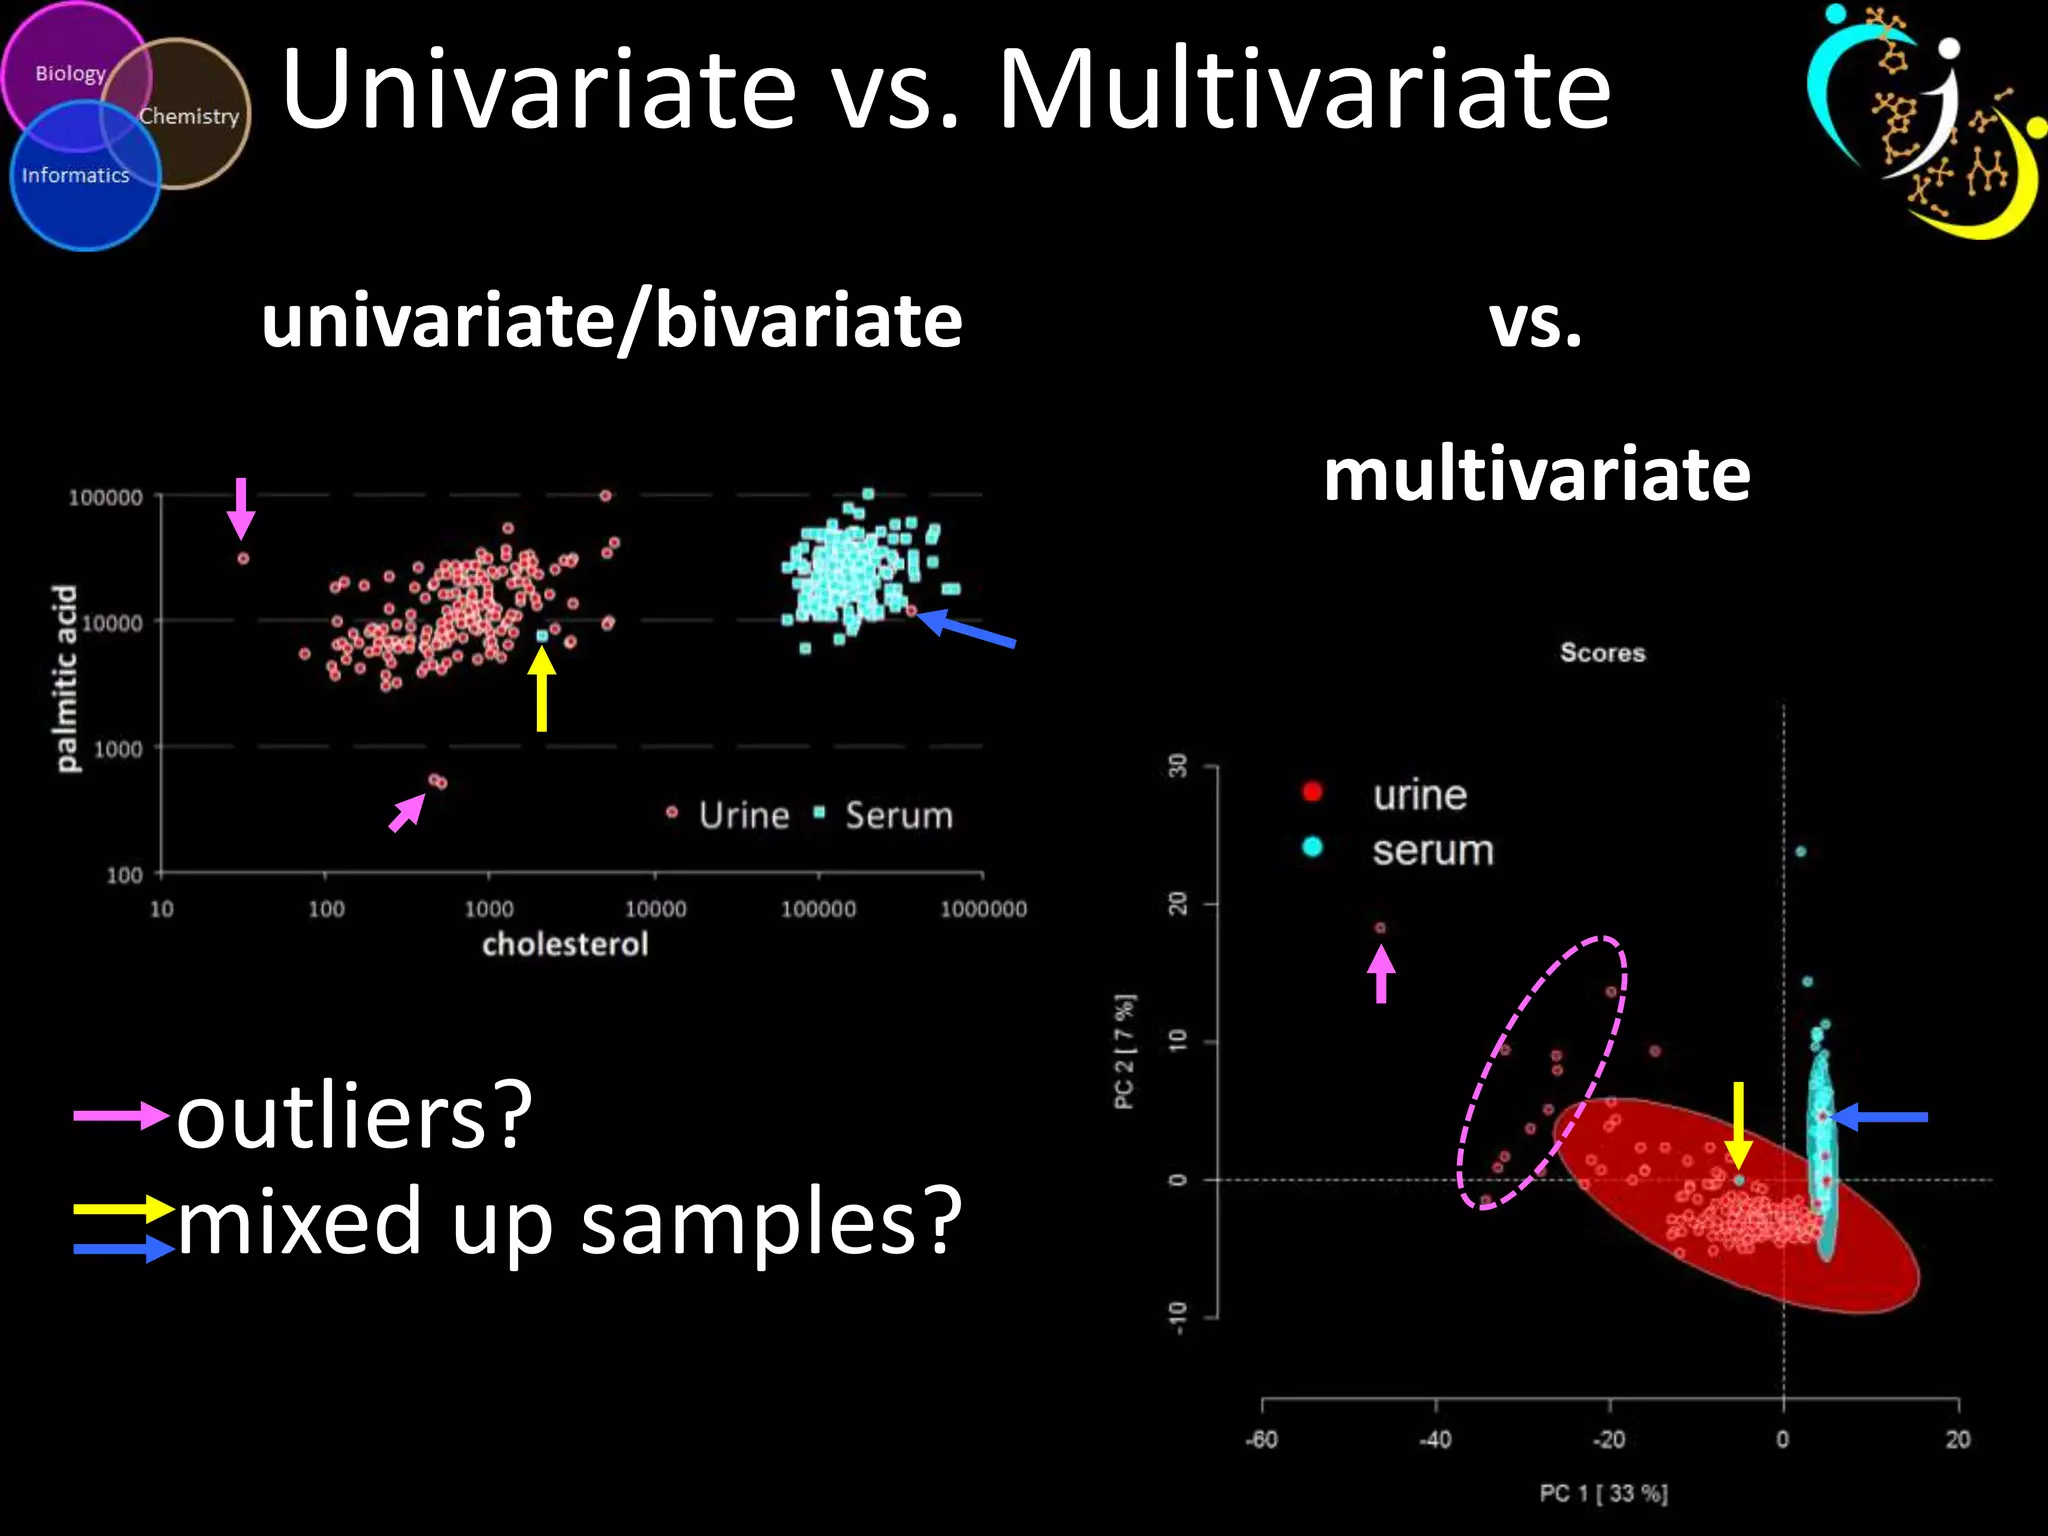
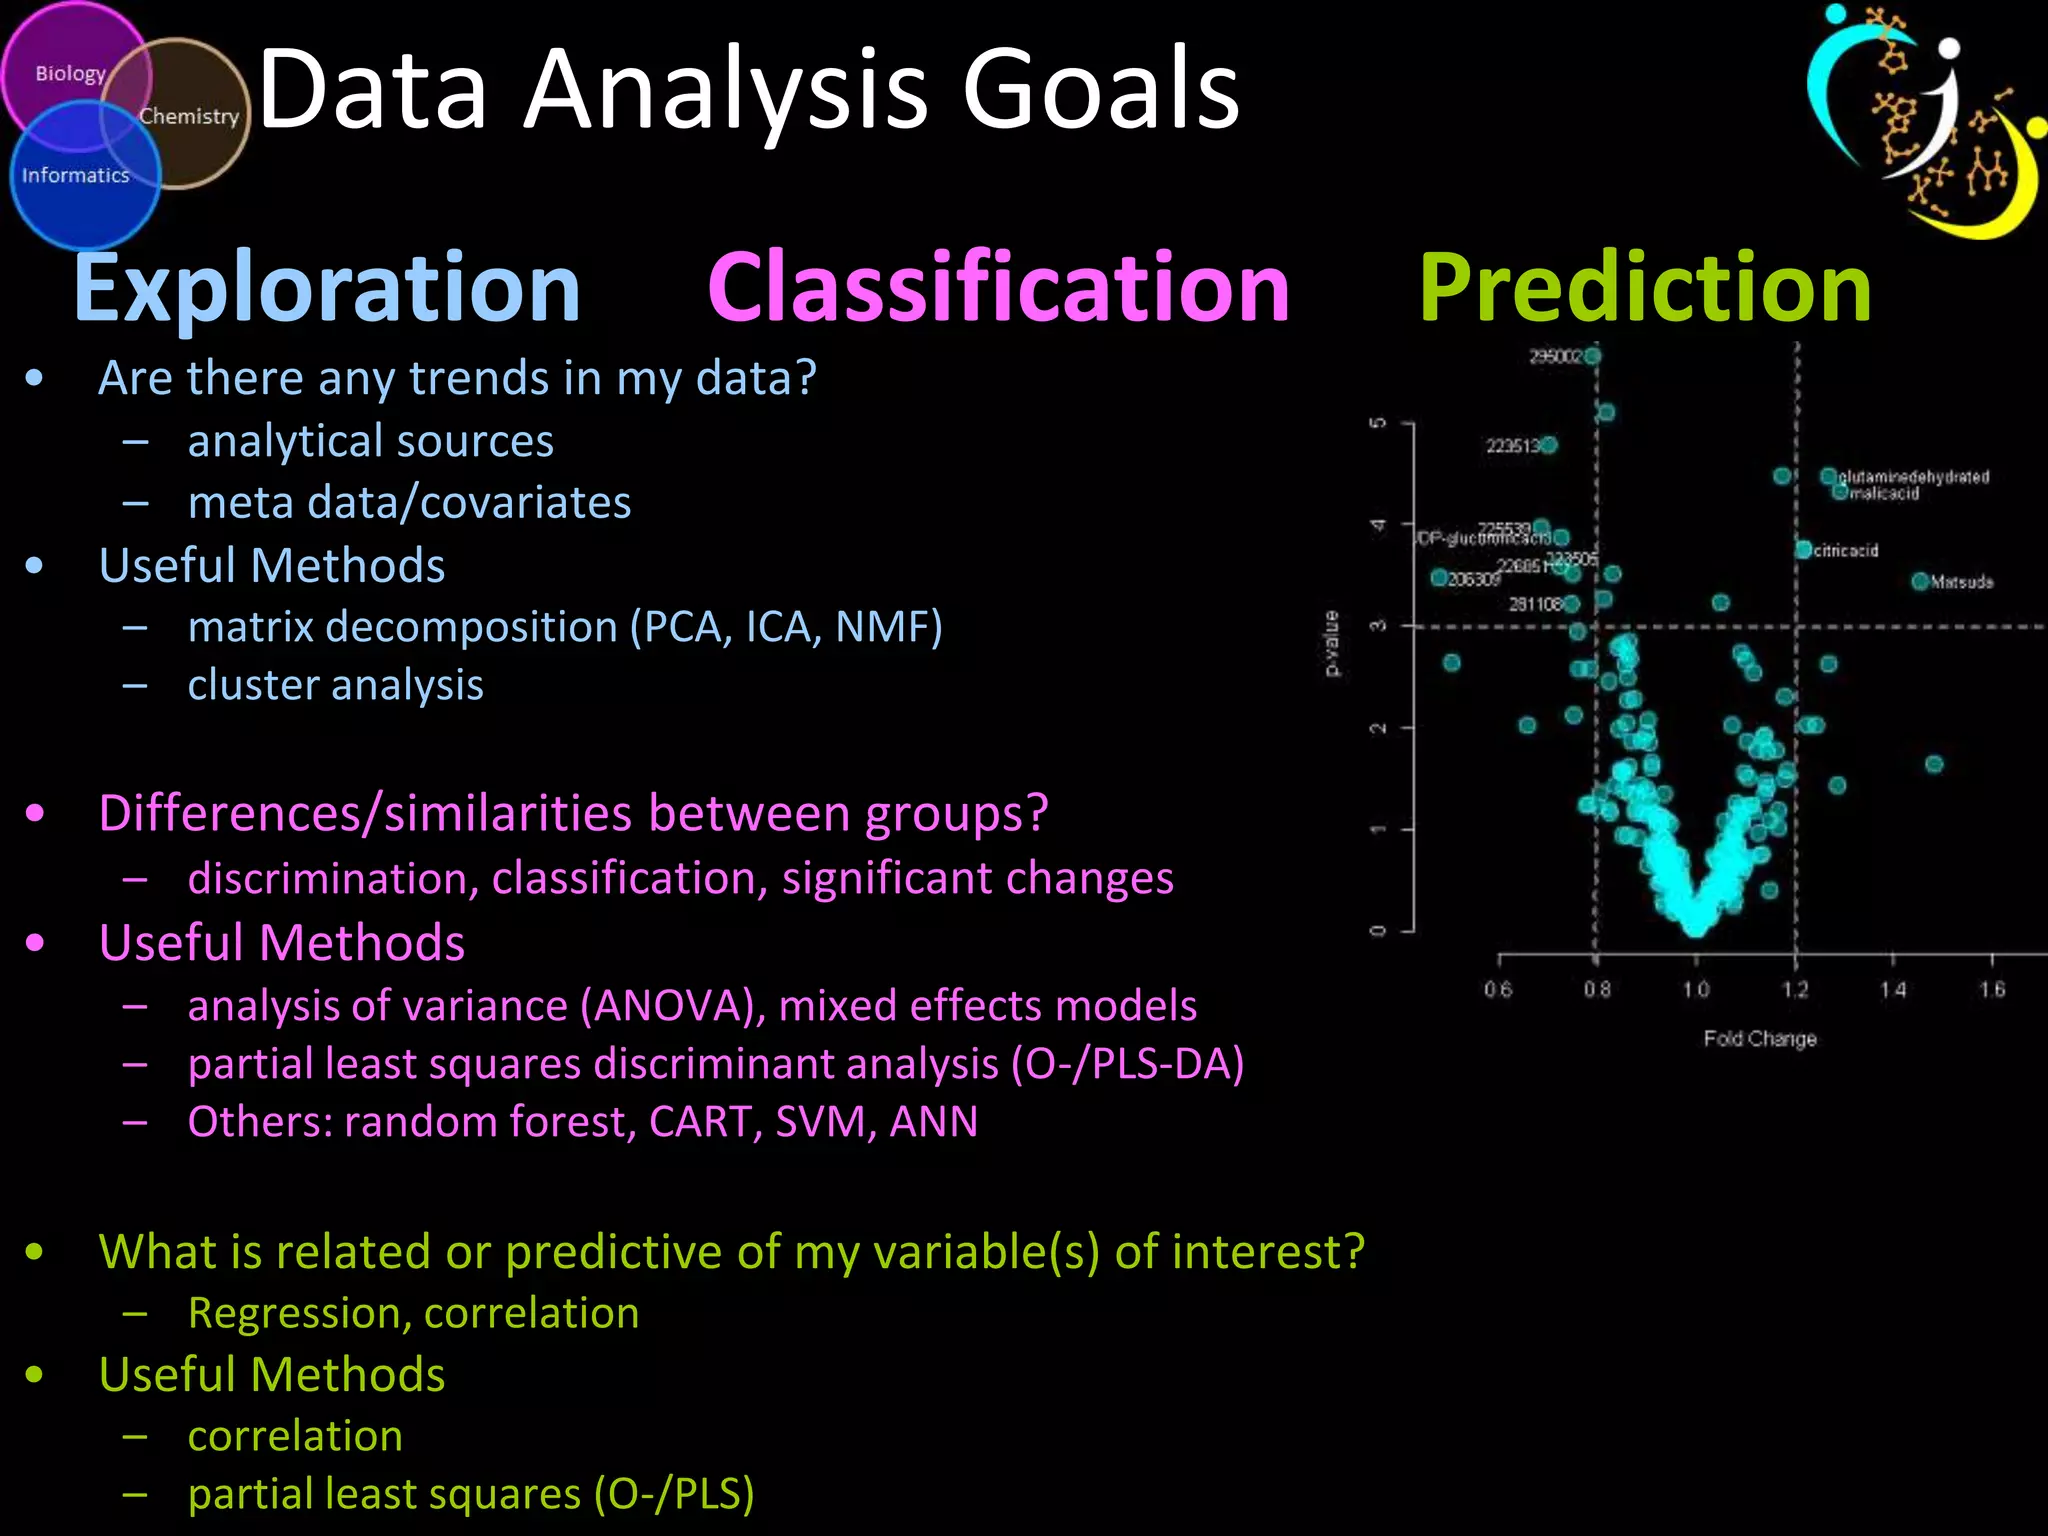
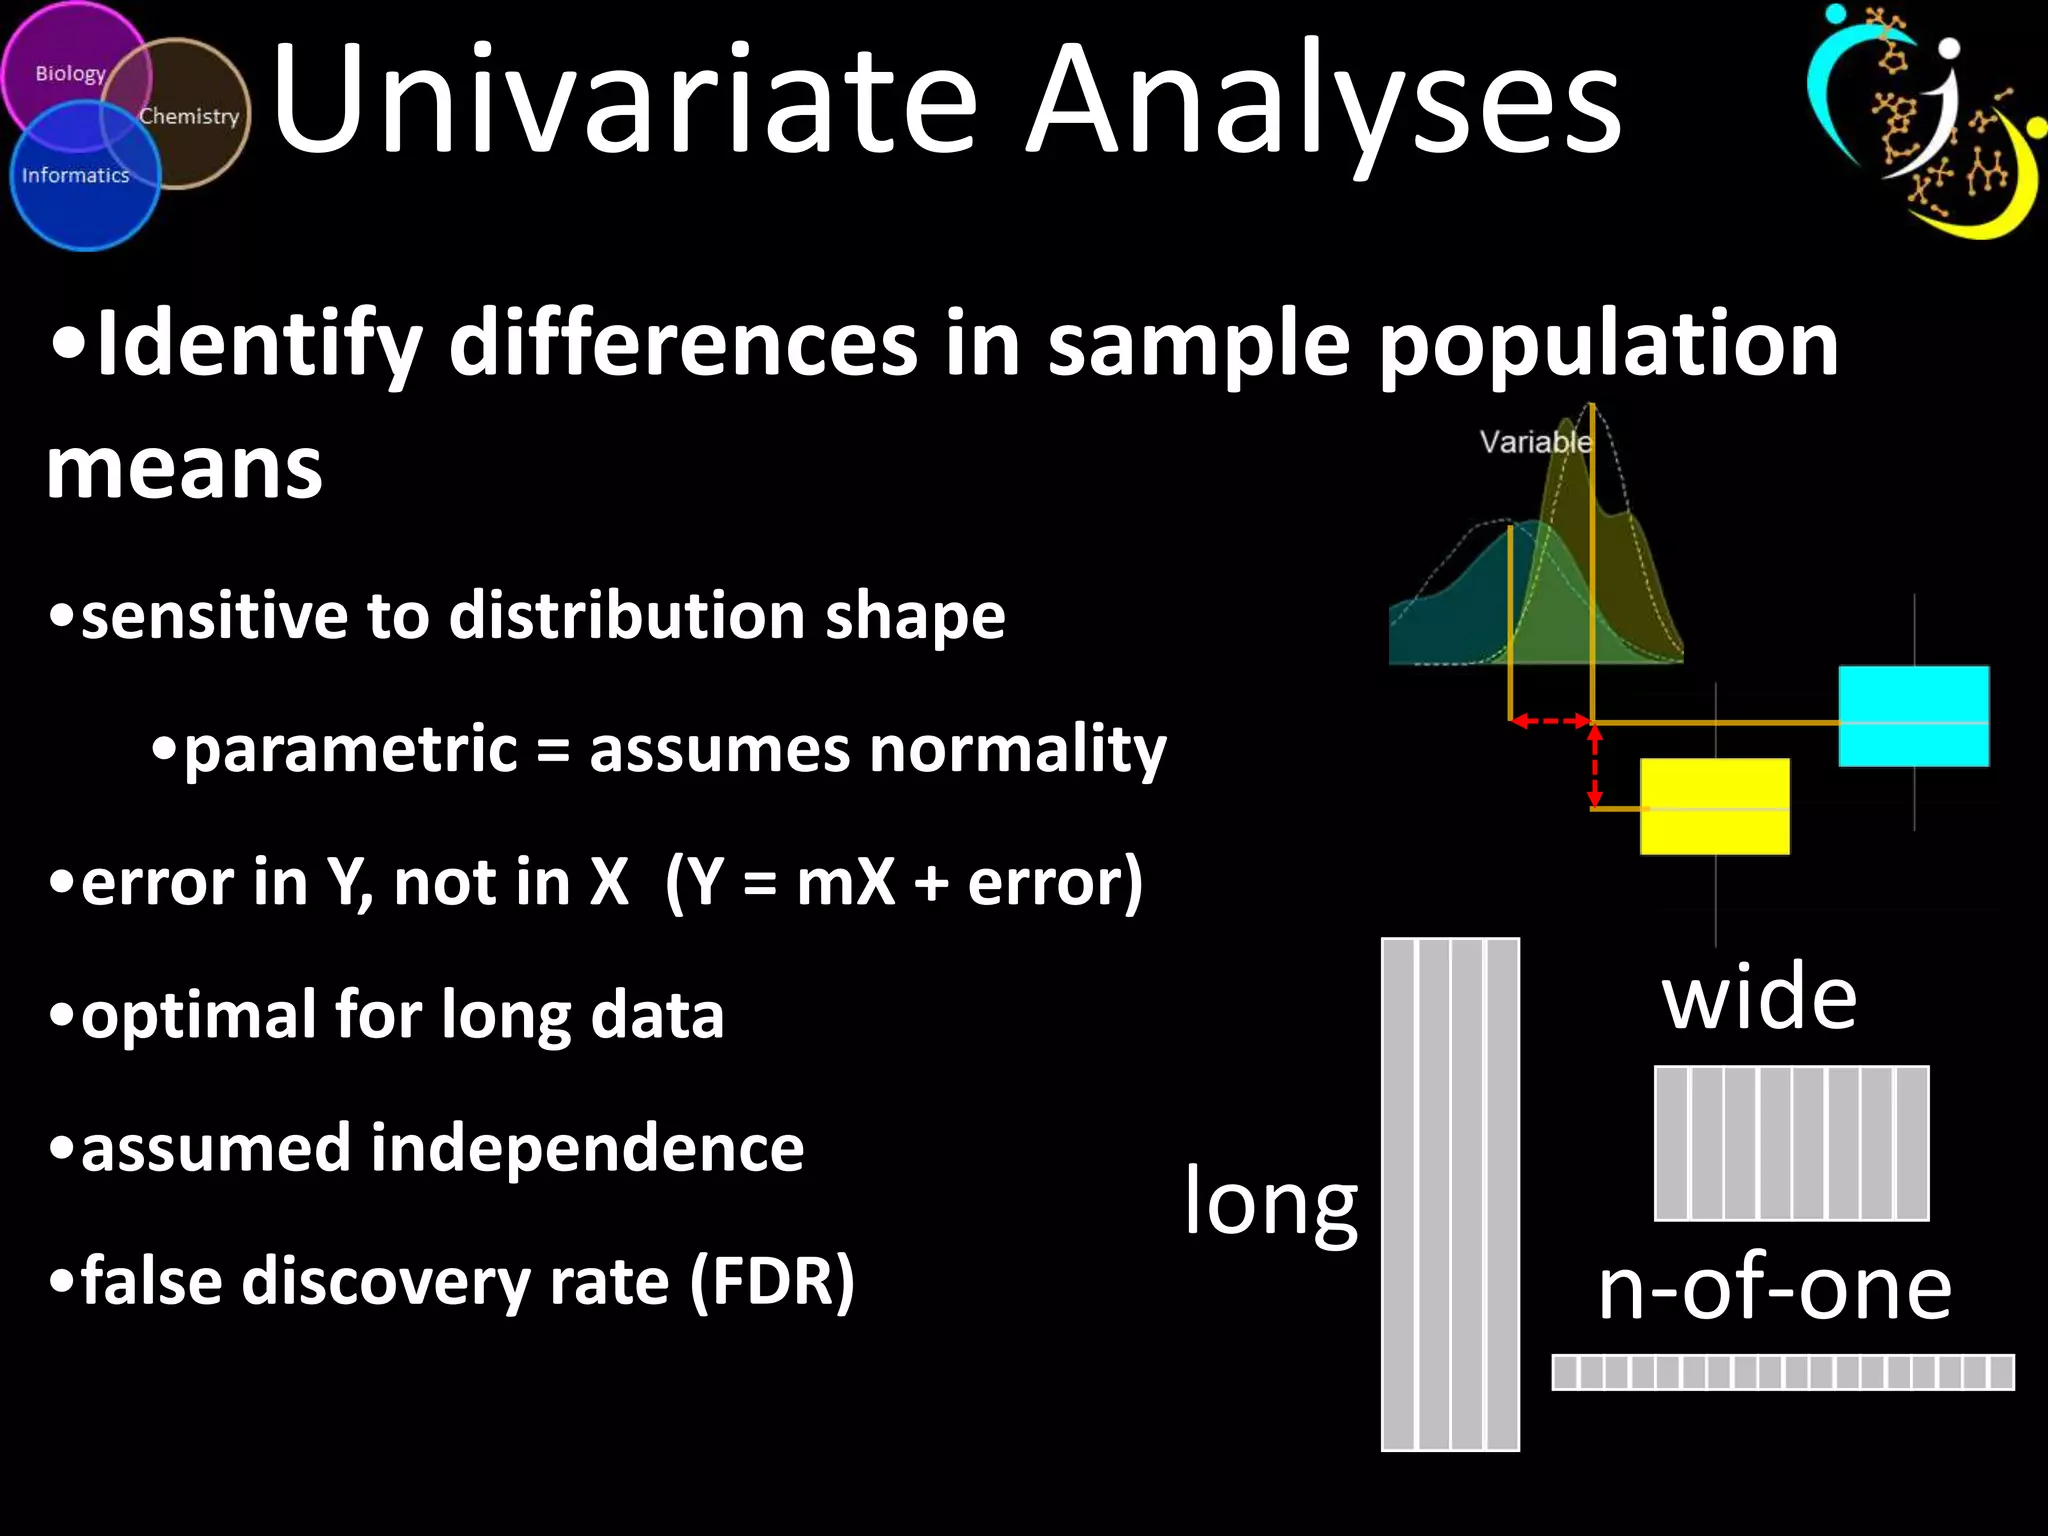
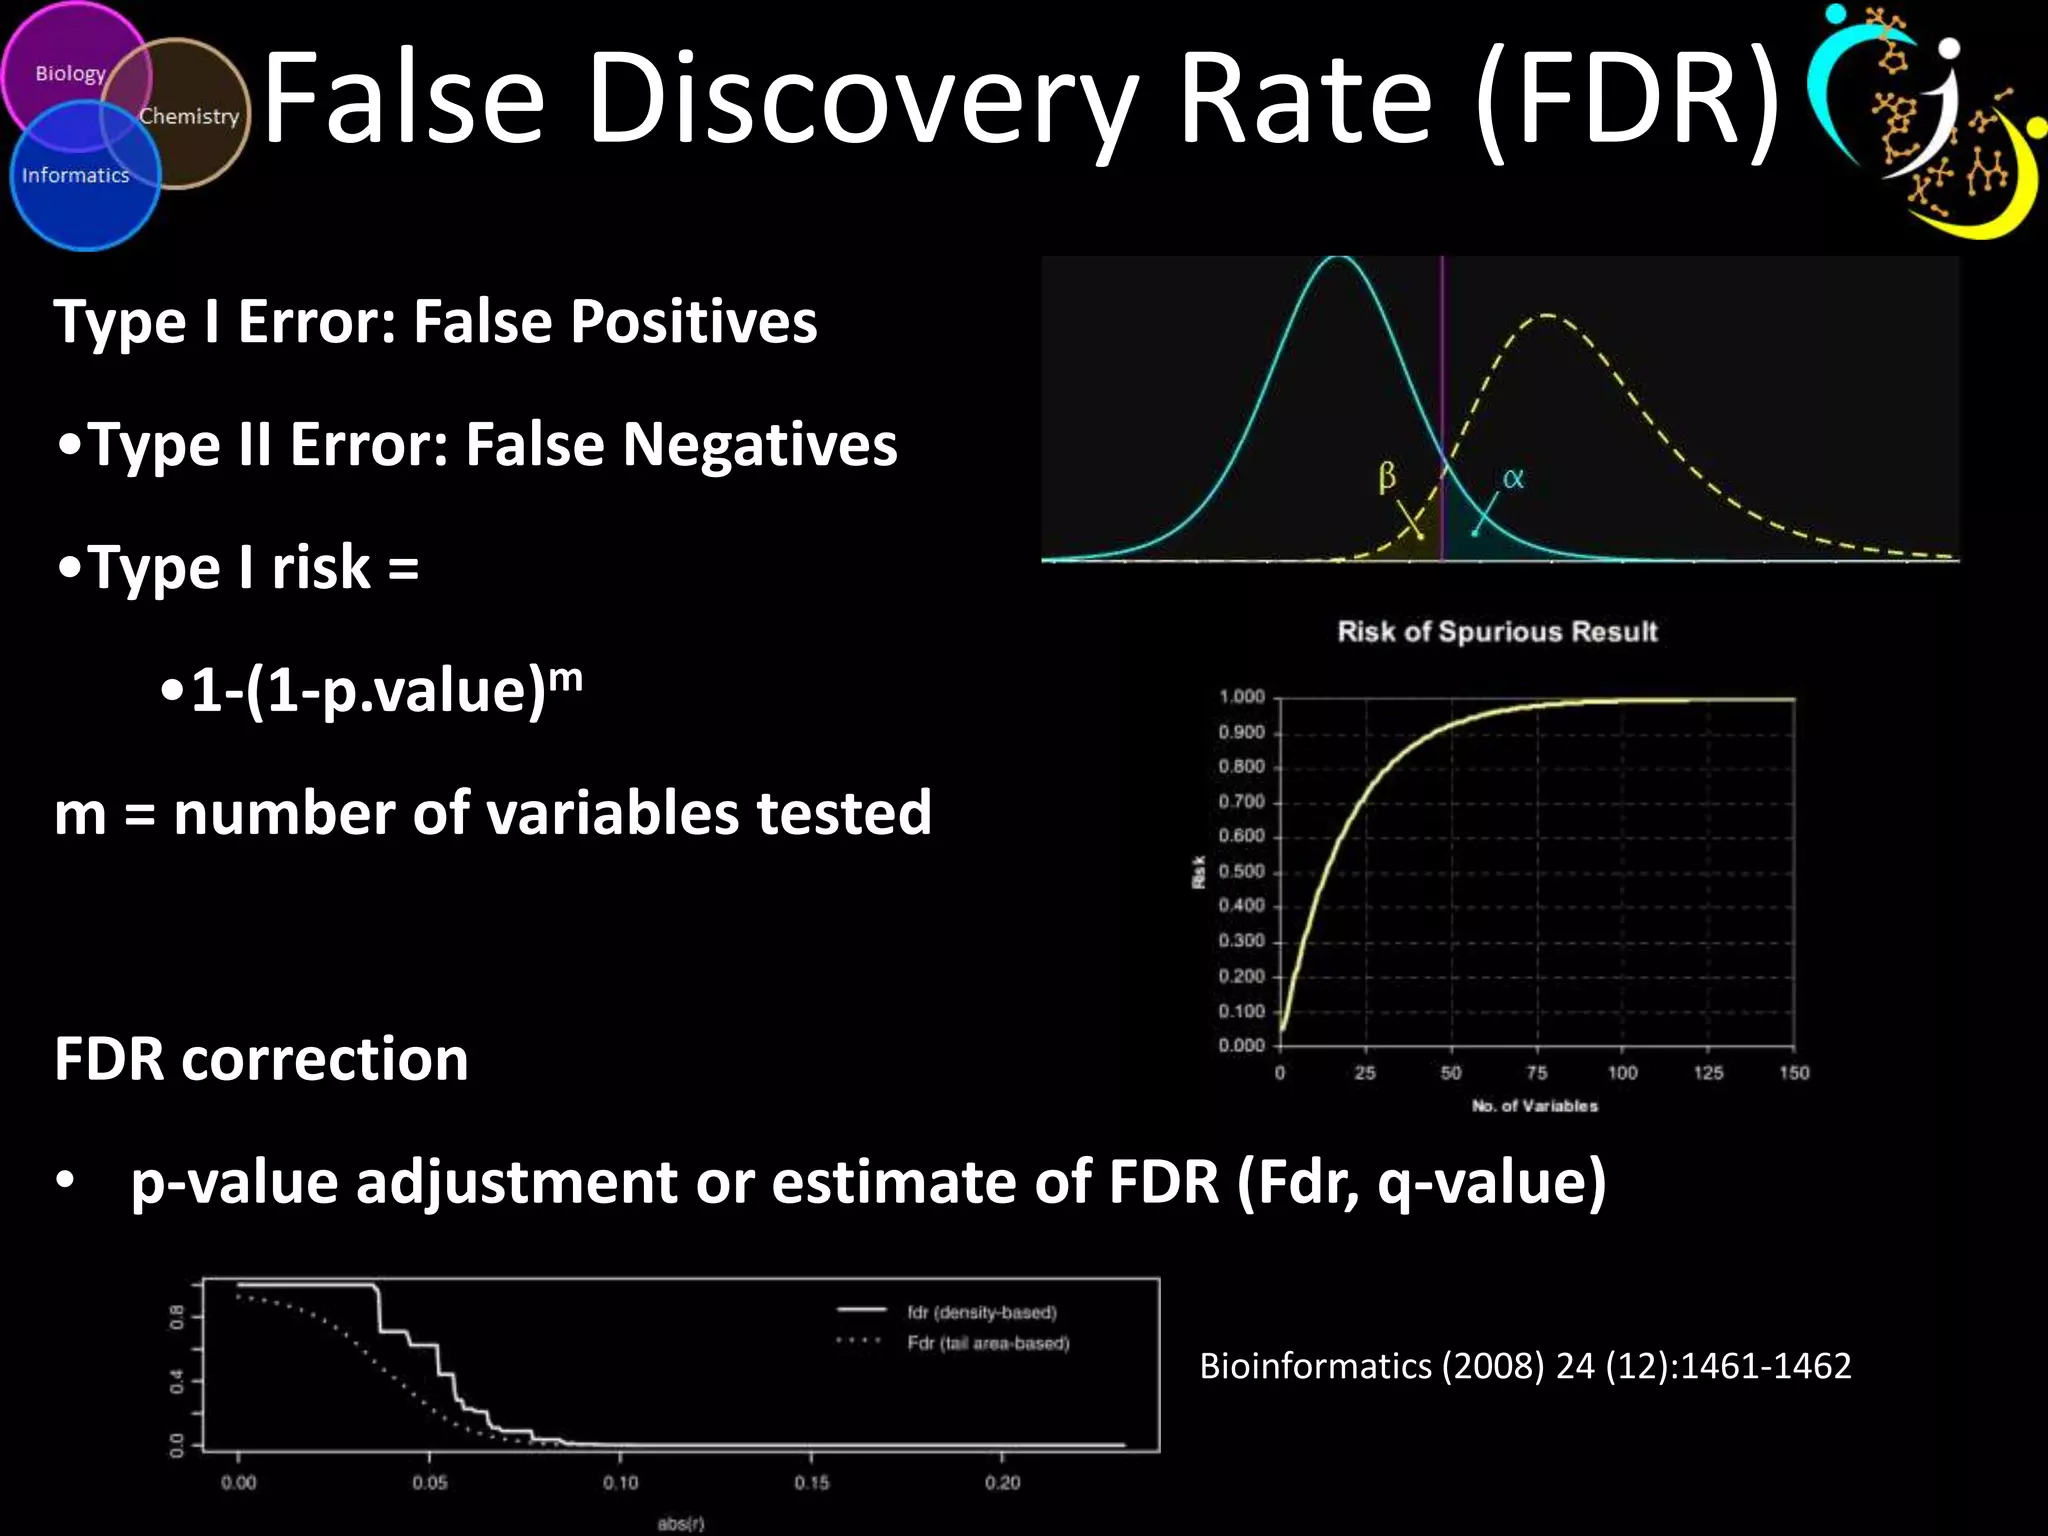
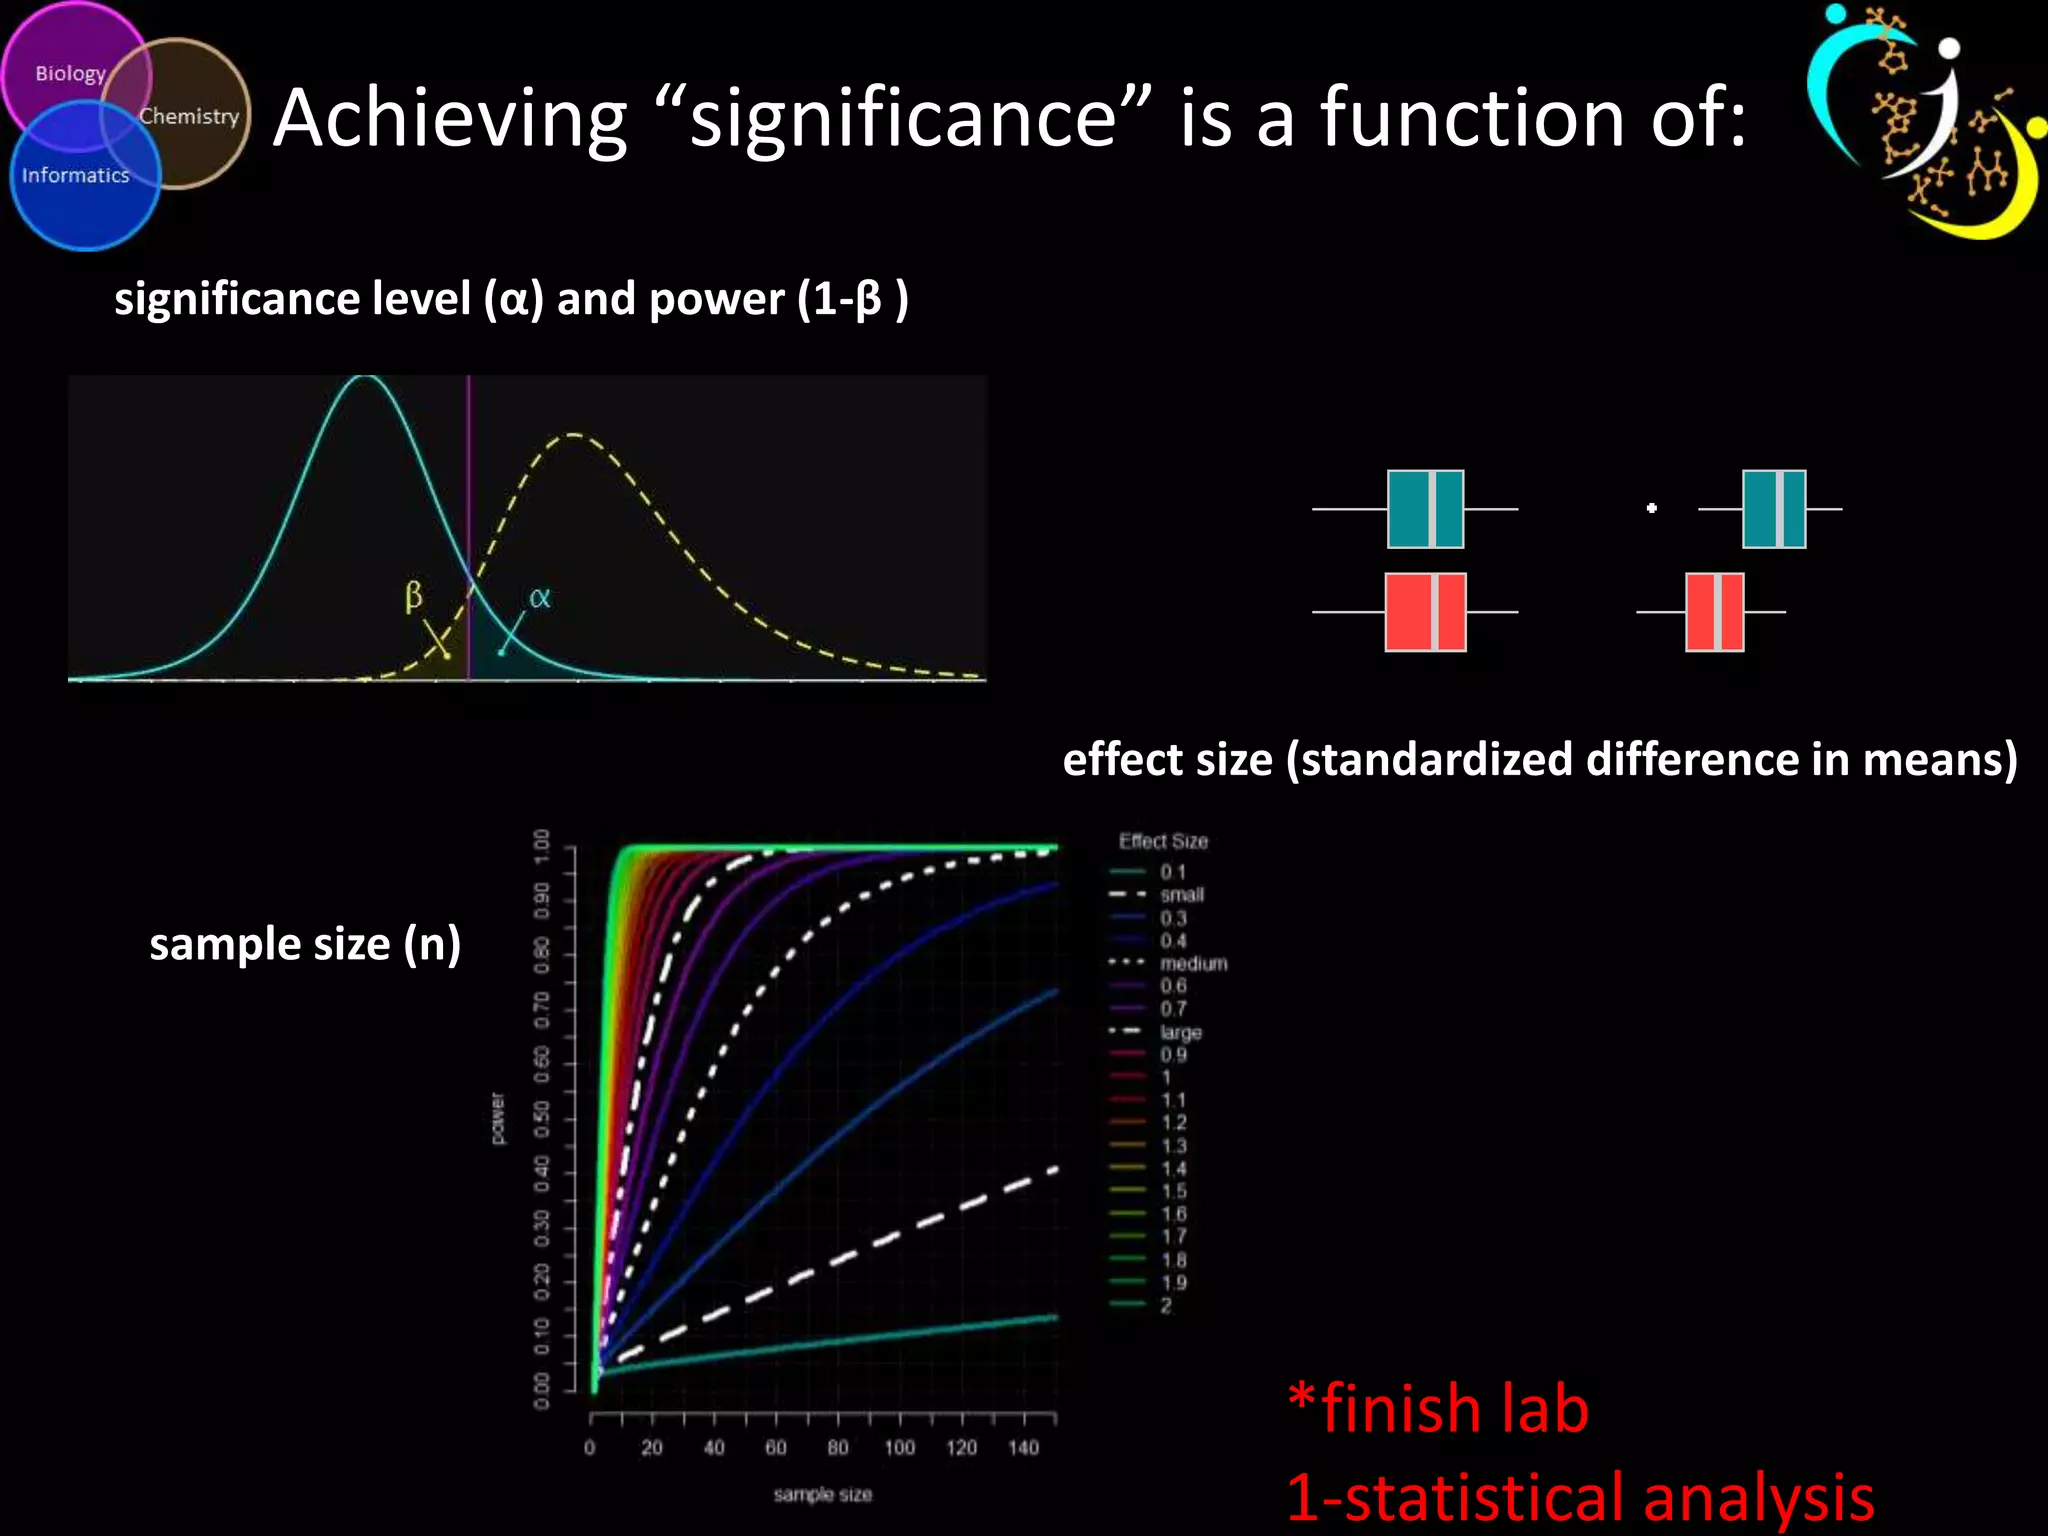
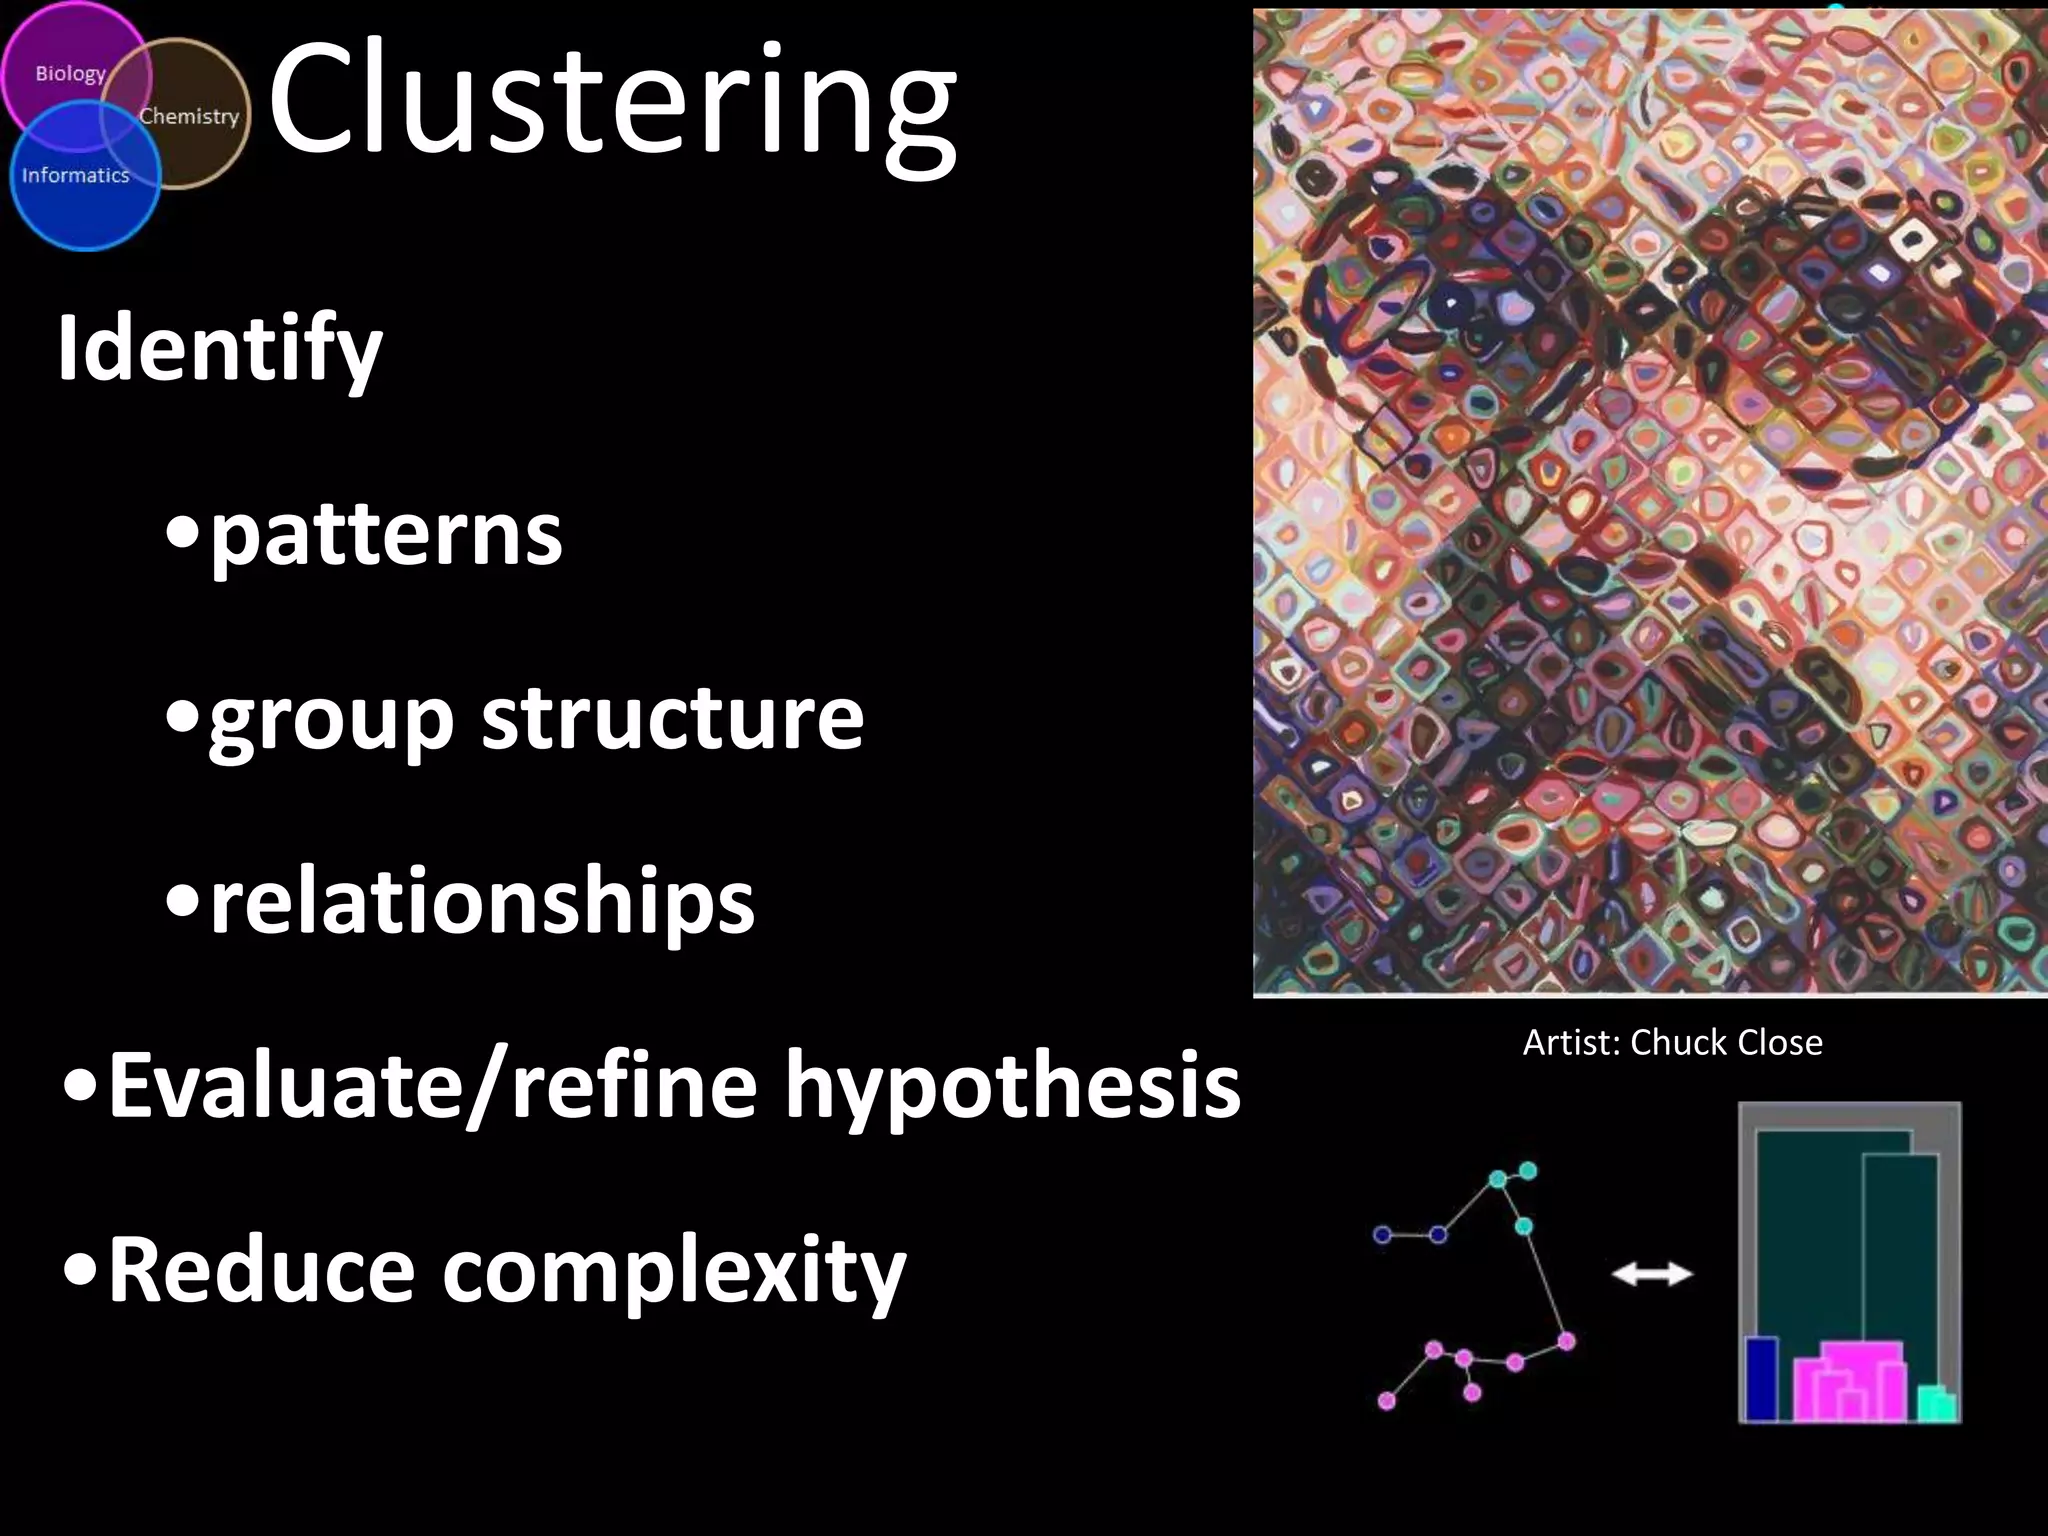
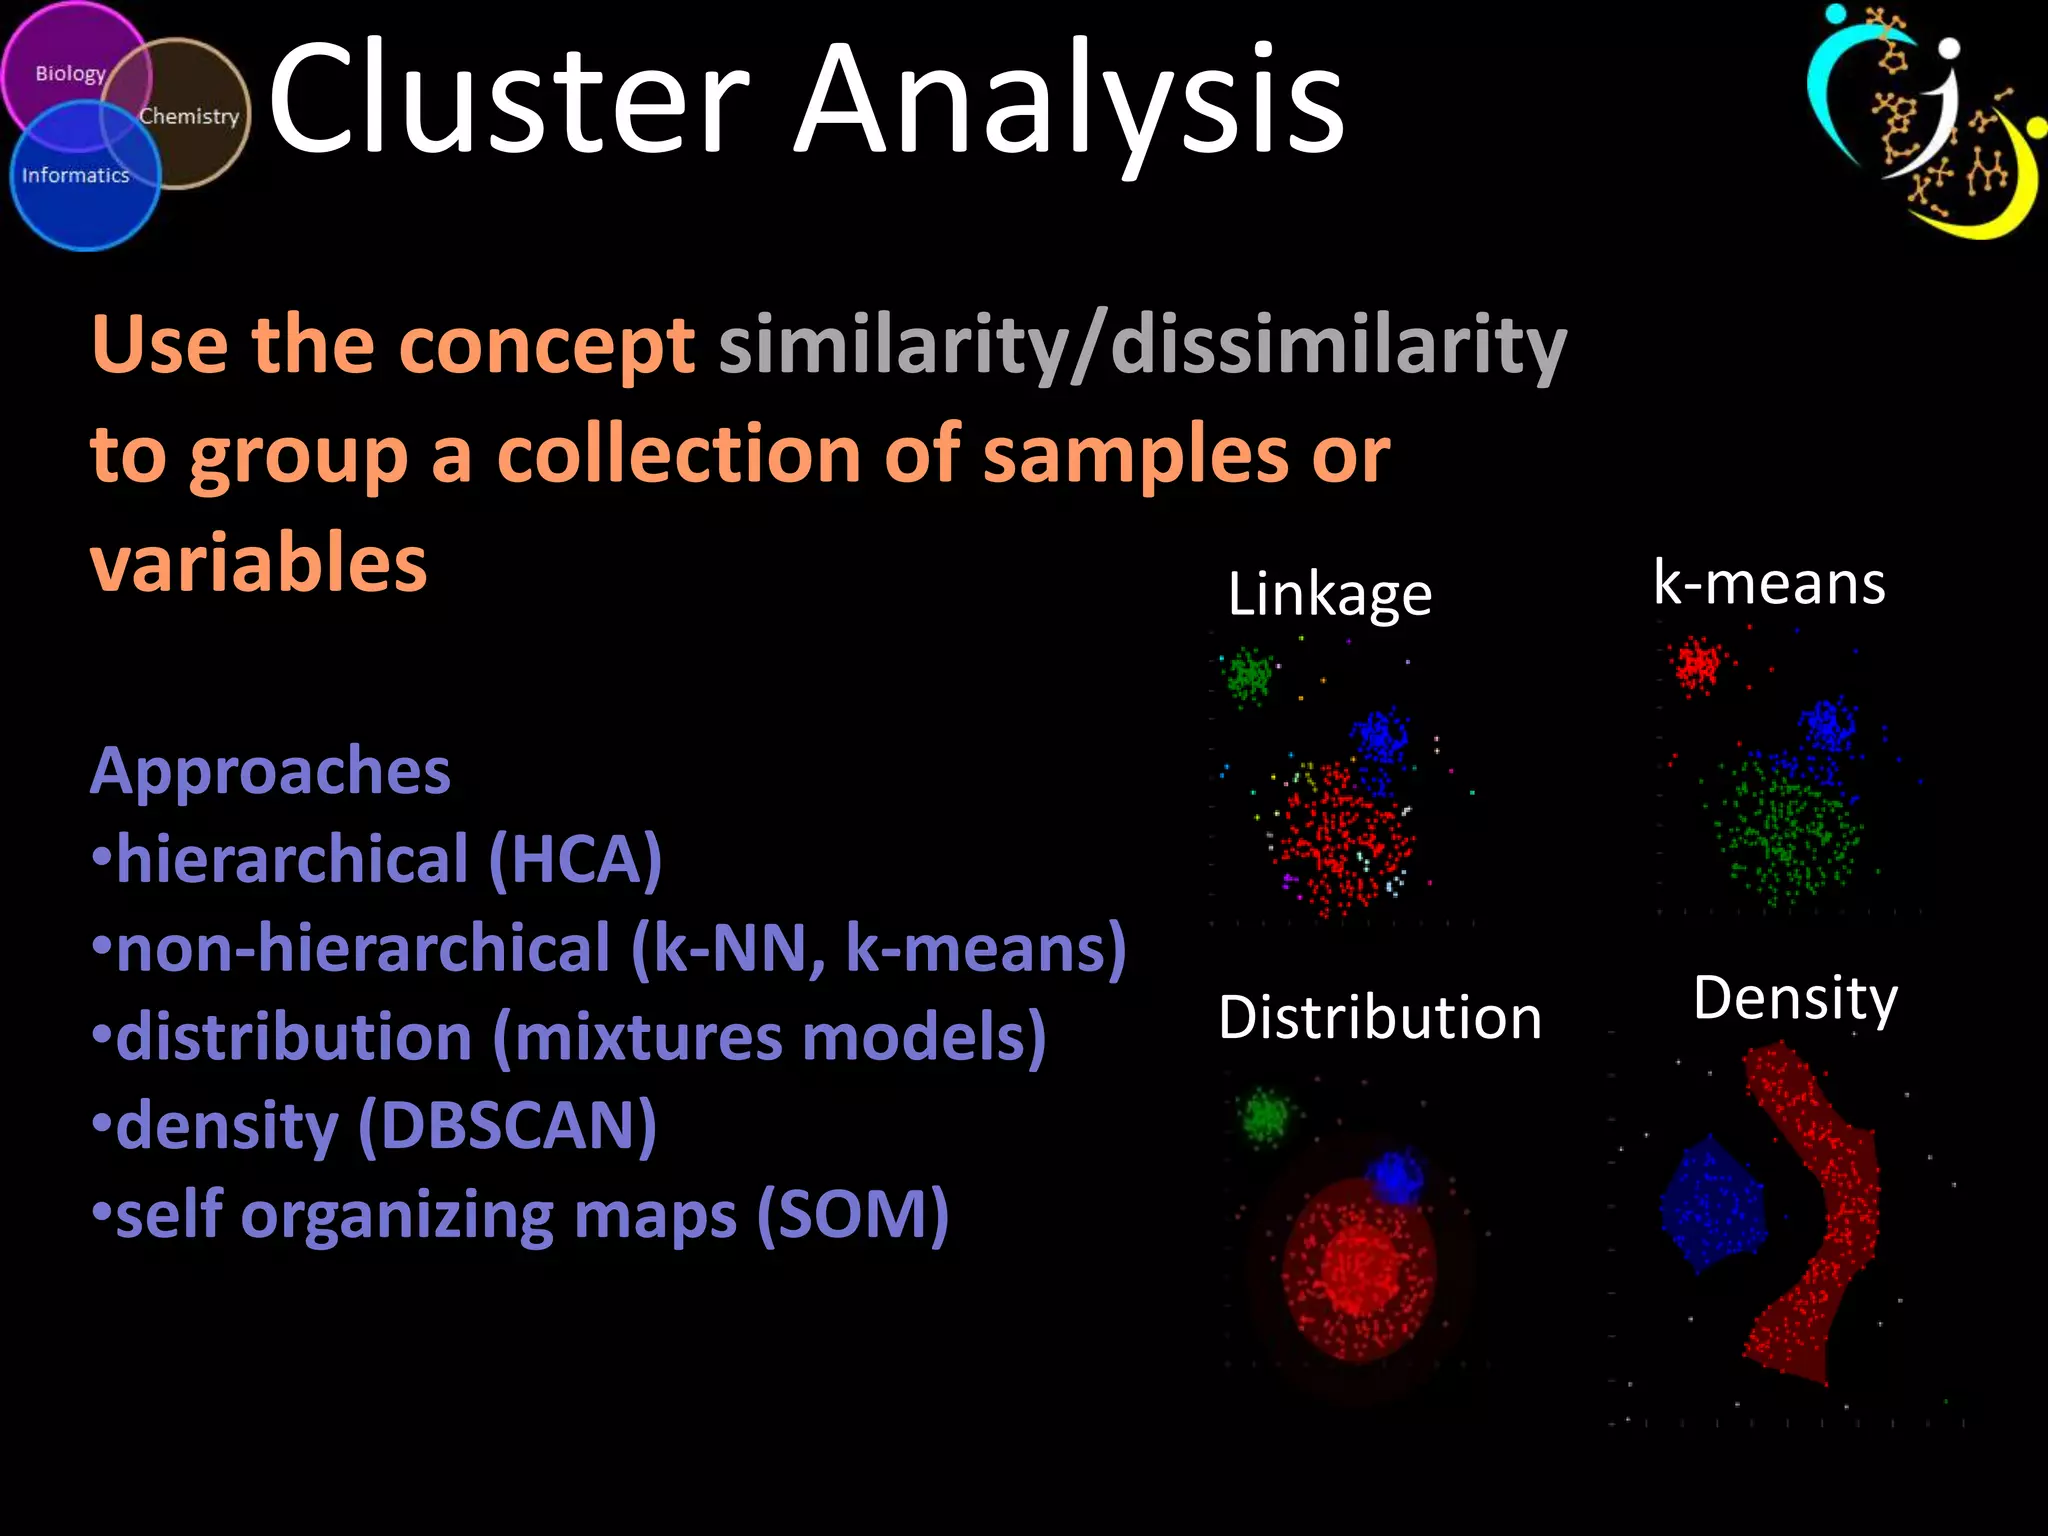
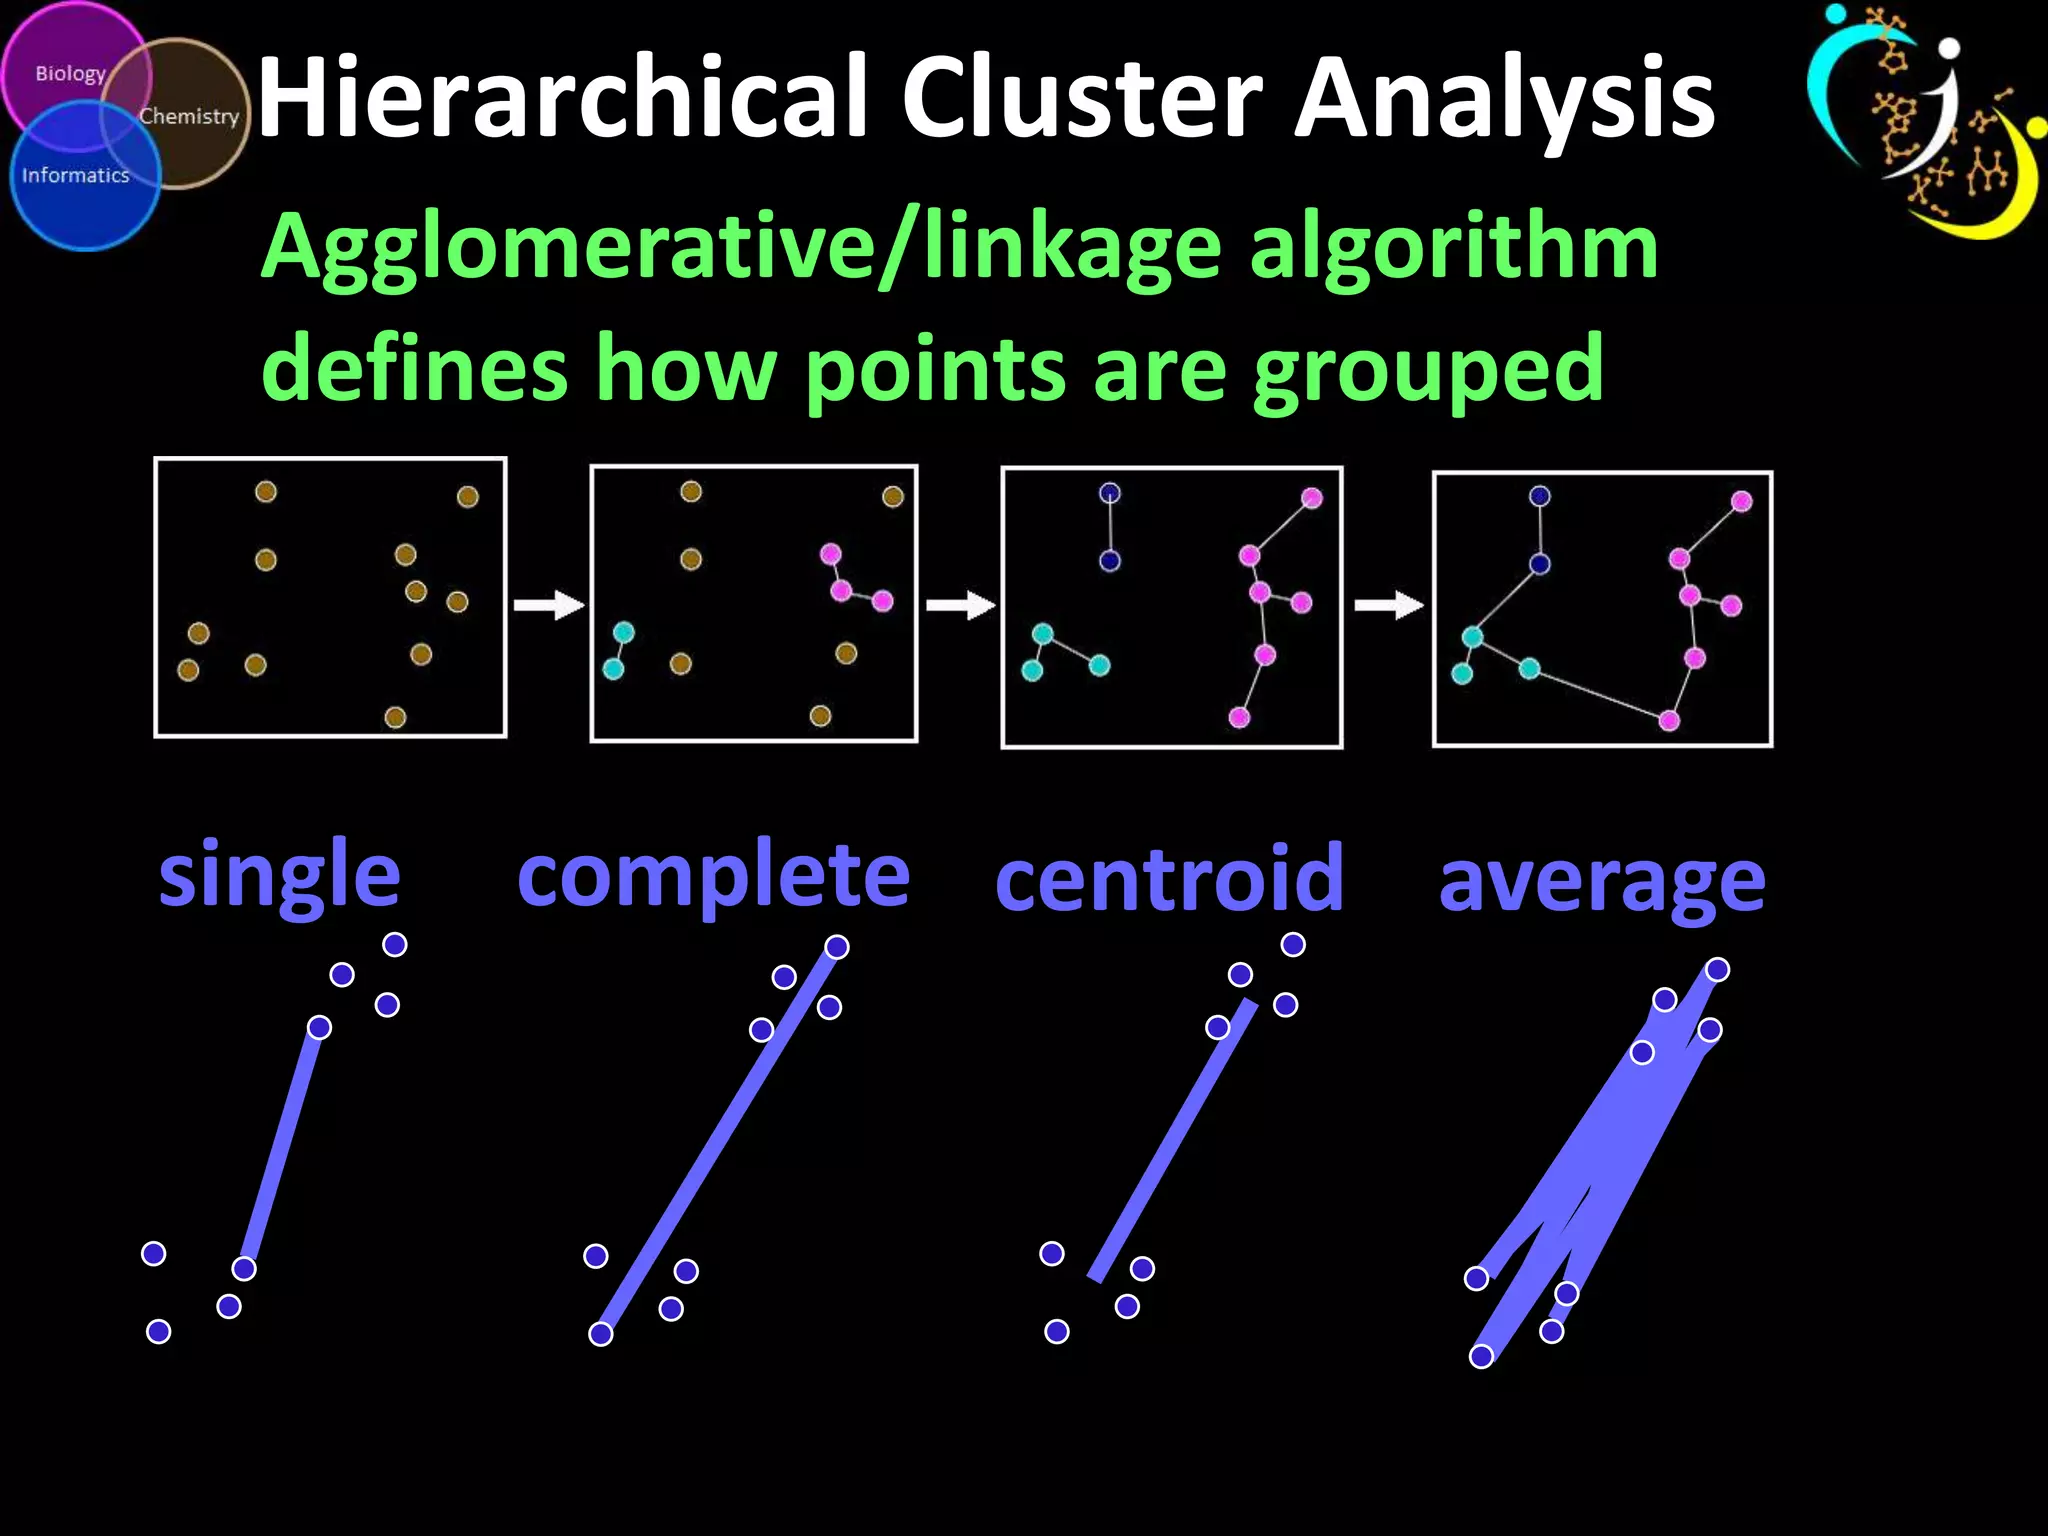
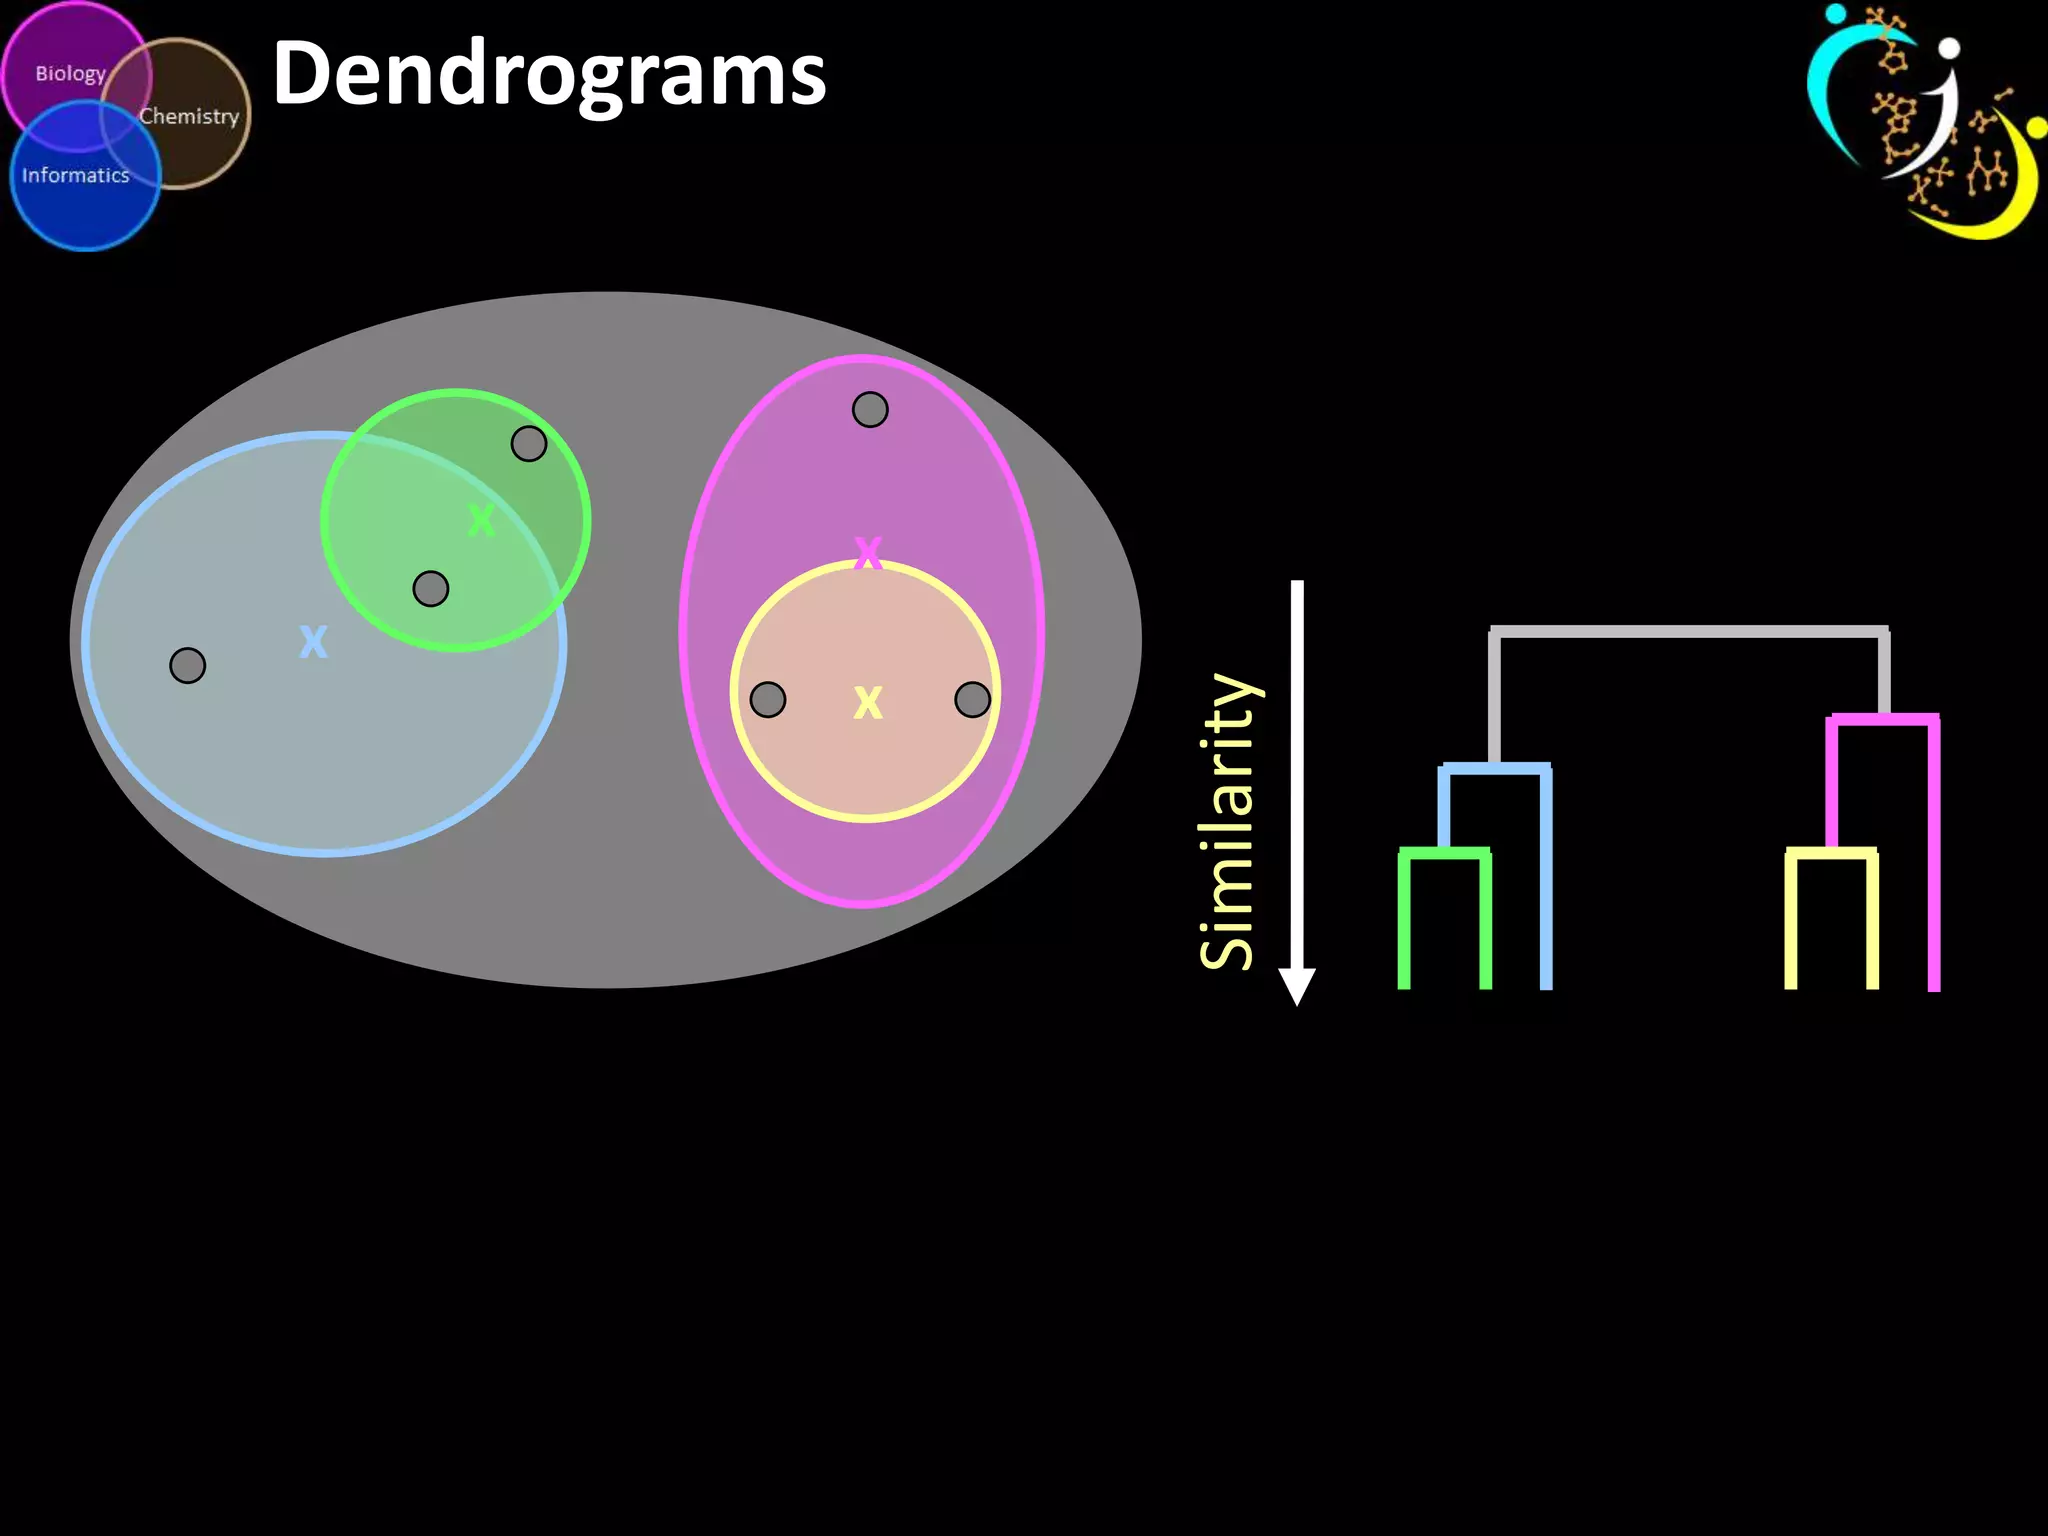
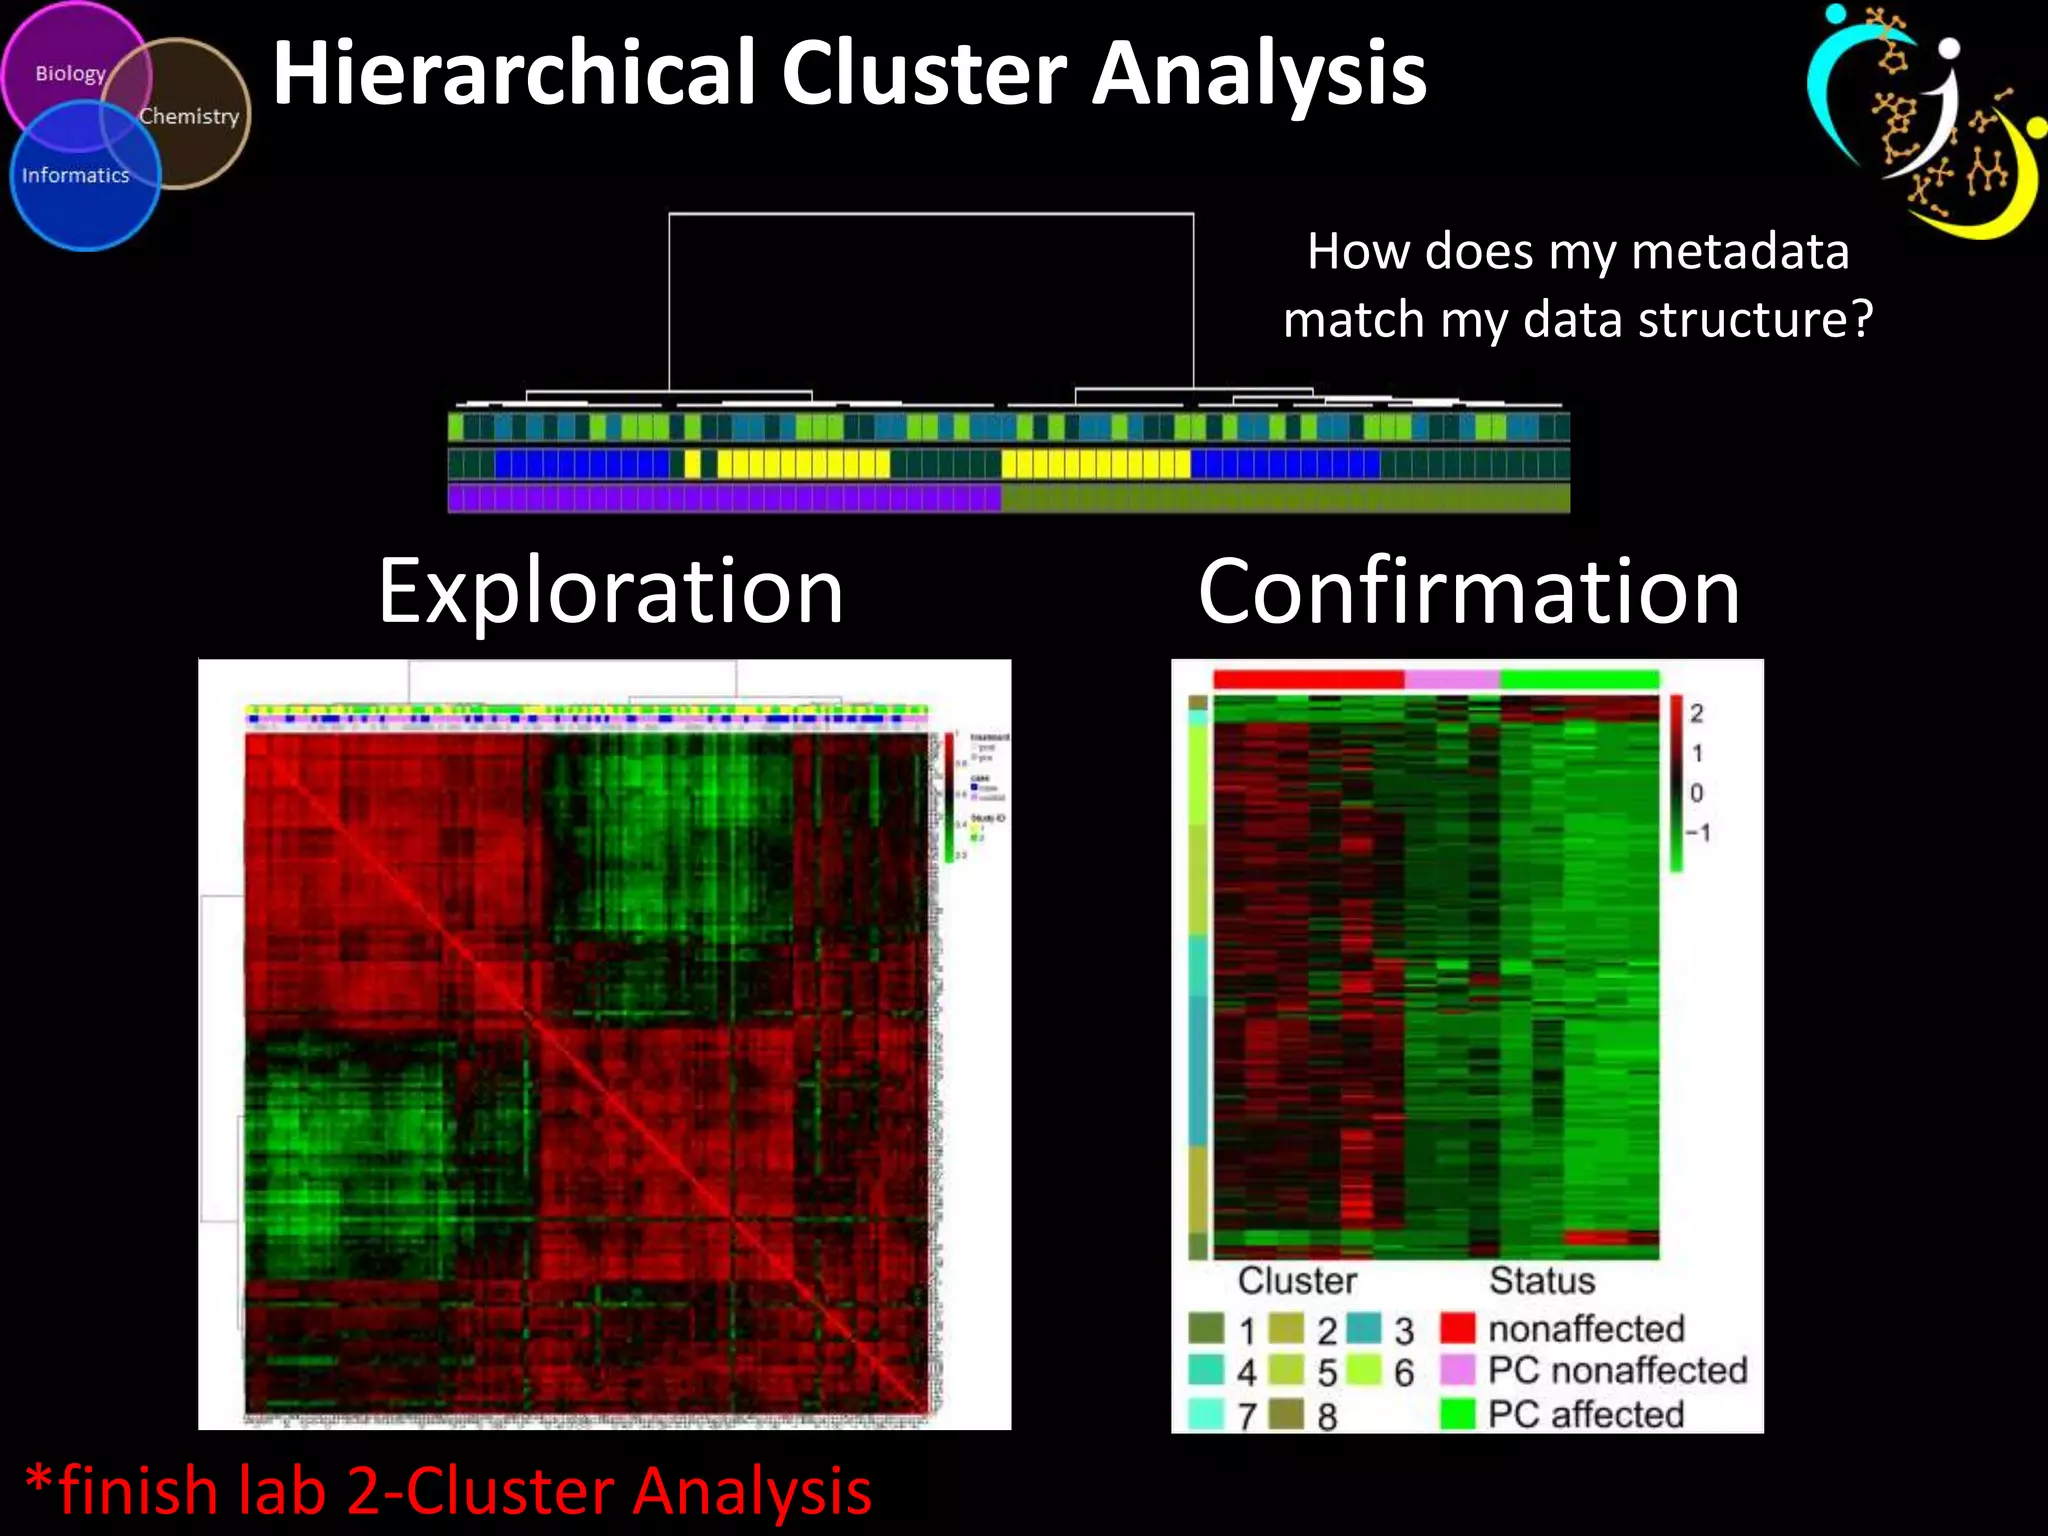
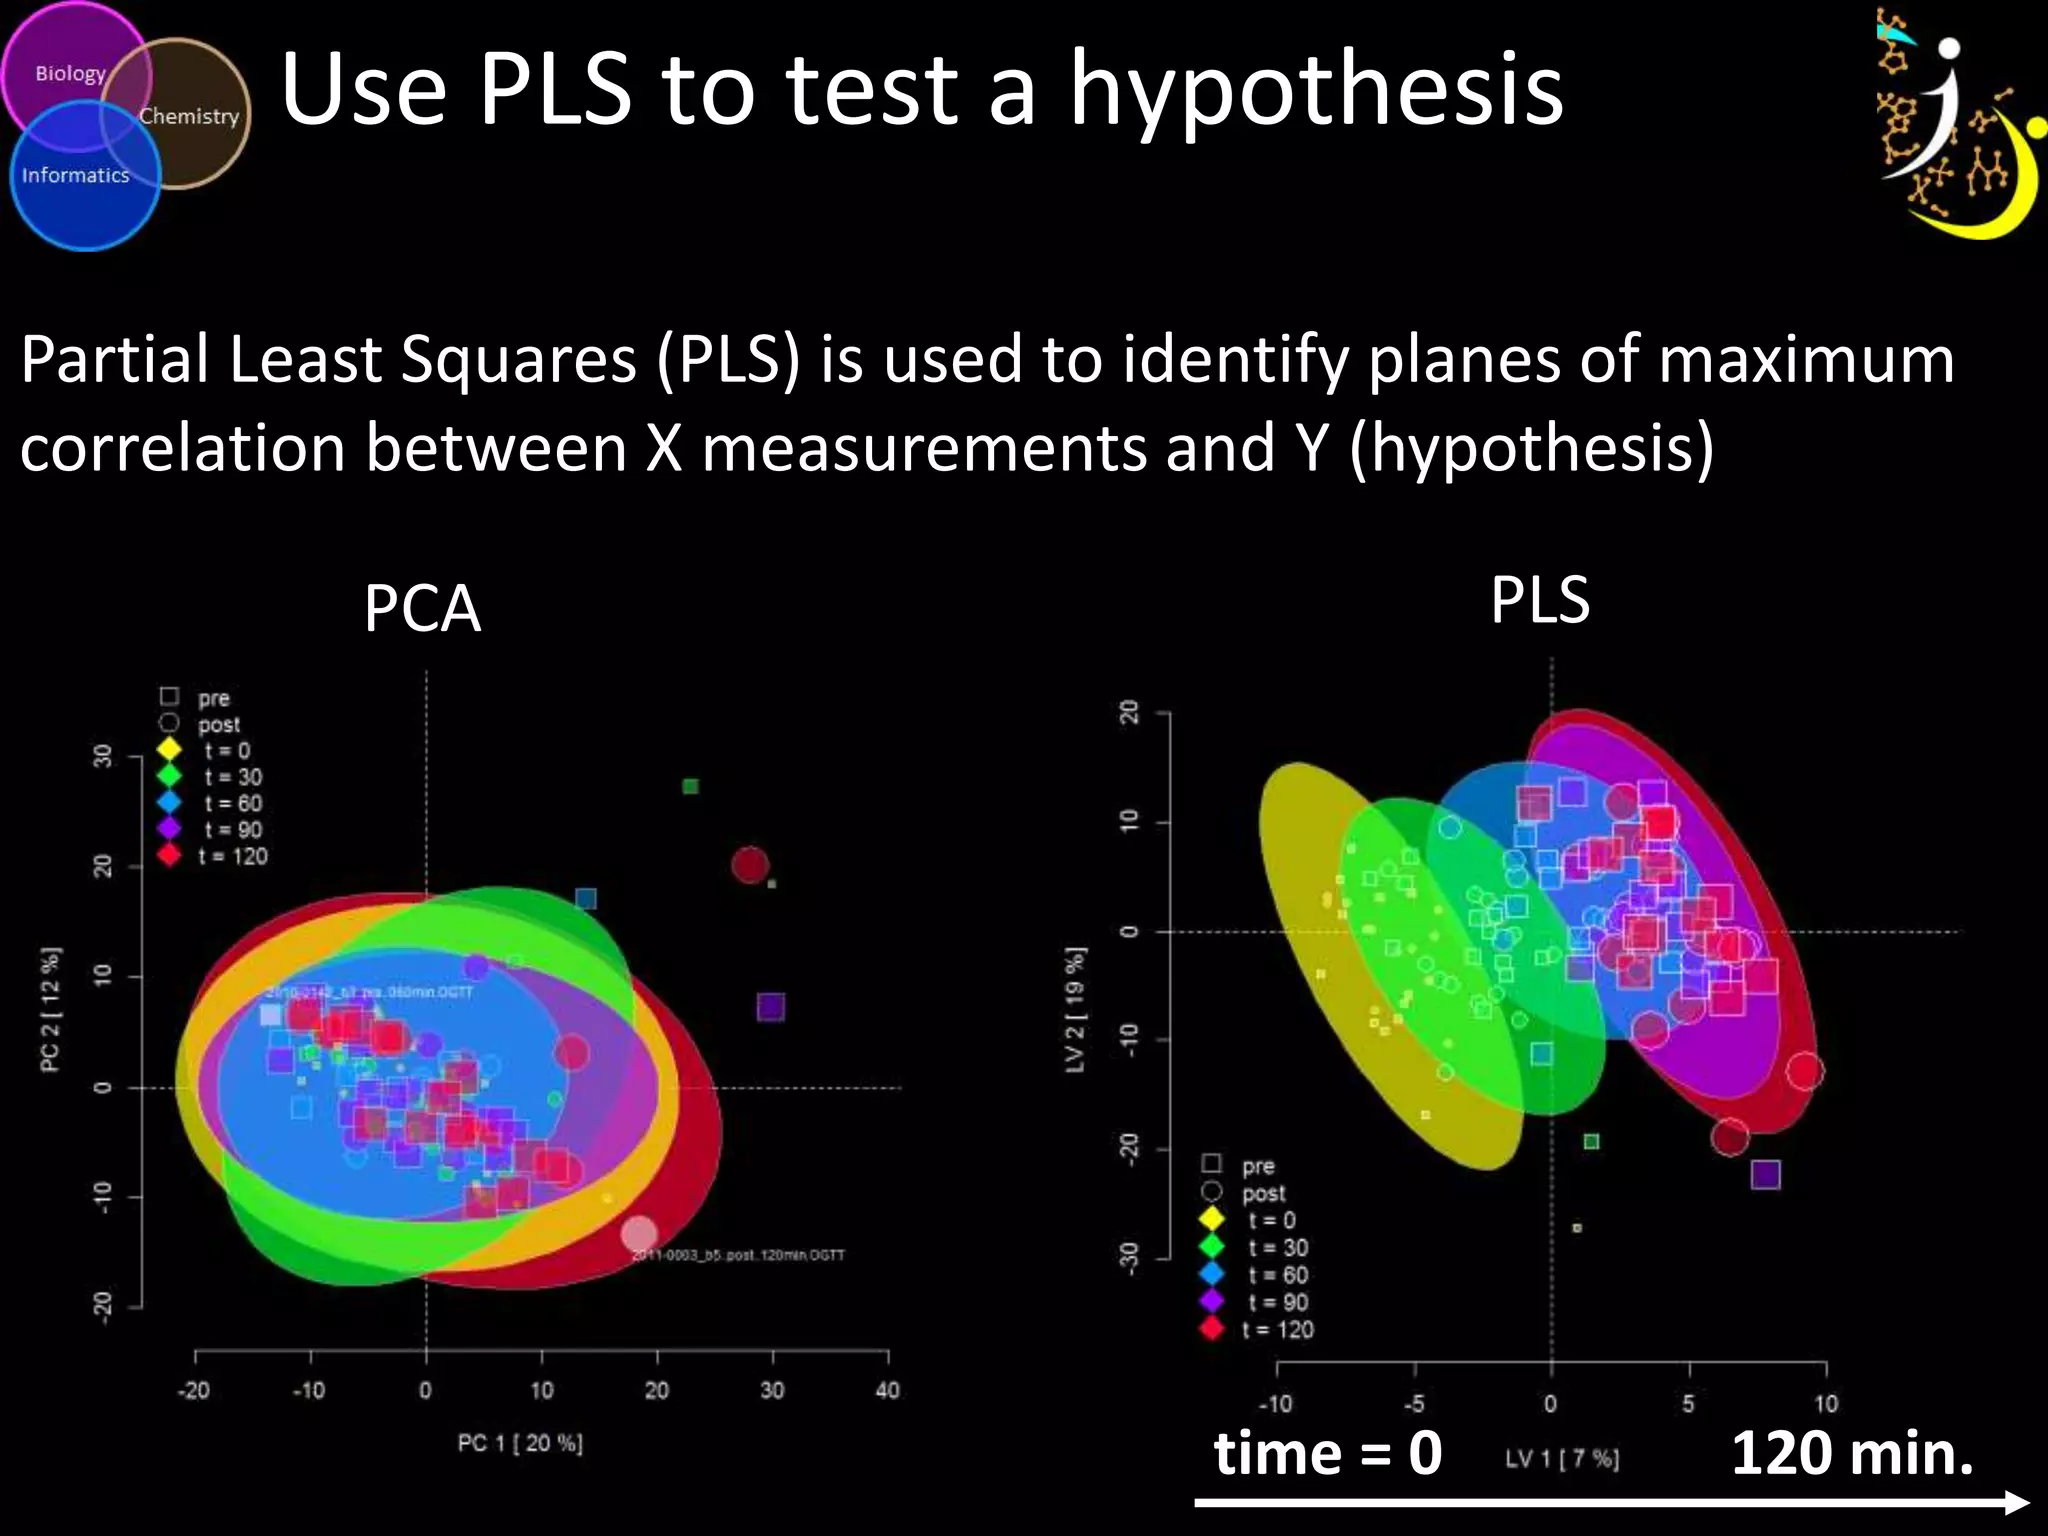
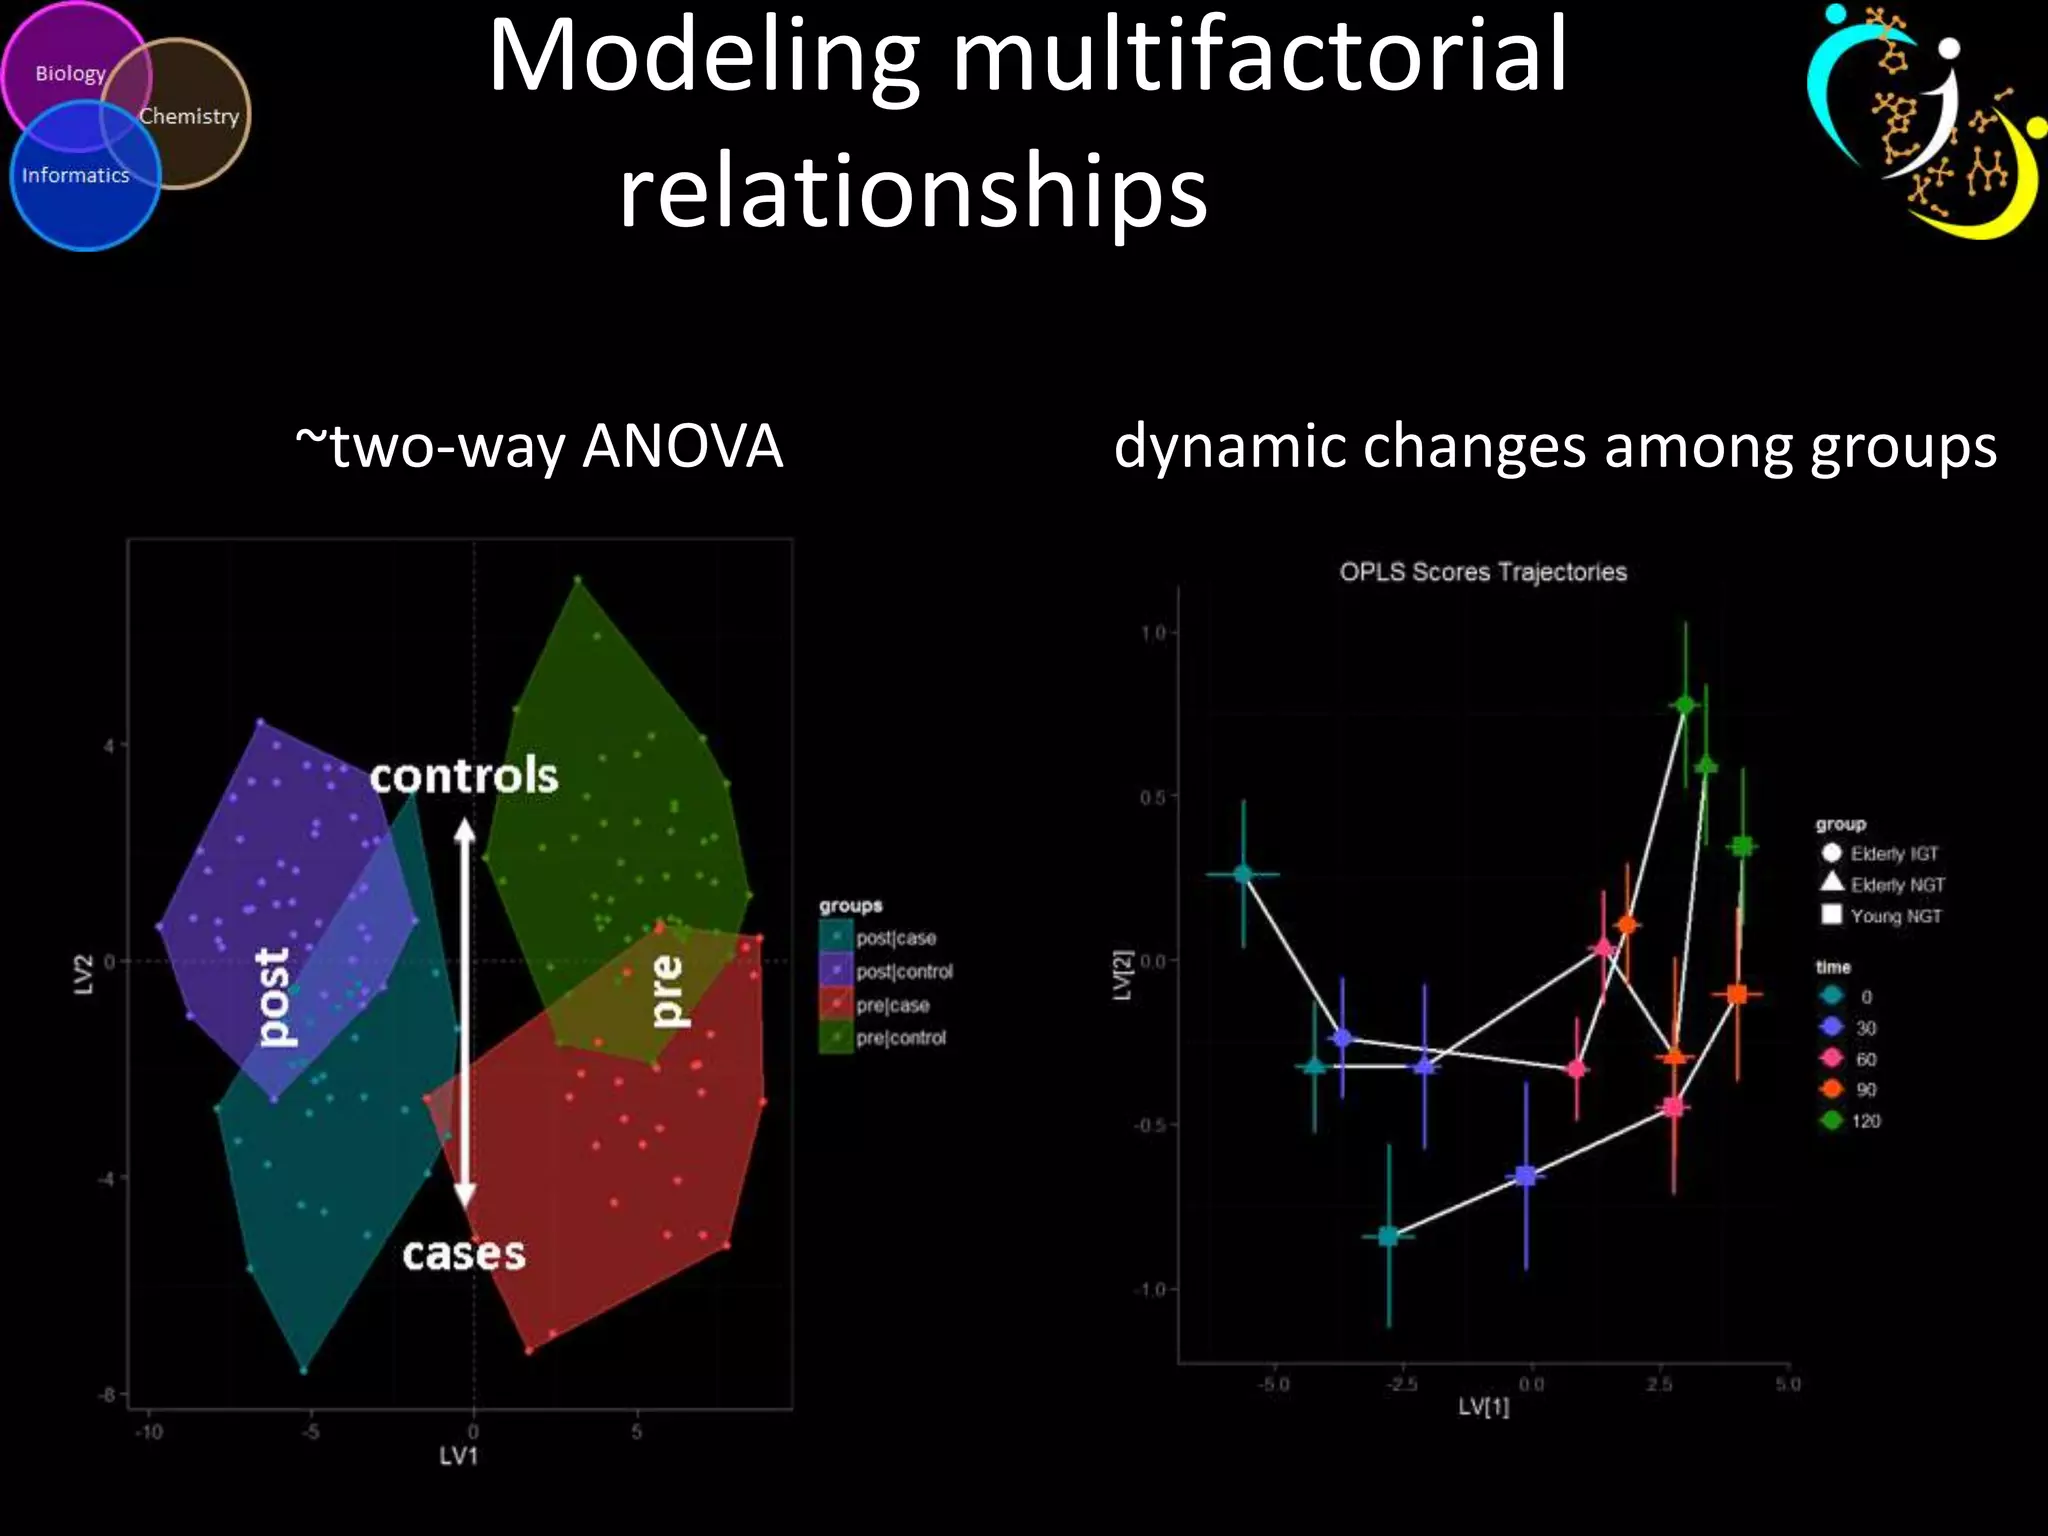
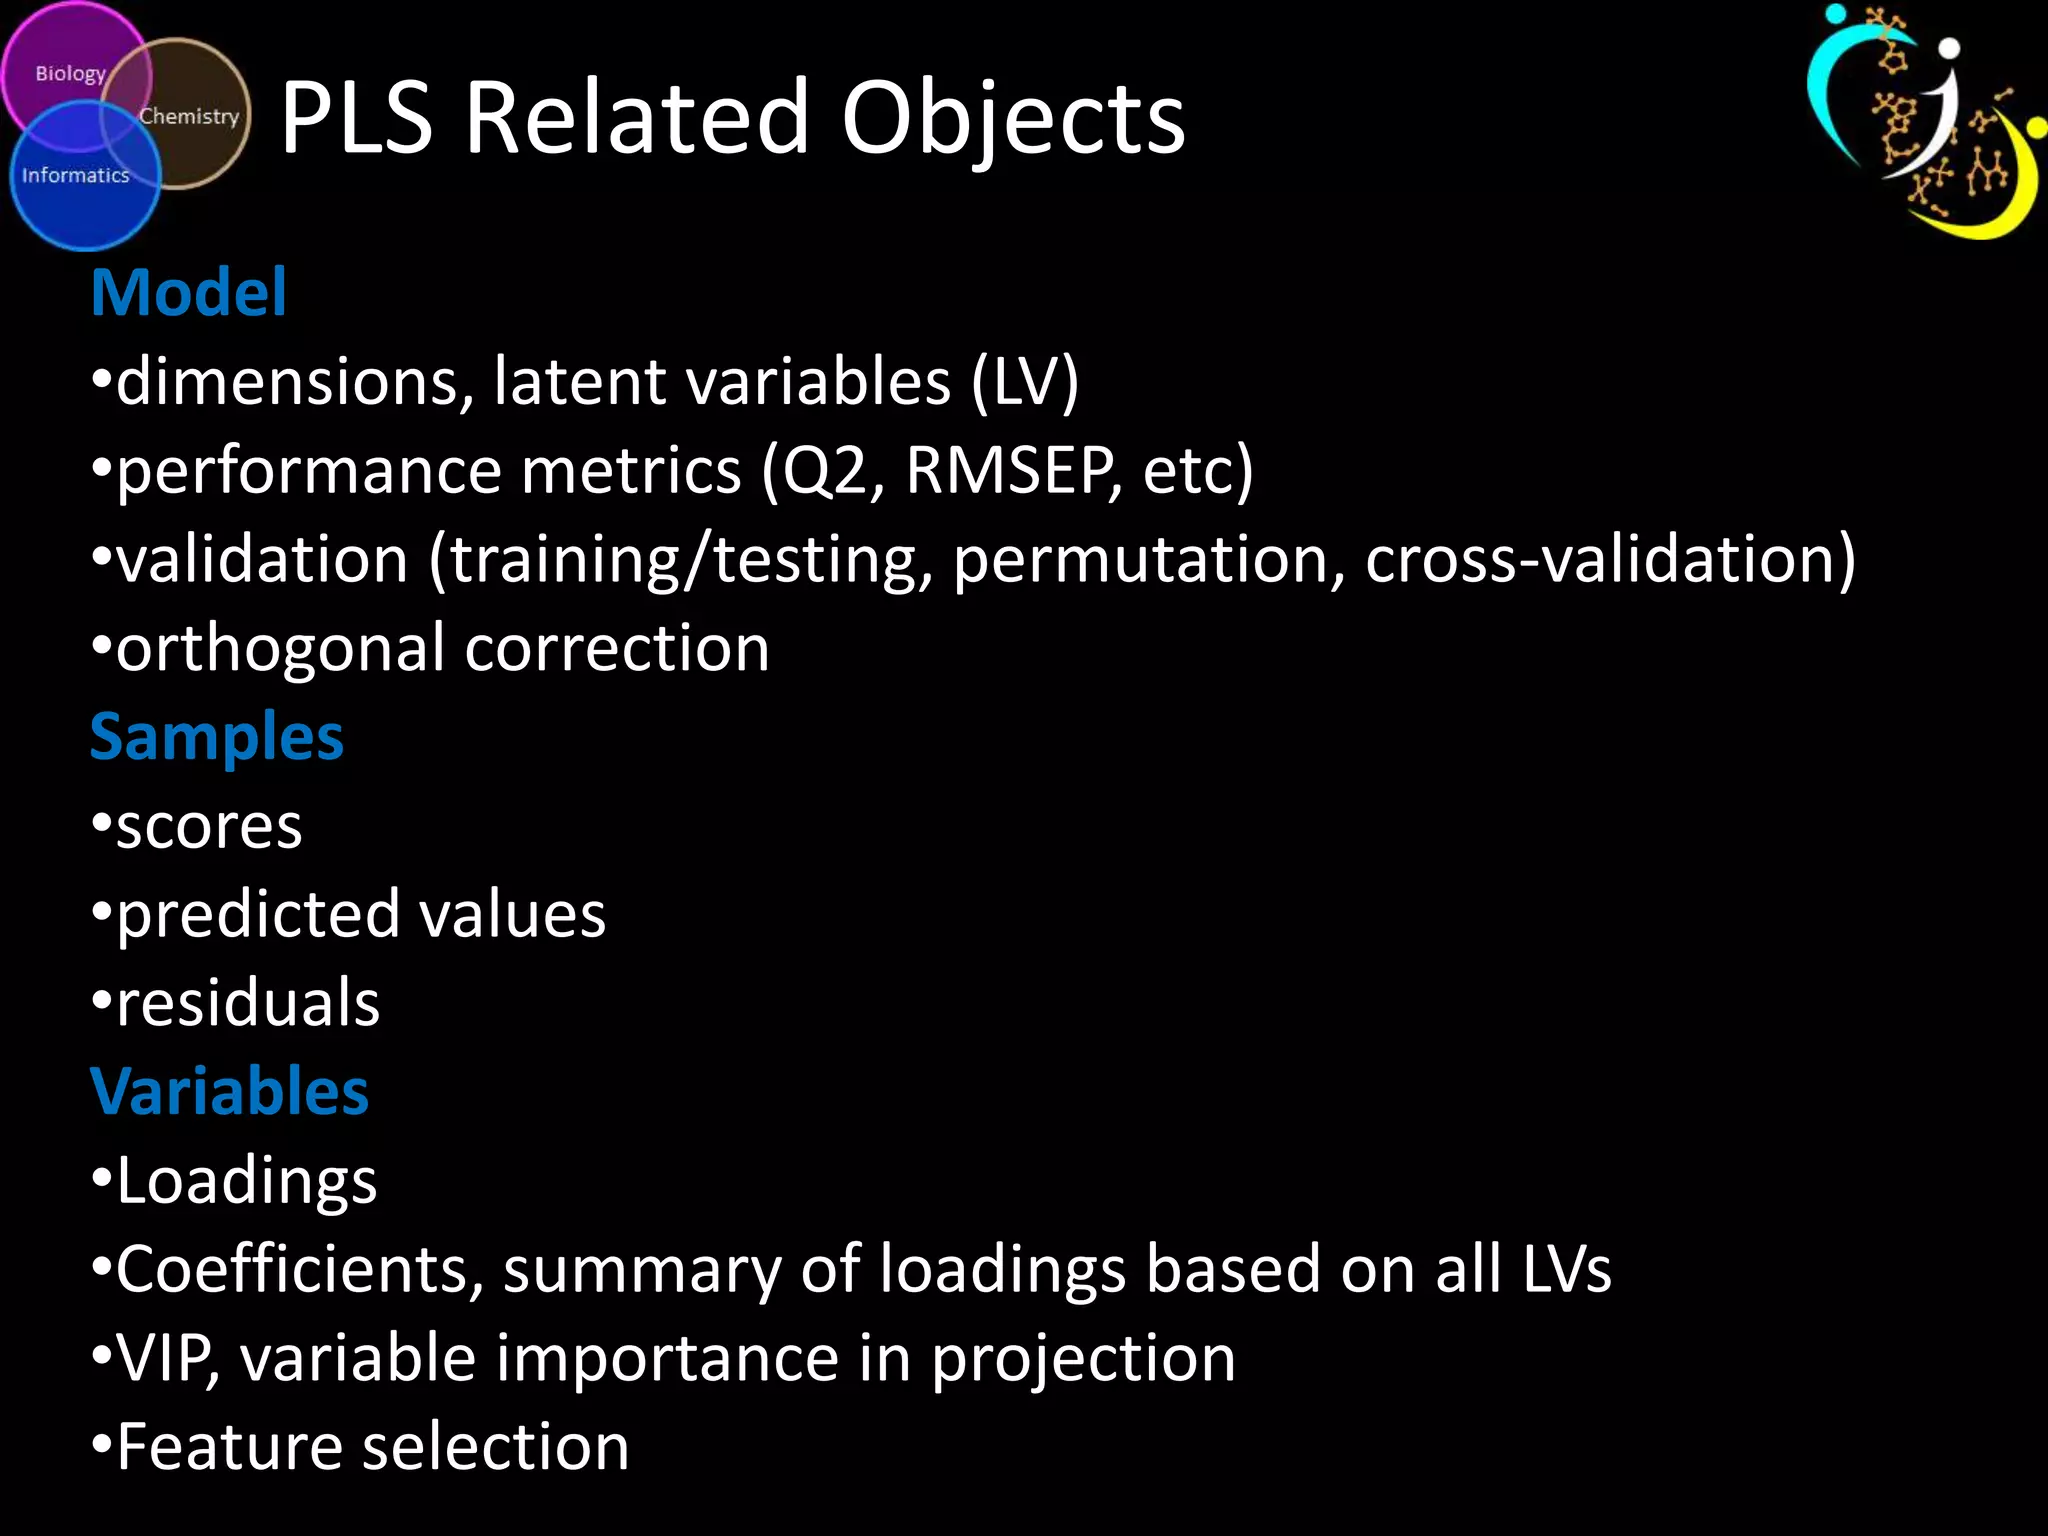
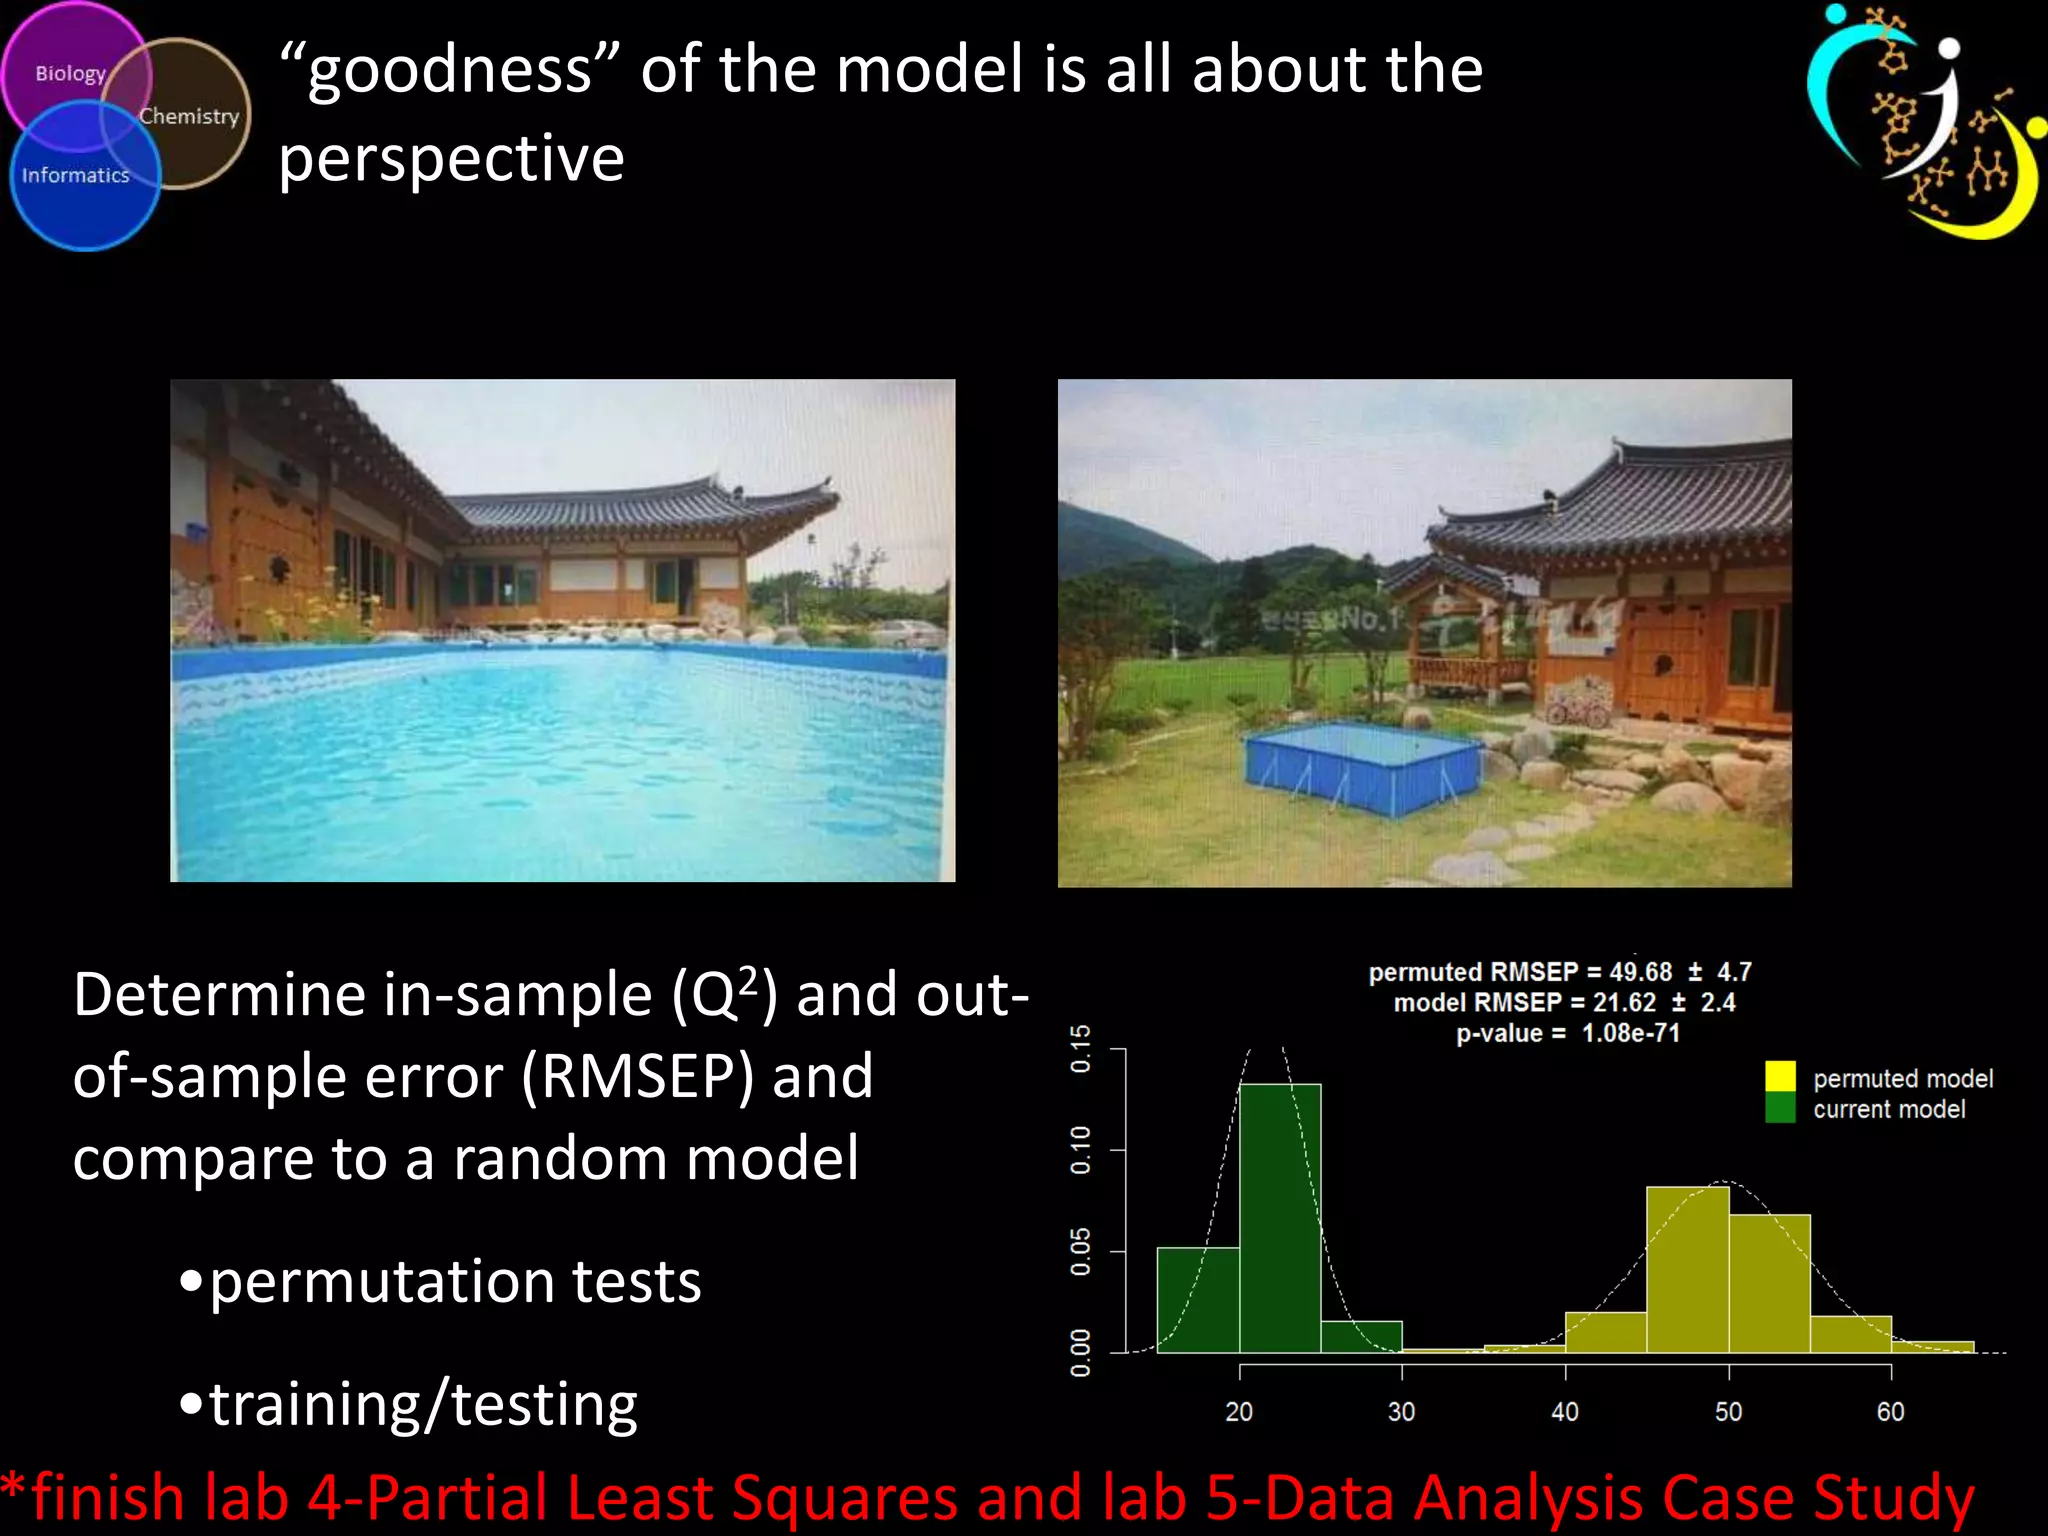
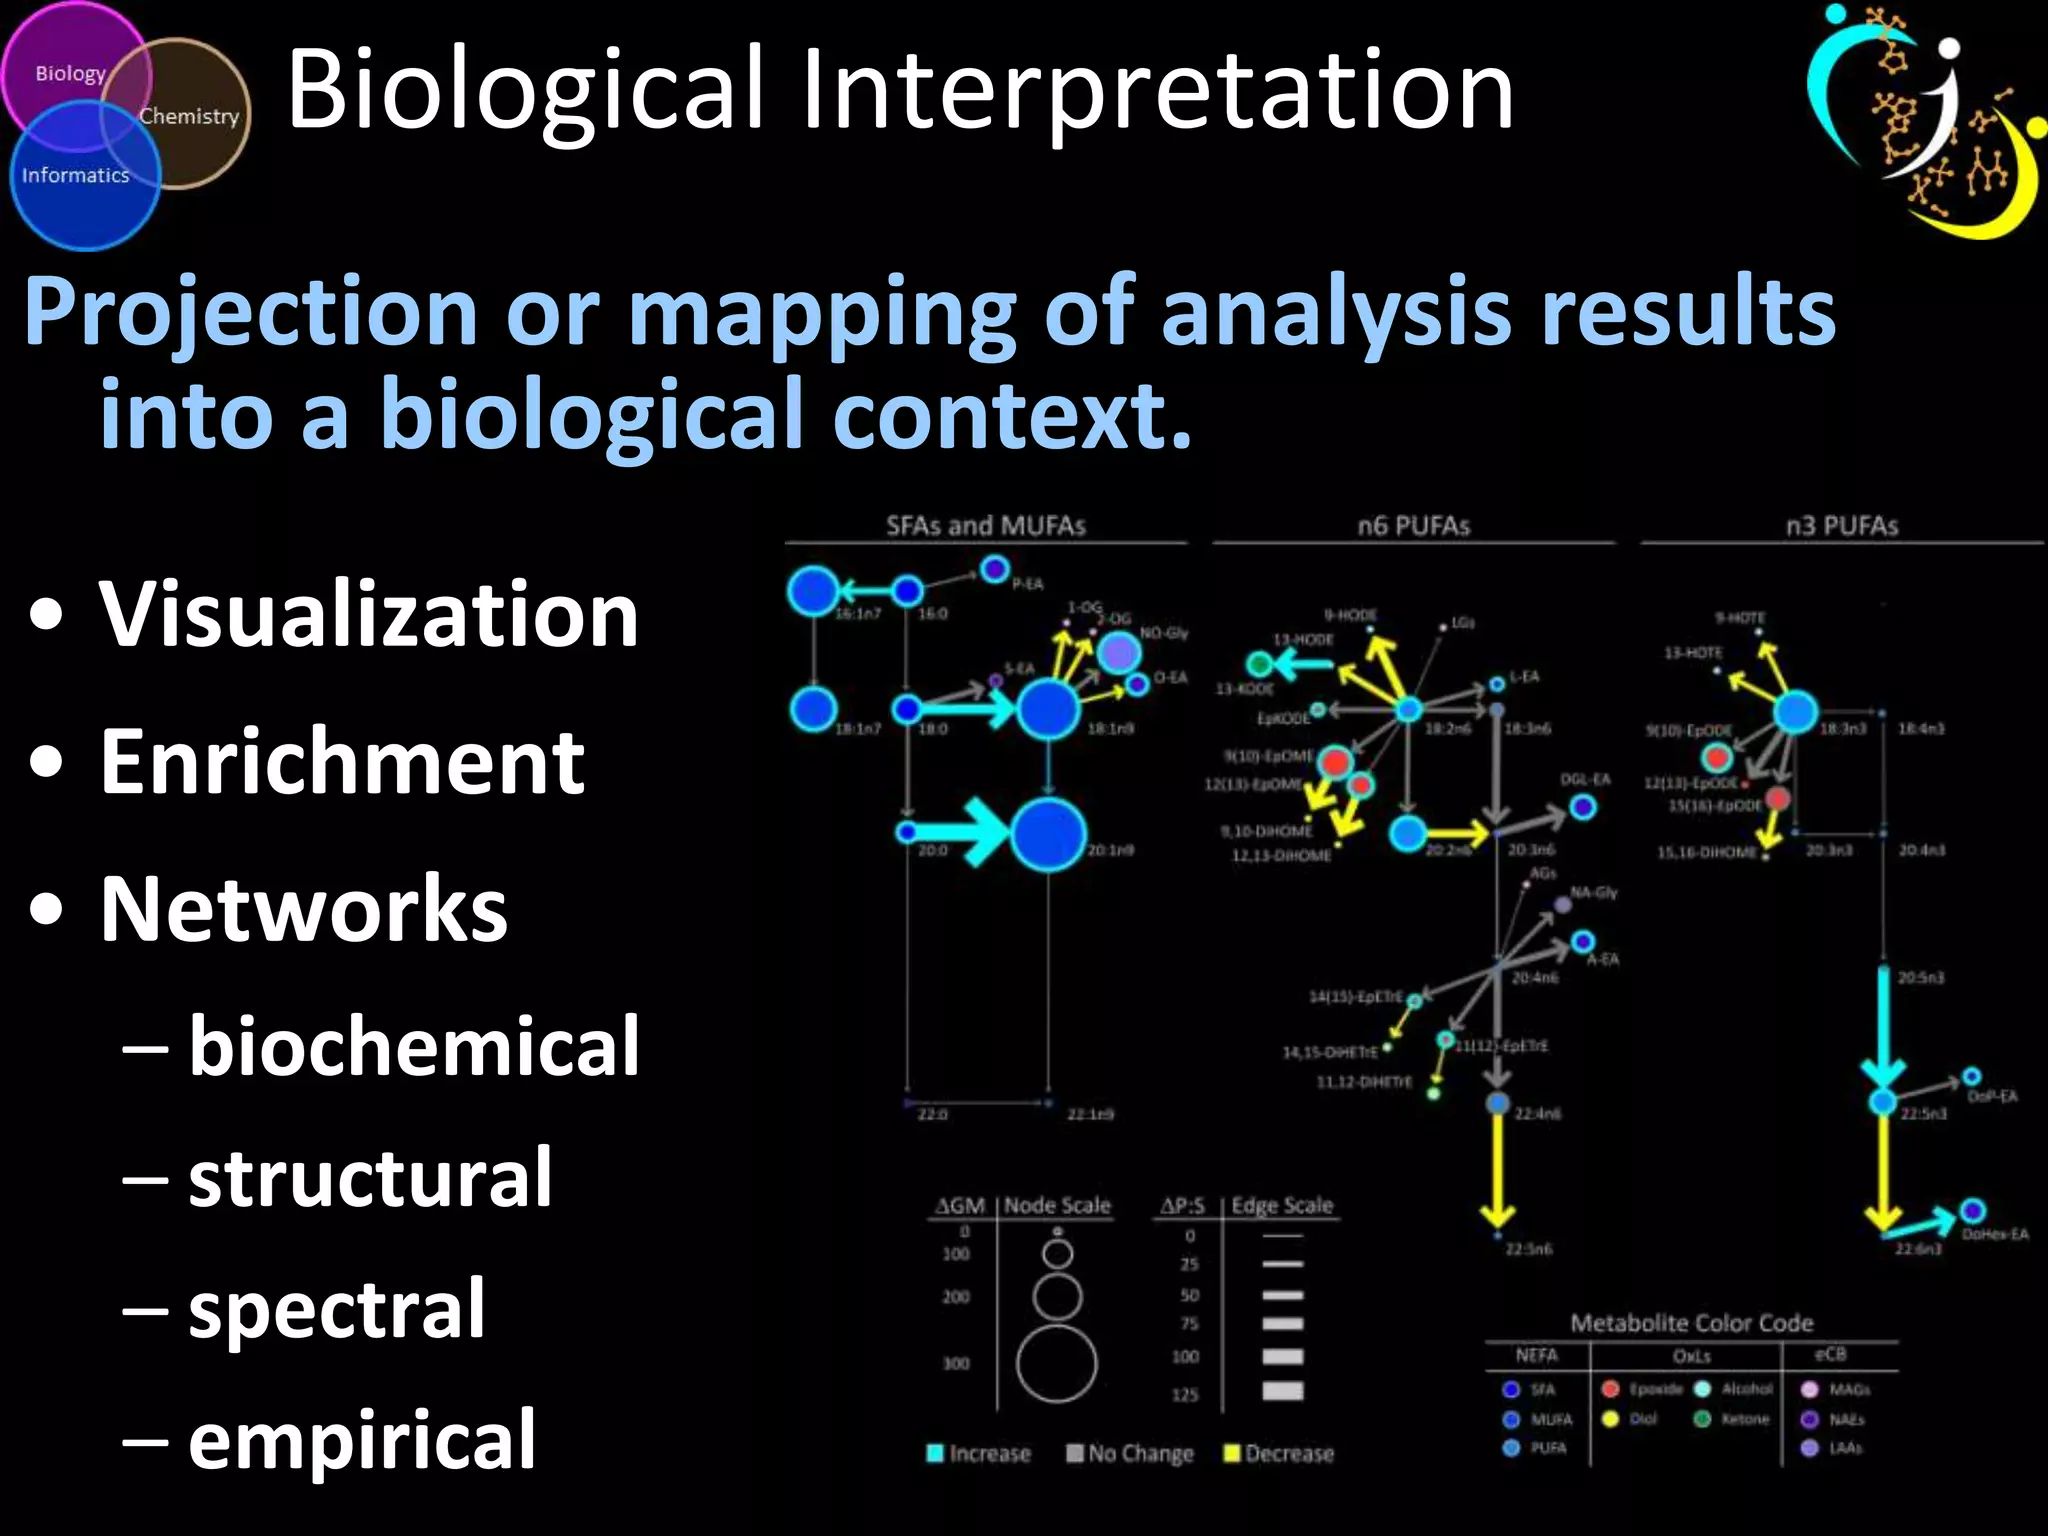
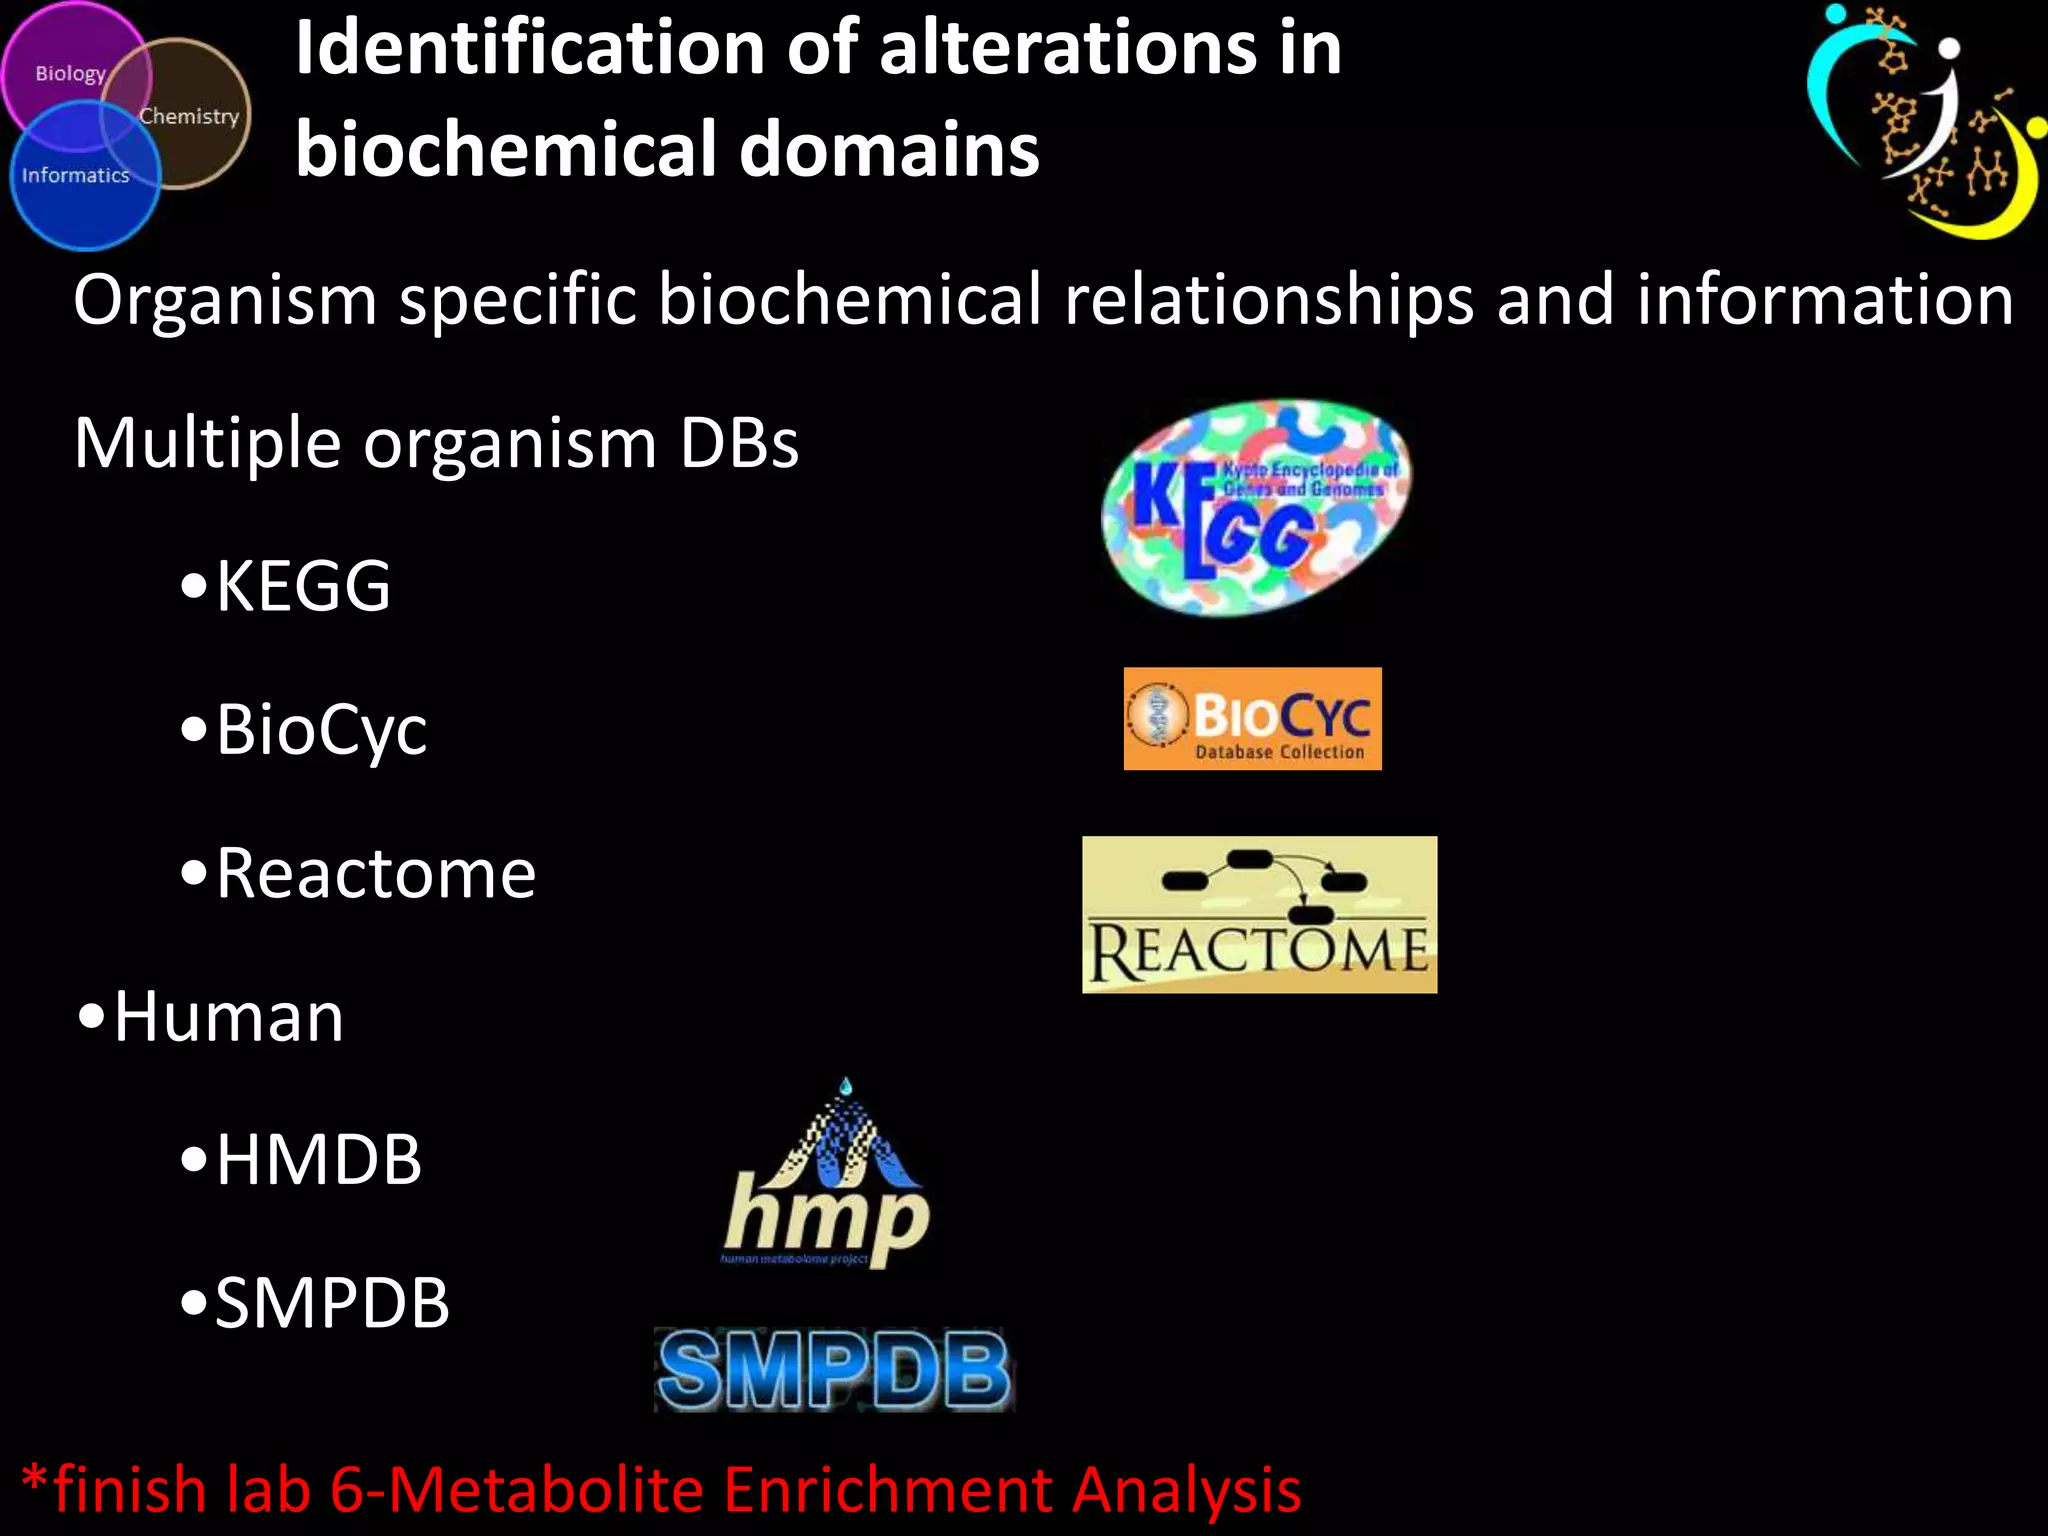
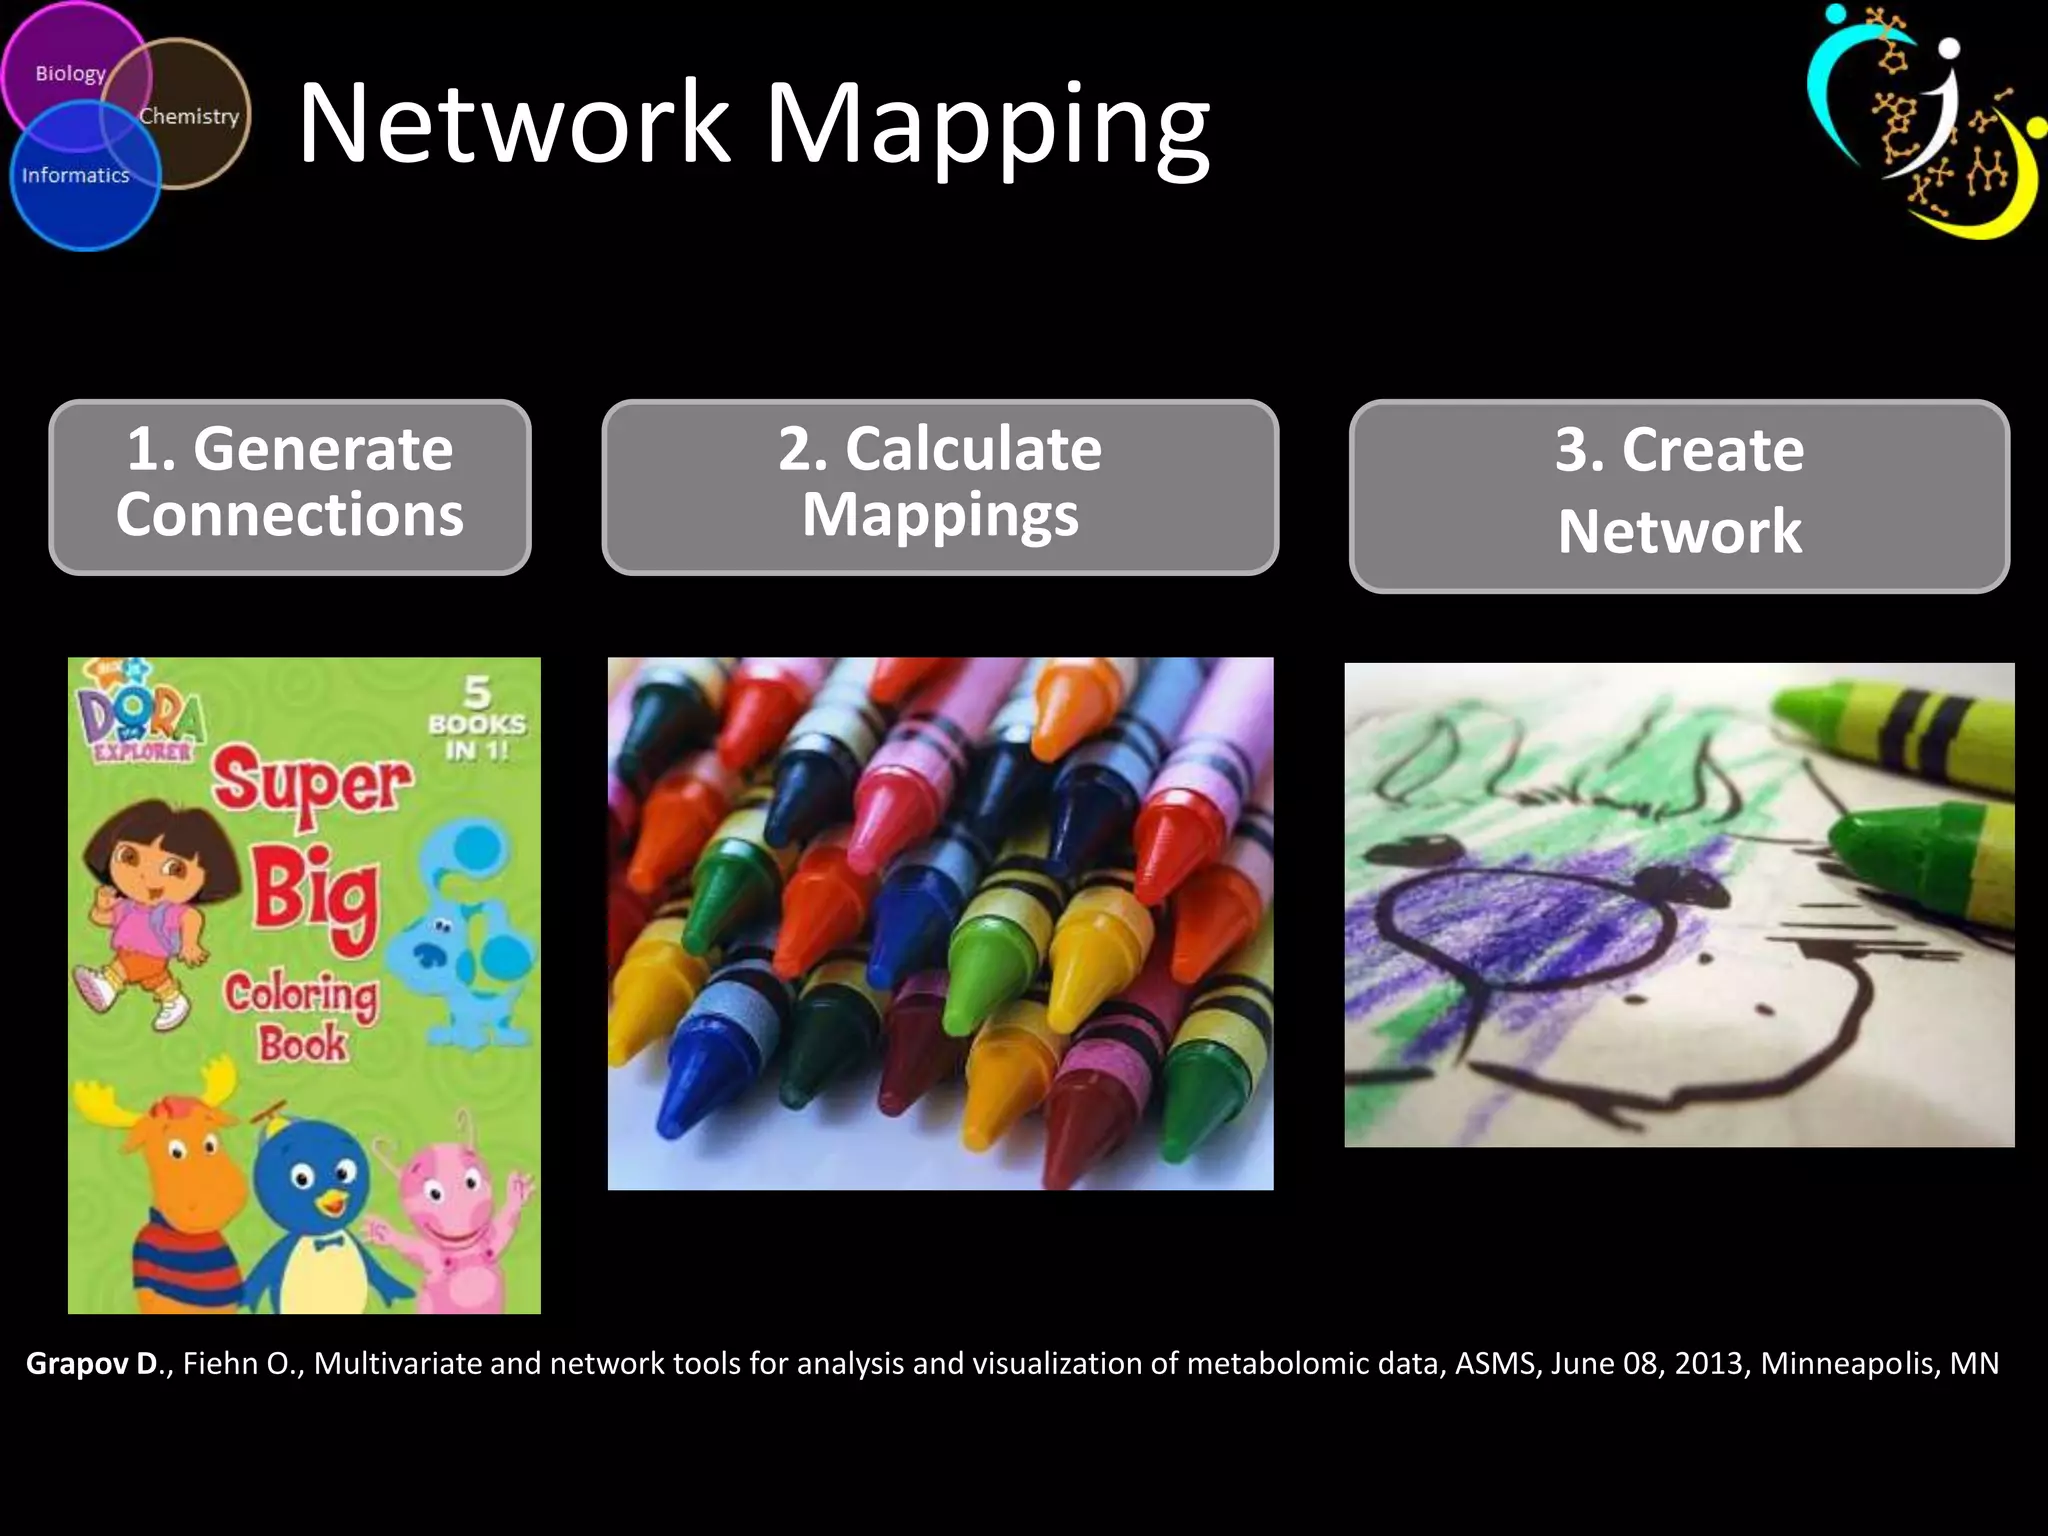
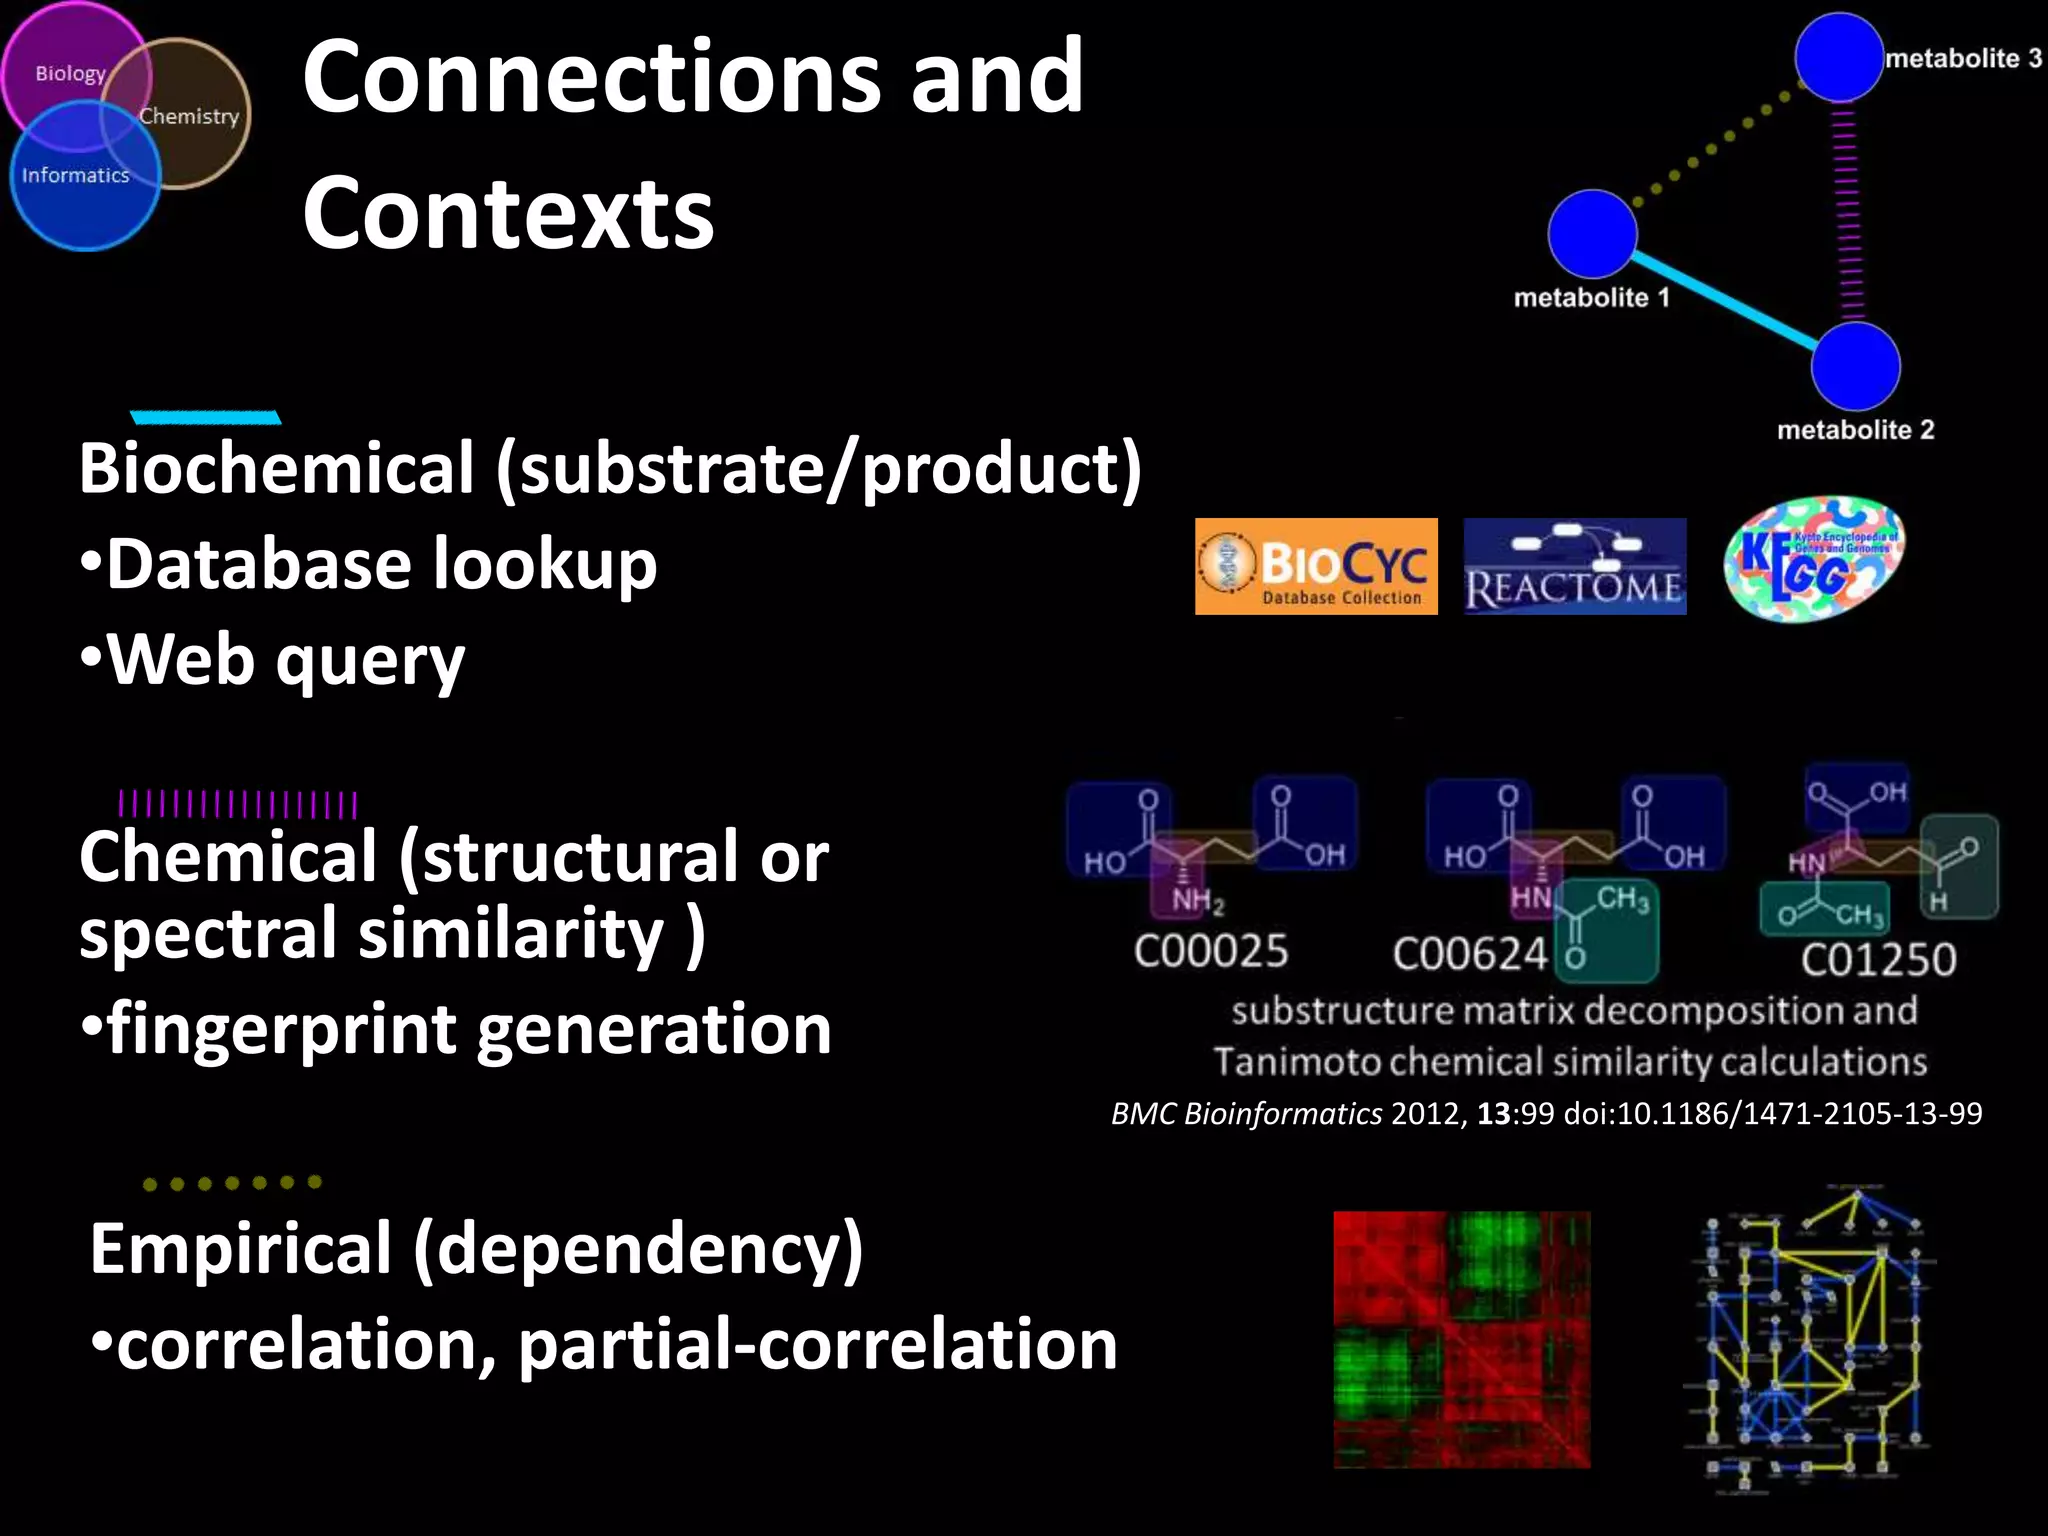
This document introduces a series of tutorials for metabolomic data analysis. It discusses important goals like hypothesis generation, data acquisition, processing, exploration, classification and prediction. It covers topics like univariate vs multivariate analysis, data quality metrics, clustering, principal component analysis, partial least squares modeling, and biological interpretation through metabolite enrichment and network mapping. The overall document provides a high-level overview of the key concepts and analytical approaches that will be covered in more detail in the tutorial series.
Data Normalization Approaches for Large-scale Biological StudiesDmitry Grapov
Overview of how to estimate data quality and validate normalization approaches to remove analytical variance.
See here for animations used in the presentation:
http://imdevsoftware.wordpress.com/2014/06/04/using-repeated-measures-to-remove-artifacts-from-longitudinal-data/
Metabolomic Data Analysis Workshop and Tutorials (2014)Dmitry Grapov
Get more information:
http://imdevsoftware.wordpress.com/2014/10/11/2014-metabolomic-data-analysis-and-visualization-workshop-and-tutorials/
Recently I had the pleasure of teaching statistical and multivariate data analysis and visualization at the annual Summer Sessions in Metabolomics 2014, organized by the NIH West Coast Metabolomics Center.
Similar to last year, I’ve posted all the content (lectures, labs and software) for any one to follow along with at their own pace. I also plan to release videos for all the lectures and labs.
Case Study: Overview of Metabolomic Data Normalization StrategiesDmitry Grapov
Five normalization methods were compared, of which the combination of qc-LOESS and cubic splines showed the best performance based on within-batch and between-batch variable relative standard deviations for QCs. This approach was used to normalize sample measurements the results of which were analyzed using principal components analysis.
Strategies for Metabolomics Data AnalysisDmitry Grapov
Part of a lectures series for the international summer course in metabolomics 2013 (http://metabolomics.ucdavis.edu/courses-and-seminars/courses). Get more material and information here (http://imdevsoftware.wordpress.com/2013/09/08/sessions-in-metabolomics-2013/).
Advanced strategies for Metabolomics Data AnalysisDmitry Grapov
Part of a lectures series for the international summer course in metabolomics 2013 (http://metabolomics.ucdavis.edu/courses-and-seminars/courses). Get more material and information here (http://imdevsoftware.wordpress.com/2013/09/08/sessions-in-metabolomics-2013/).
3 data normalization (2014 lab tutorial)Dmitry Grapov
Get more information:
http://imdevsoftware.wordpress.com/2014/10/11/2014-metabolomic-data-analysis-and-visualization-workshop-and-tutorials/
Recently I had the pleasure of teaching statistical and multivariate data analysis and visualization at the annual Summer Sessions in Metabolomics 2014, organized by the NIH West Coast Metabolomics Center.
Automation of (Biological) Data Analysis and Report GenerationDmitry Grapov
I've been experimenting with automating simple and complex data analysis and report generation tasks for biological data and mostly using R and LATEX. You can see some of my progress and challenges encountered.
Metabolomic data analysis and visualization toolsDmitry Grapov
A description of data analysis and visualization tools for metabolomic and other high dimensional data sets, developed at the NIH West Coast Metabolomics Center.
Prote-OMIC Data Analysis and VisualizationDmitry Grapov
Introductory lecture to multivariate analysis of proteomic data.
Material from the UC Davis 2014 Proteomics Workshop.
See more at: http://sourceforge.net/projects/teachingdemos/files/2014%20UC%20Davis%20Proteomics%20Workshop/
Part of a lectures series for the international summer course in metabolomics 2013 (http://metabolomics.ucdavis.edu/courses-and-seminars/courses). Get more material and information here (http://imdevsoftware.wordpress.com/2013/09/08/sessions-in-metabolomics-2013/).
Advanced strategies for Metabolomics Data AnalysisDmitry Grapov
Part of a lectures series for the international summer course in metabolomics 2013 (http://metabolomics.ucdavis.edu/courses-and-seminars/courses). Get more material and information here (http://imdevsoftware.wordpress.com/2013/09/08/sessions-in-metabolomics-2013/).
3 data normalization (2014 lab tutorial)Dmitry Grapov
Get more information:
http://imdevsoftware.wordpress.com/2014/10/11/2014-metabolomic-data-analysis-and-visualization-workshop-and-tutorials/
Recently I had the pleasure of teaching statistical and multivariate data analysis and visualization at the annual Summer Sessions in Metabolomics 2014, organized by the NIH West Coast Metabolomics Center.
Automation of (Biological) Data Analysis and Report GenerationDmitry Grapov
I've been experimenting with automating simple and complex data analysis and report generation tasks for biological data and mostly using R and LATEX. You can see some of my progress and challenges encountered.
Metabolomic data analysis and visualization toolsDmitry Grapov
A description of data analysis and visualization tools for metabolomic and other high dimensional data sets, developed at the NIH West Coast Metabolomics Center.
Prote-OMIC Data Analysis and VisualizationDmitry Grapov
Introductory lecture to multivariate analysis of proteomic data.
Material from the UC Davis 2014 Proteomics Workshop.
See more at: http://sourceforge.net/projects/teachingdemos/files/2014%20UC%20Davis%20Proteomics%20Workshop/
Review of "Survey Research Methods & Design in Psychology"James Neill
Reviews the 150 hour, third year psychology unit which examined survey research methods, with an emphasis on the second-half of the unit on MLR, ANOVA, power, and effect size.
Invited lecture on Machine Learning in Medicine at the joint "Integrated Omics" course of Hanze University and University Hospital UMCG, Groningen, The Netherlands
Factor Analysis and Correspondence Analysis Composite and Indicator Scores of...Matthew Powers
Demonstration of two methods of translating ordinal Likert variables into indicator scores that are appropriate for data visualization and statistical analysis.
An introduction to variable and feature selectionMarco Meoni
Presentation of a great paper from Isabelle Guyon (Clopinet) and André Elisseeff (Max Planck Institute) back in 2003, which outlines the main techniques for feature selection and model validation in machine learning systems
Learning Probabilistic Relational Models using Non-Negative Matrix FactorizationAnthony Coutant
Probabilistic Relational Models (PRMs) are directed probabilisticgraphical models representing a factored joint distribution over a set of random variables for relational datasets.
While regular PRMs define probabilistic dependencies between classes’ descriptive attributes, an extension called PRM with Reference Uncertainty (PRM-RU) allows in addition to manage link uncertainty between them, by adding random variables called selectors. In order to avoid variables with large domains, selectors are associated with partition functions, mapping objects to a set of clusters, and selectors’ distributions are defined over the set of clusters.
In PRM-RU, the definition of partition functions constrains us to learn them only from concerned individuals entity attributes and to assign the same cluster to a pair of individuals having the same attributes values. This constraint is actually based on a strong assumption which is not generalizable and can lead to an under usage of relationship data for learning. For these reasons, we relax this constraint in this paper and propose a different partition function learning approach based on relationship
data clustering. We empirically show that this approach provides better results than attribute-based learning in the case where relationship topology is independent from involved entity attributes values, and that it gives close results whenever the attributes assumption is correct.
The use of data and its modelling in science provides meaningful interpretation of real world problems. This presentation provides an easy to understand overview of data visualization and analytics , and snippets of data science applications using R - programming.
Full course: https://creativedatasolutions.github.io/CDS.courses/courses/network_mapping_101/docs/
The course covered all of the steps required to go from `raw data` to a rich `mapped biochemical network` incorporating statistical, multivariate and machine learning results. This included [examples](https://creativedatasolutions.github.io/CDS.courses/courses/network_mapping_101/docs/#topics) and tutorials for:
* Preparing raw data for analysis
* Multivariate data exploration
* Supervised clustering
* Machine learning – classification model validation and feature selection
* Network analysis - biochemical, structural similarity and correlation networks
* Network mapping – putting it all together to create a publication quality network
url:
https://github.com/CreativeDataSolutions/CDS.courses/blob/gh-pages/courses/network_mapping_101/materials/lectures/tutorial.pdf
Rise of Deep Learning for Genomic, Proteomic, and Metabolomic Data Integratio...Dmitry Grapov
Machine learning (ML) is being ubiquitously incorporated into everyday products such as Internet search, email spam filters, product recommendations, image classification, and speech recognition. New approaches for highly integrated manufacturing and automation such as the Industry 4.0 and the Internet of things are also converging with ML methodologies. Many approaches incorporate complex artificial neural network architectures and are collectively referred to as deep learning (DL) applications. These methods have been shown capable of representing and learning predictable relationships in many diverse forms of data and hold promise for transforming the future of omics research and applications in precision medicine. Omics and electronic health record data pose considerable challenges for DL. This is due to many factors such as low signal to noise, analytical variance, and complex data integration requirements. However, DL models have already been shown capable of both improving the ease of data encoding and predictive model performance over alternative approaches. It may not be surprising that concepts encountered in DL share similarities with those observed in biological message relay systems such as gene, protein, and metabolite networks. This expert review examines the challenges and opportunities for DL at a systems and biological scale for a precision medicine readership.
current: https://drive.google.com/open?id=0B51AEMfo-fh9M3FmWXVlb05pdm8
I am always looking for the next data science, machine learning and visualization challenge.
Here is a link to my up to date
resume:
https://drive.google.com/open?id=0B51AEMfo-fh9M3FmWXVlb05pdm8
cv:
https://drive.google.com/open?id=0B51AEMfo-fh9Z05aM2p6XzFIOFE
https://www.youtube.com/watch?v=Y_-o-4rKxUk
Machine learning powered metabolomic network analysis
Dmitry Grapov PhD,
Director of Data Science and Bioinformatics,
CDS- Creative Data Solutions
www.createdatasol.com
Metabolomic network analysis can be used to interpret experimental results within a variety of contexts including: biochemical relationships, structural and spectral similarity and empirical correlation. Machine learning is useful for modeling relationships in the context of pattern recognition, clustering, classification and regression based predictive modeling. The combination of developed metabolomic networks and machine learning based predictive models offer a unique method to visualize empirical relationships while testing key experimental hypotheses. The following presentation focuses on data analysis, visualization, machine learning and network mapping approaches used to create richly mapped metabolomic networks. Learn more at www.createdatasol.com
Step by step tutorial for conducting GO enrichment analysis and then creating a network from the results.
Material from the UC Davis 2014 Proteomics Workshop.
See more at: http://sourceforge.net/projects/teachingdemos/files/2014%20UC%20Davis%20Proteomics%20Workshop/
2. Introduction
Important
•This is an introduction to a series
of 8 tutorials for metabolomic data
analysis
•Download all the required files and
software here:
https://sourceforge.net/projects/teachingdemos/files/Winter%202014%20LC-MS%20and%20Statistics%20Course/
•Then follow the directions in the
software/startup.R to launch all
accompanying software
8. Data Analysis Goals
Exploration
Classification
• Are there any trends in my data?
– analytical sources
– meta data/covariates
• Useful Methods
– matrix decomposition (PCA, ICA, NMF)
– cluster analysis
• Differences/similarities between groups?
– discrimination, classification, significant changes
• Useful Methods
– analysis of variance (ANOVA), mixed effects models
– partial least squares discriminant analysis (O-/PLS-DA)
– Others: random forest, CART, SVM, ANN
• What is related or predictive of my variable(s) of interest?
– Regression, correlation
• Useful Methods
– correlation
– partial least squares (O-/PLS)
Prediction
12. Univariate Analyses
•Identify differences in sample population
means
•sensitive to distribution shape
•parametric = assumes normality
•error in Y, not in X (Y = mX + error)
wide
•optimal for long data
•assumed independence
•false discovery rate (FDR)
long
n-of-one
13. False Discovery Rate (FDR)
Type I Error: False Positives
•Type II Error: False Negatives
•Type I risk =
•1-(1-p.value)m
m = number of variables tested
FDR correction
• p-value adjustment or estimate of FDR (Fdr, q-value)
Bioinformatics (2008) 24 (12):1461-1462
14. Achieving “significance” is a function of:
significance level (α) and power (1-β )
effect size (standardized difference in means)
sample size (n)
*finish lab
1-statistical analysis
16. Cluster Analysis
Use the concept similarity/dissimilarity
to group a collection of samples or
variables
Linkage
Approaches
•hierarchical (HCA)
•non-hierarchical (k-NN, k-means)
•distribution (mixtures models)
•density (DBSCAN)
•self organizing maps (SOM)
Distribution
k-means
Density
17. Hierarchical Cluster Analysis
• similarity/dissimilarity
defines “nearness” or
distance
euclidean manhattan Mahalanobis non-euclidean
X
X
X
*
Y
Y
Y
21. Projection of Data
The algorithm defines the position of the light source
Principal Components Analysis (PCA)
• unsupervised
• maximize variance (X)
Partial Least Squares Projection to
Latent Structures (PLS)
• supervised
• maximize covariance (Y ~ X)
James X. Li, 2009, VisuMap Tech.
25. Use PLS to test a hypothesis
Partial Least Squares (PLS) is used to identify planes of maximum
correlation between X measurements and Y (hypothesis)
PLS
PCA
time = 0
120 min.
27. PLS Related Objects
Model
•dimensions, latent variables (LV)
•performance metrics (Q2, RMSEP, etc)
•validation (training/testing, permutation, cross-validation)
•orthogonal correction
Samples
•scores
•predicted values
•residuals
Variables
•Loadings
•Coefficients, summary of loadings based on all LVs
•VIP, variable importance in projection
•Feature selection
28. “goodness” of the model is all about the
perspective
Determine in-sample (Q2) and outof-sample error (RMSEP) and
compare to a random model
•permutation tests
•training/testing
*finish lab 4-Partial Least Squares and lab 5-Data Analysis Case Study
29. Biological Interpretation
Projection or mapping of analysis results
into a biological context.
• Visualization
• Enrichment
• Networks
– biochemical
– structural
– spectral
– empirical
30. Identification of alterations in
biochemical domains
Organism specific biochemical relationships and information
Multiple organism DBs
•KEGG
•BioCyc
•Reactome
•Human
•HMDB
•SMPDB
*finish lab 6-Metabolite Enrichment Analysis
31. Network Mapping
1. Generate
Connections
2. Calculate
Mappings
3. Create
Network
Grapov D., Fiehn O., Multivariate and network tools for analysis and visualization of metabolomic data, ASMS, June 08, 2013, Minneapolis, MN
32. Connections and
Contexts
Biochemical (substrate/product)
•Database lookup
•Web query
Chemical (structural or
spectral similarity )
•fingerprint generation
BMC Bioinformatics 2012, 13:99 doi:10.1186/1471-2105-13-99
Empirical (dependency)
•correlation, partial-correlation