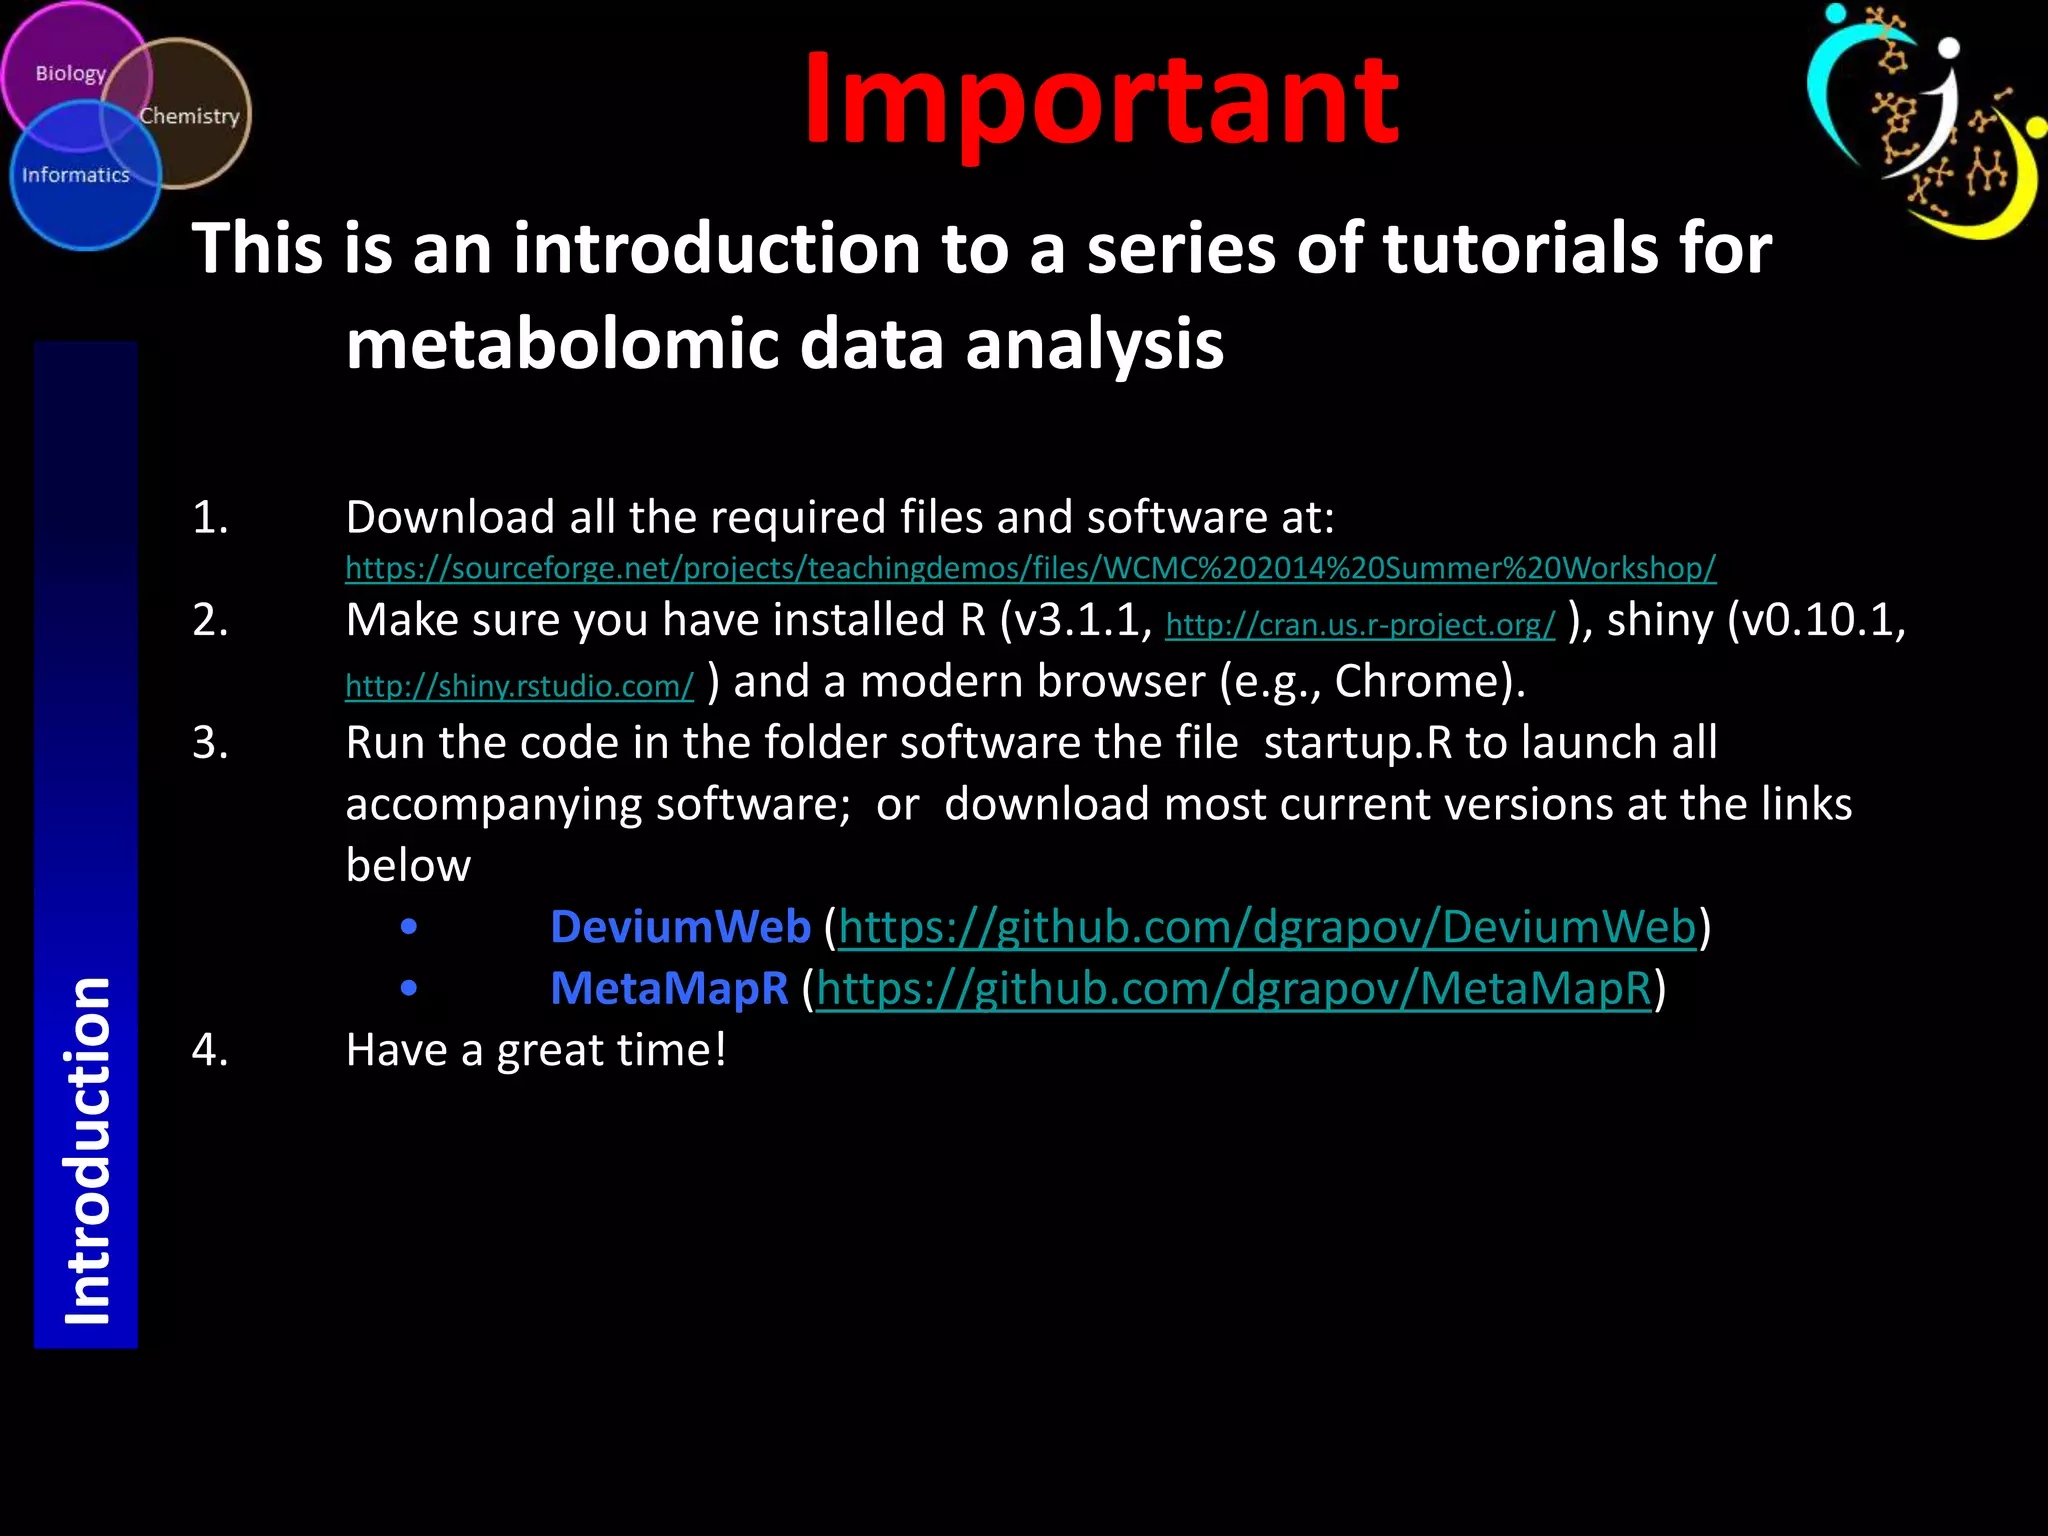
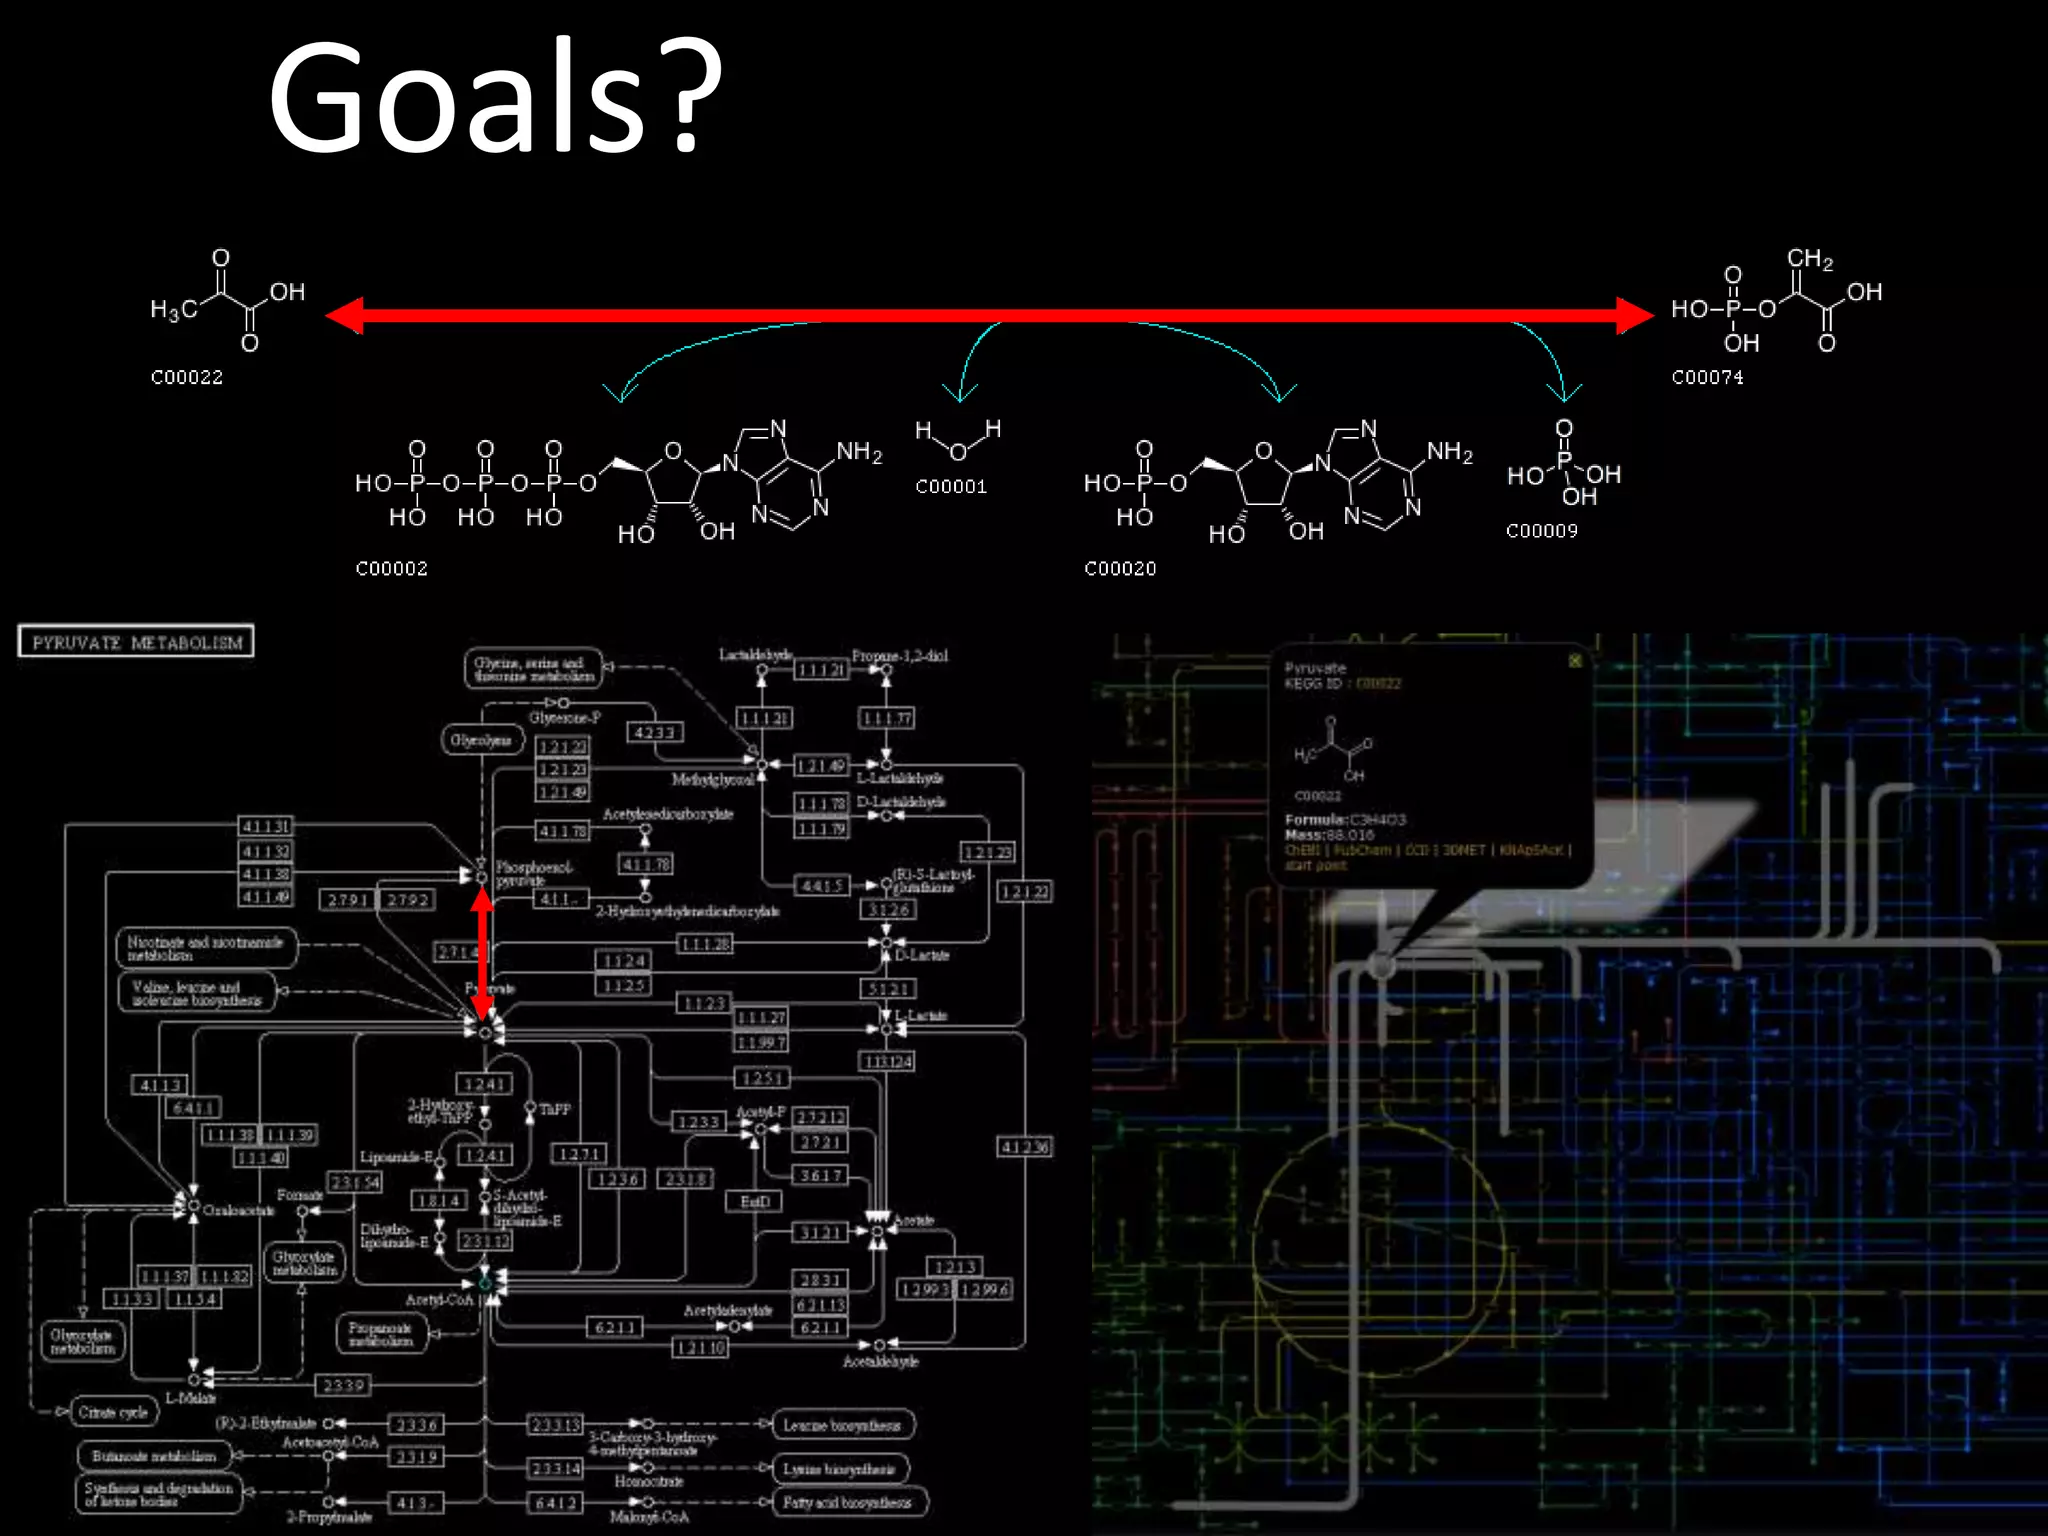
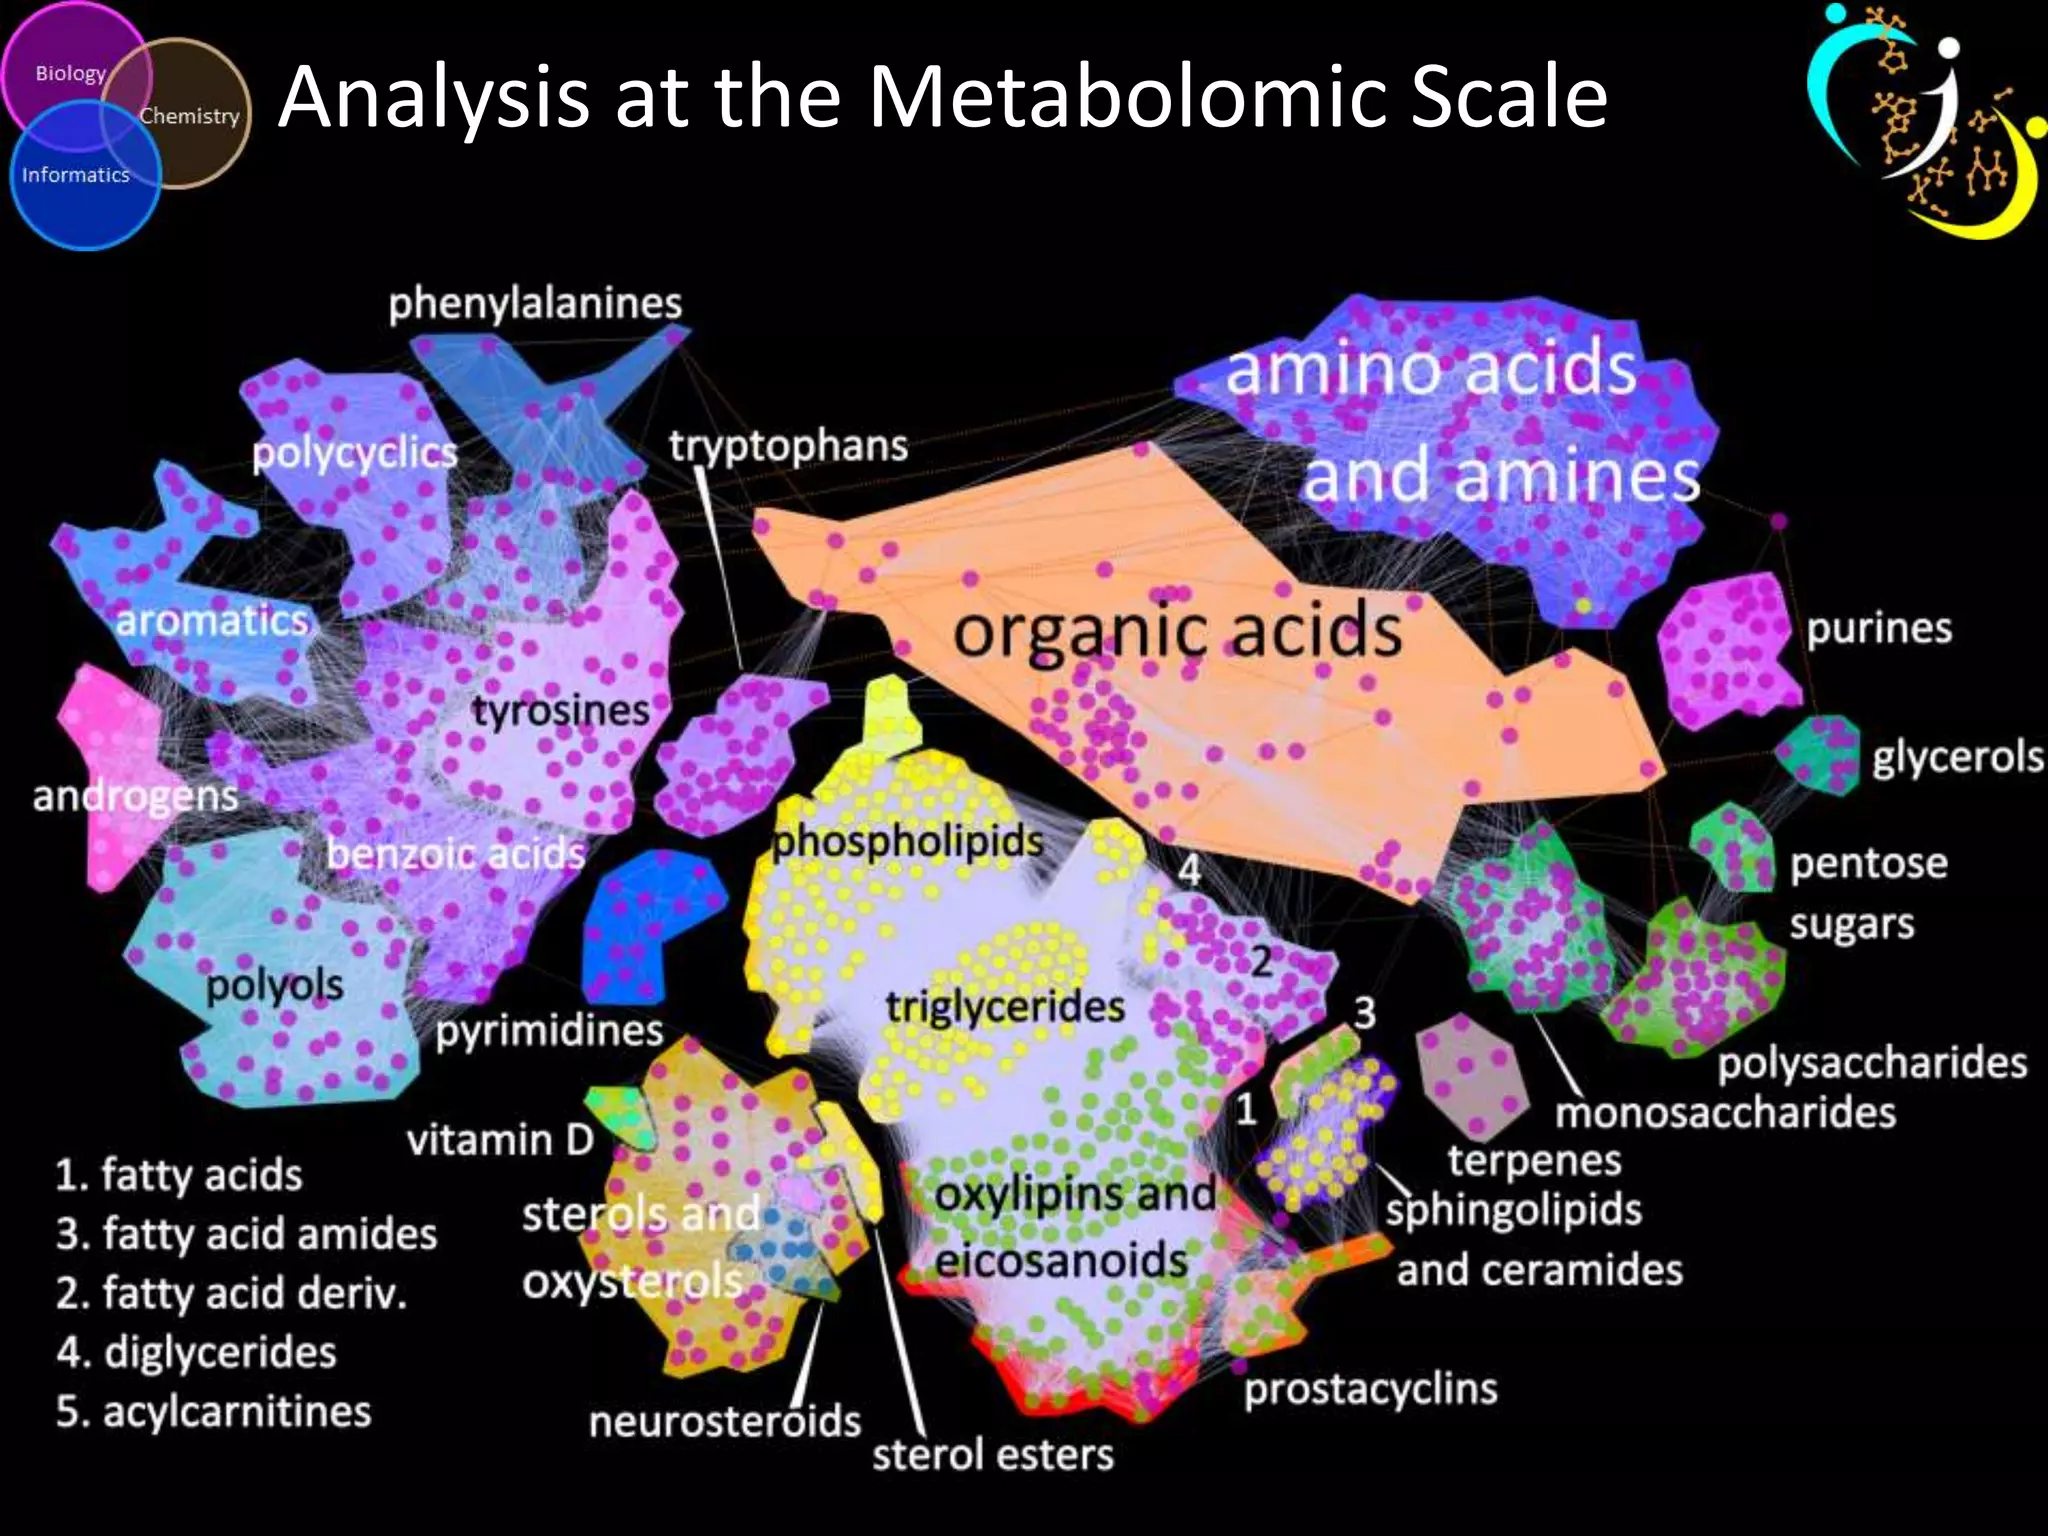
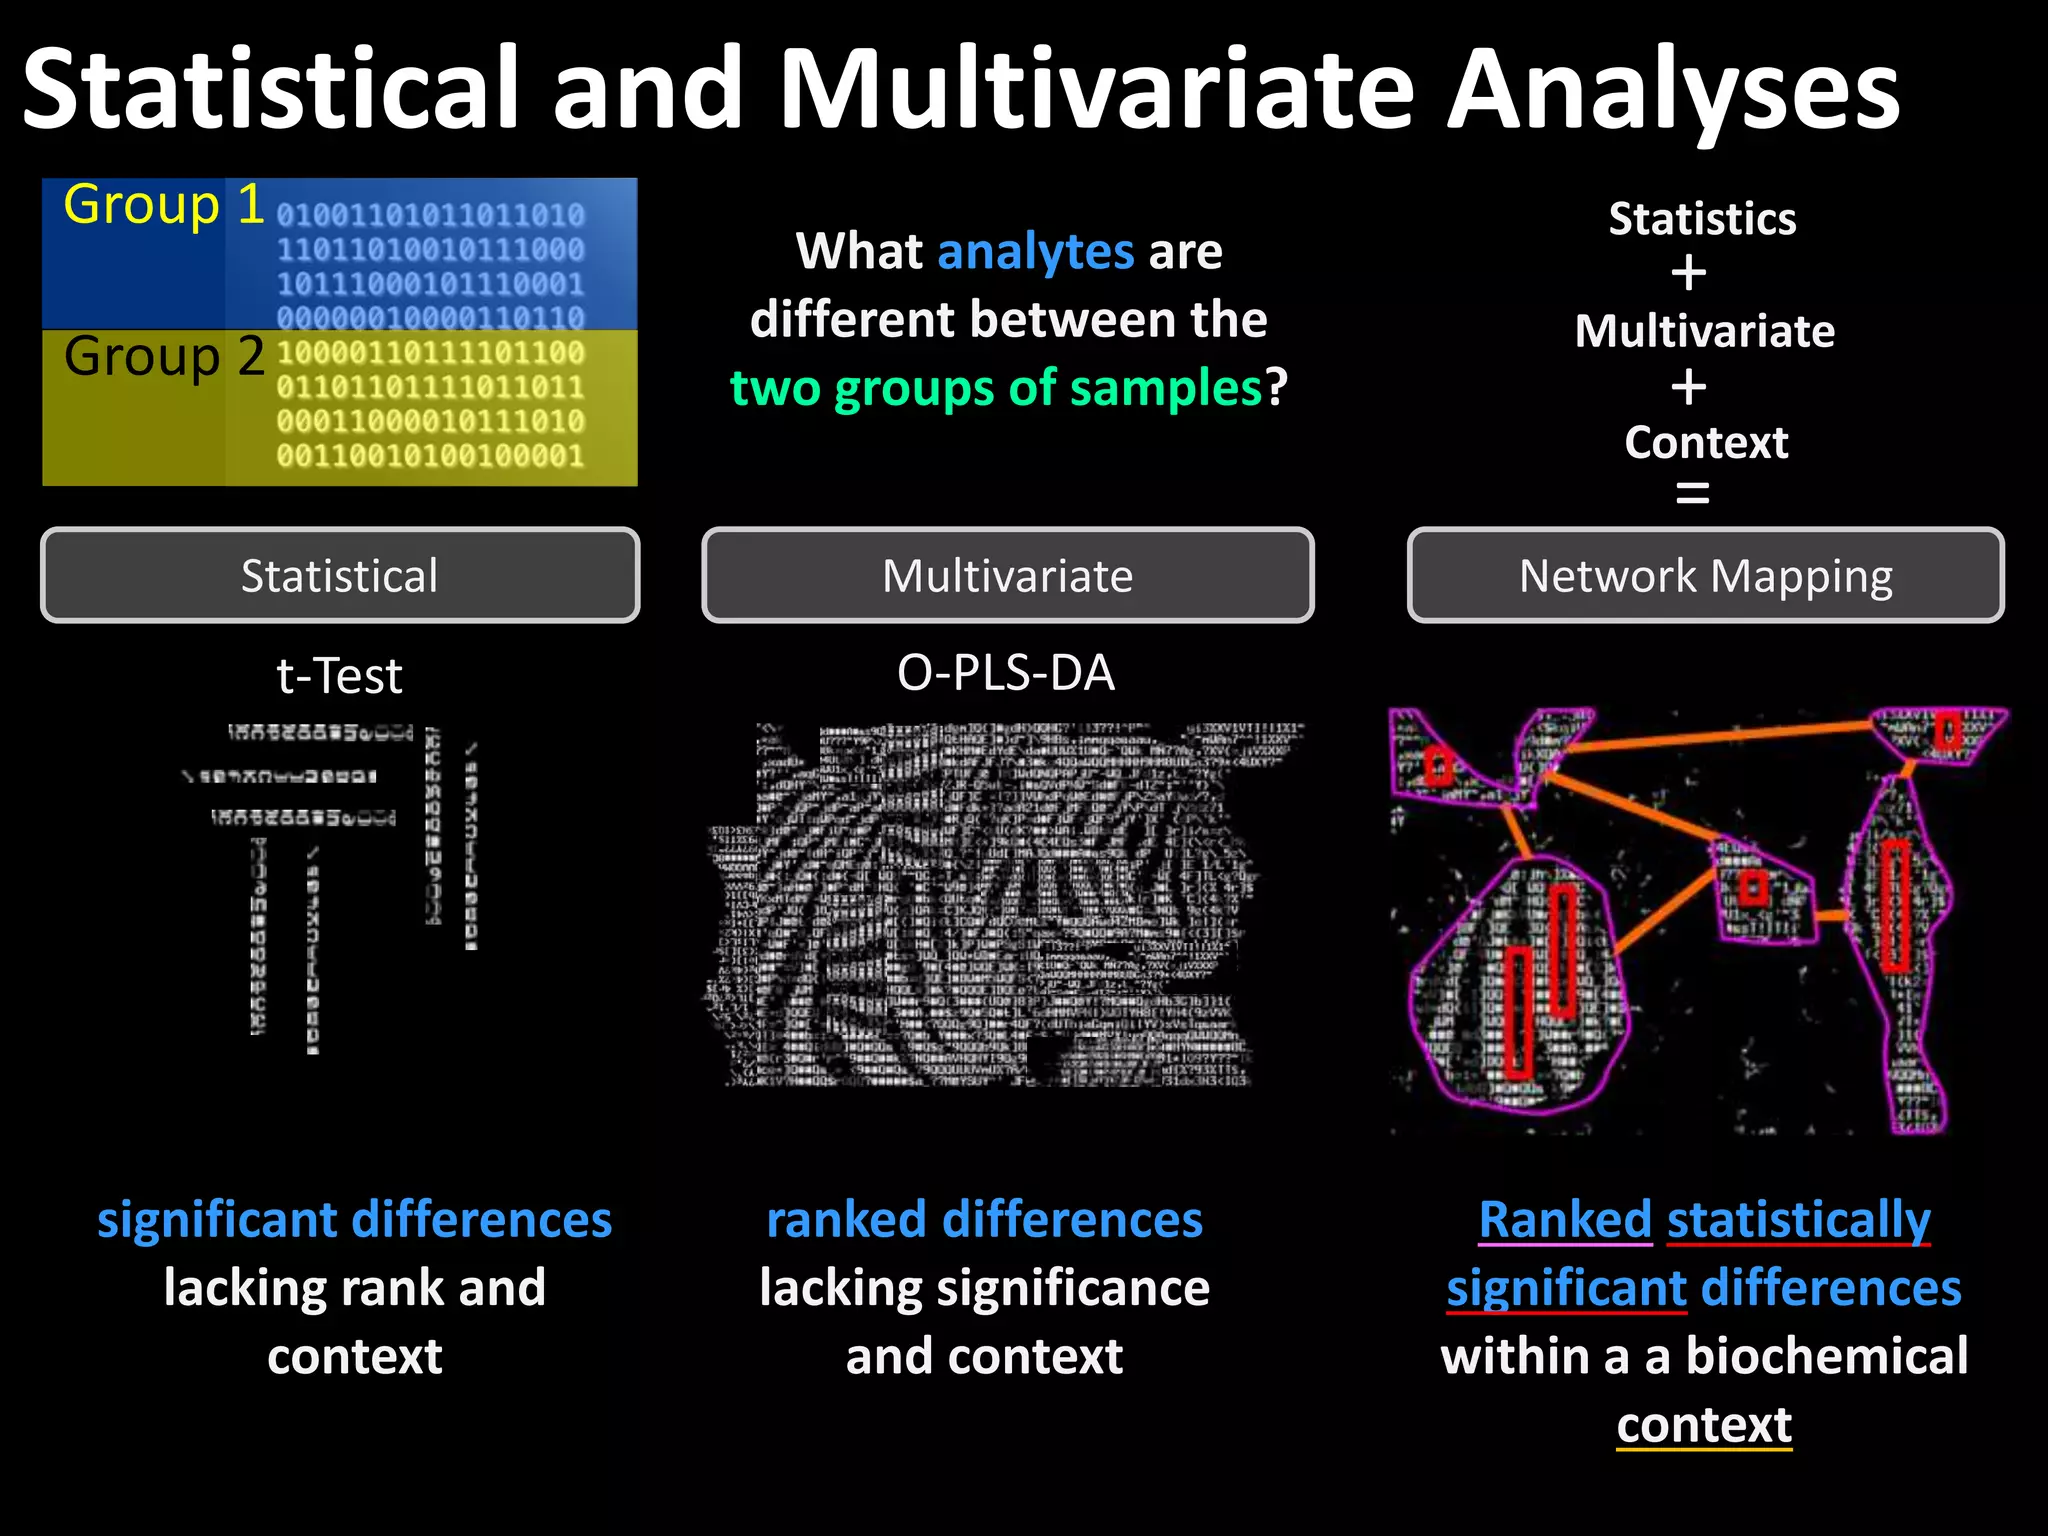
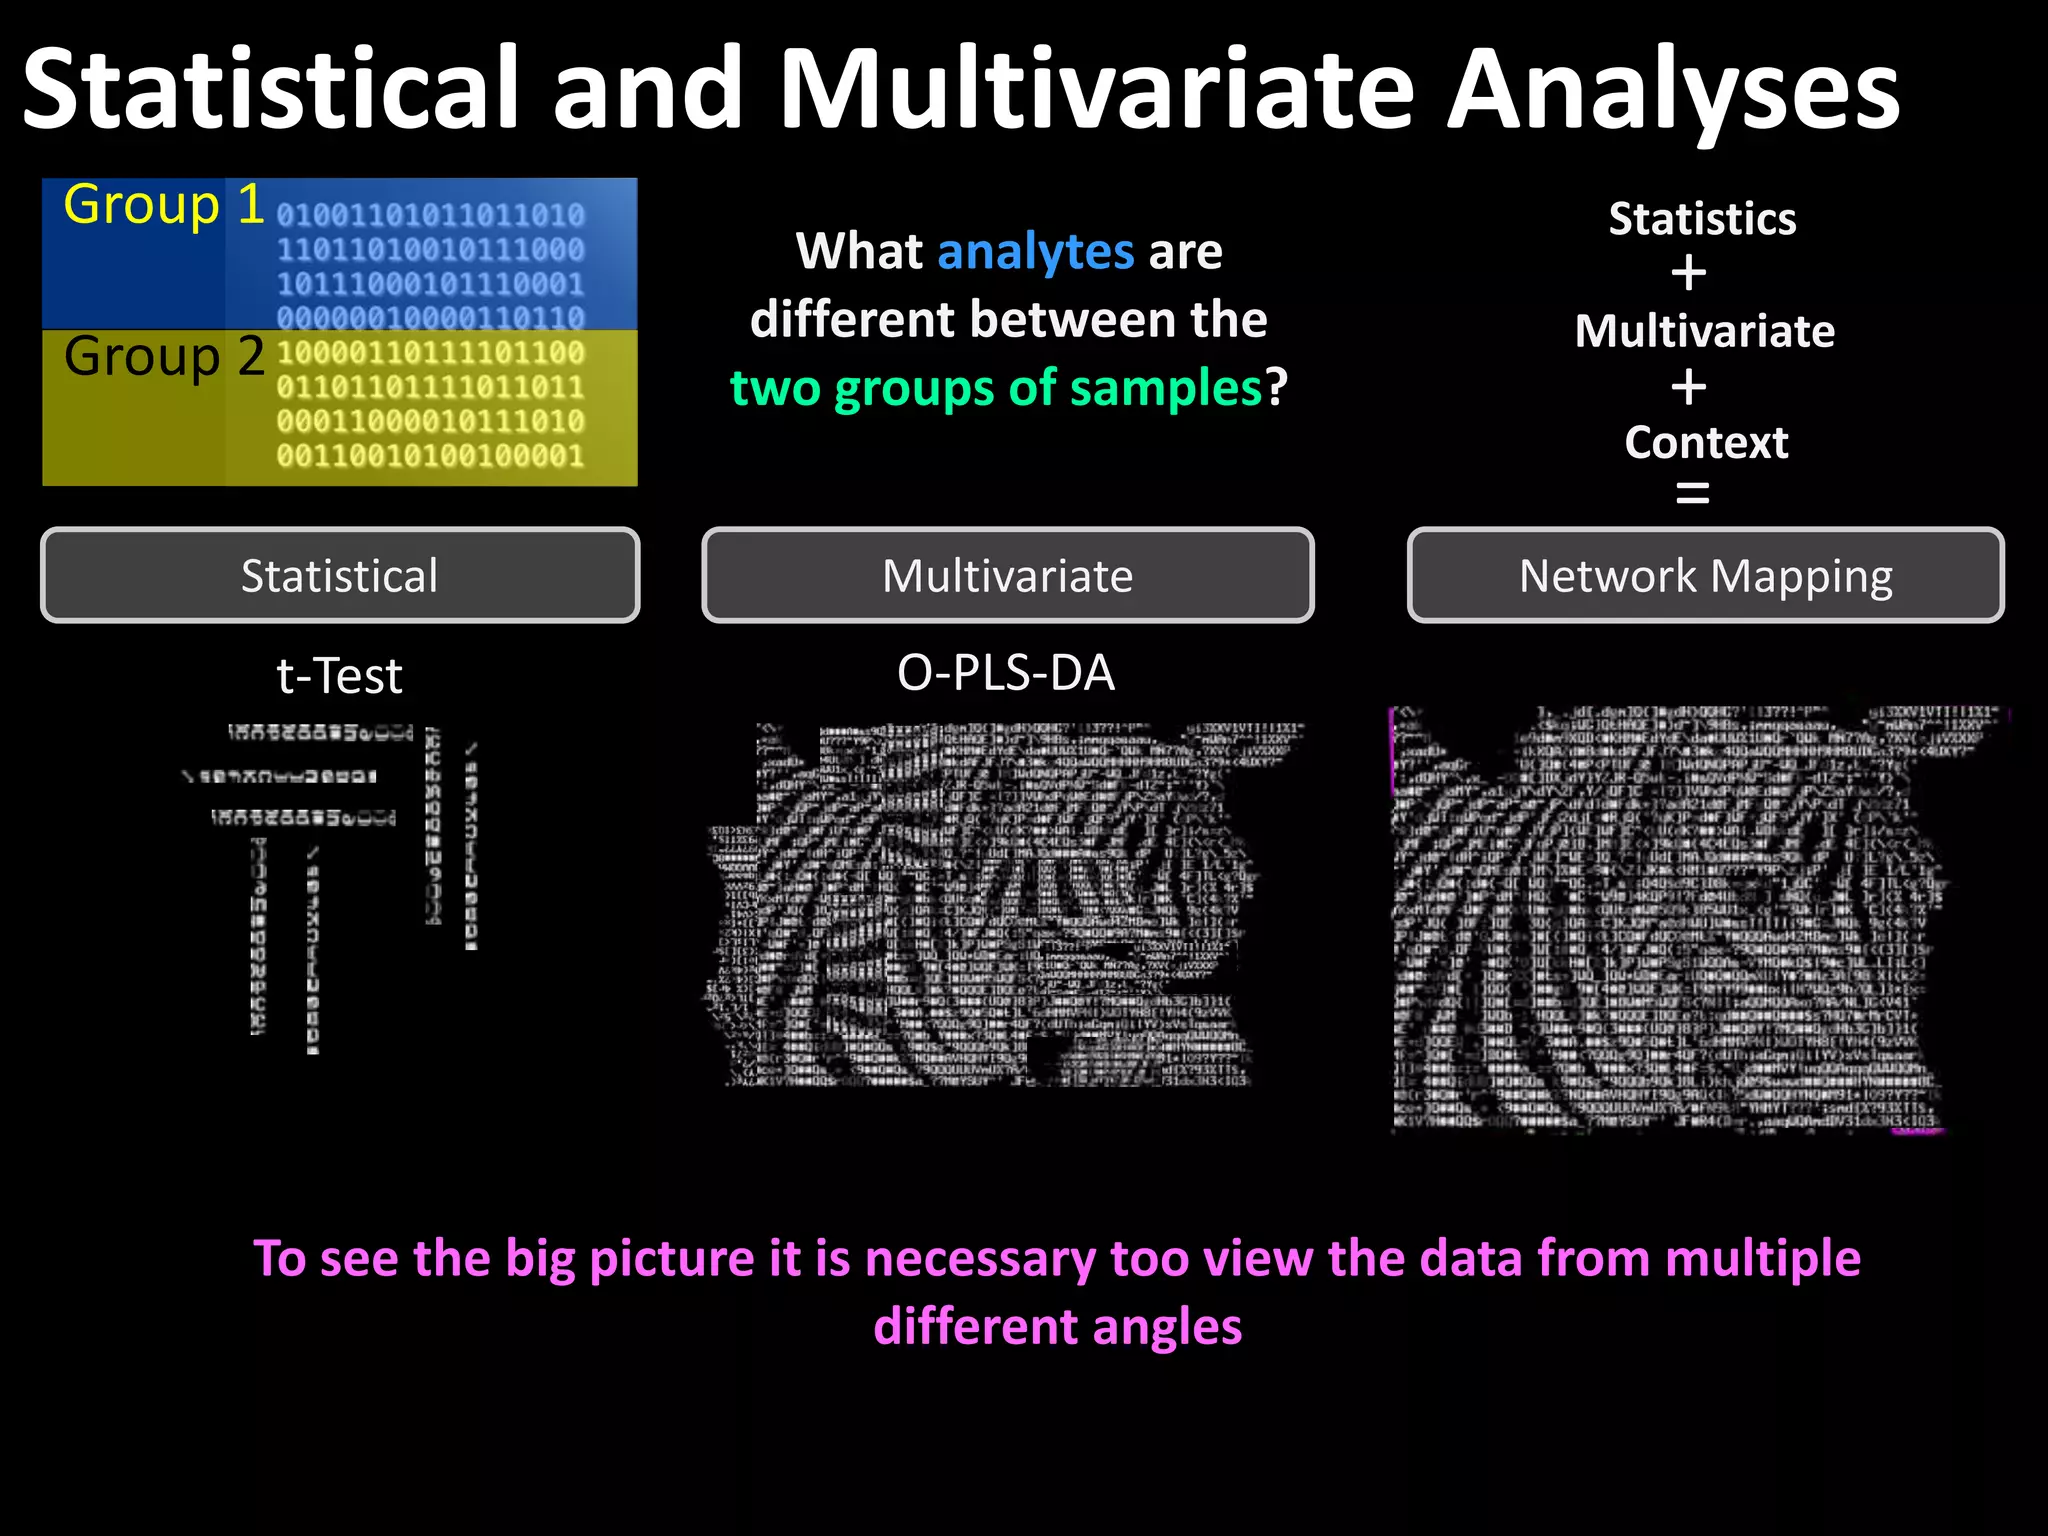
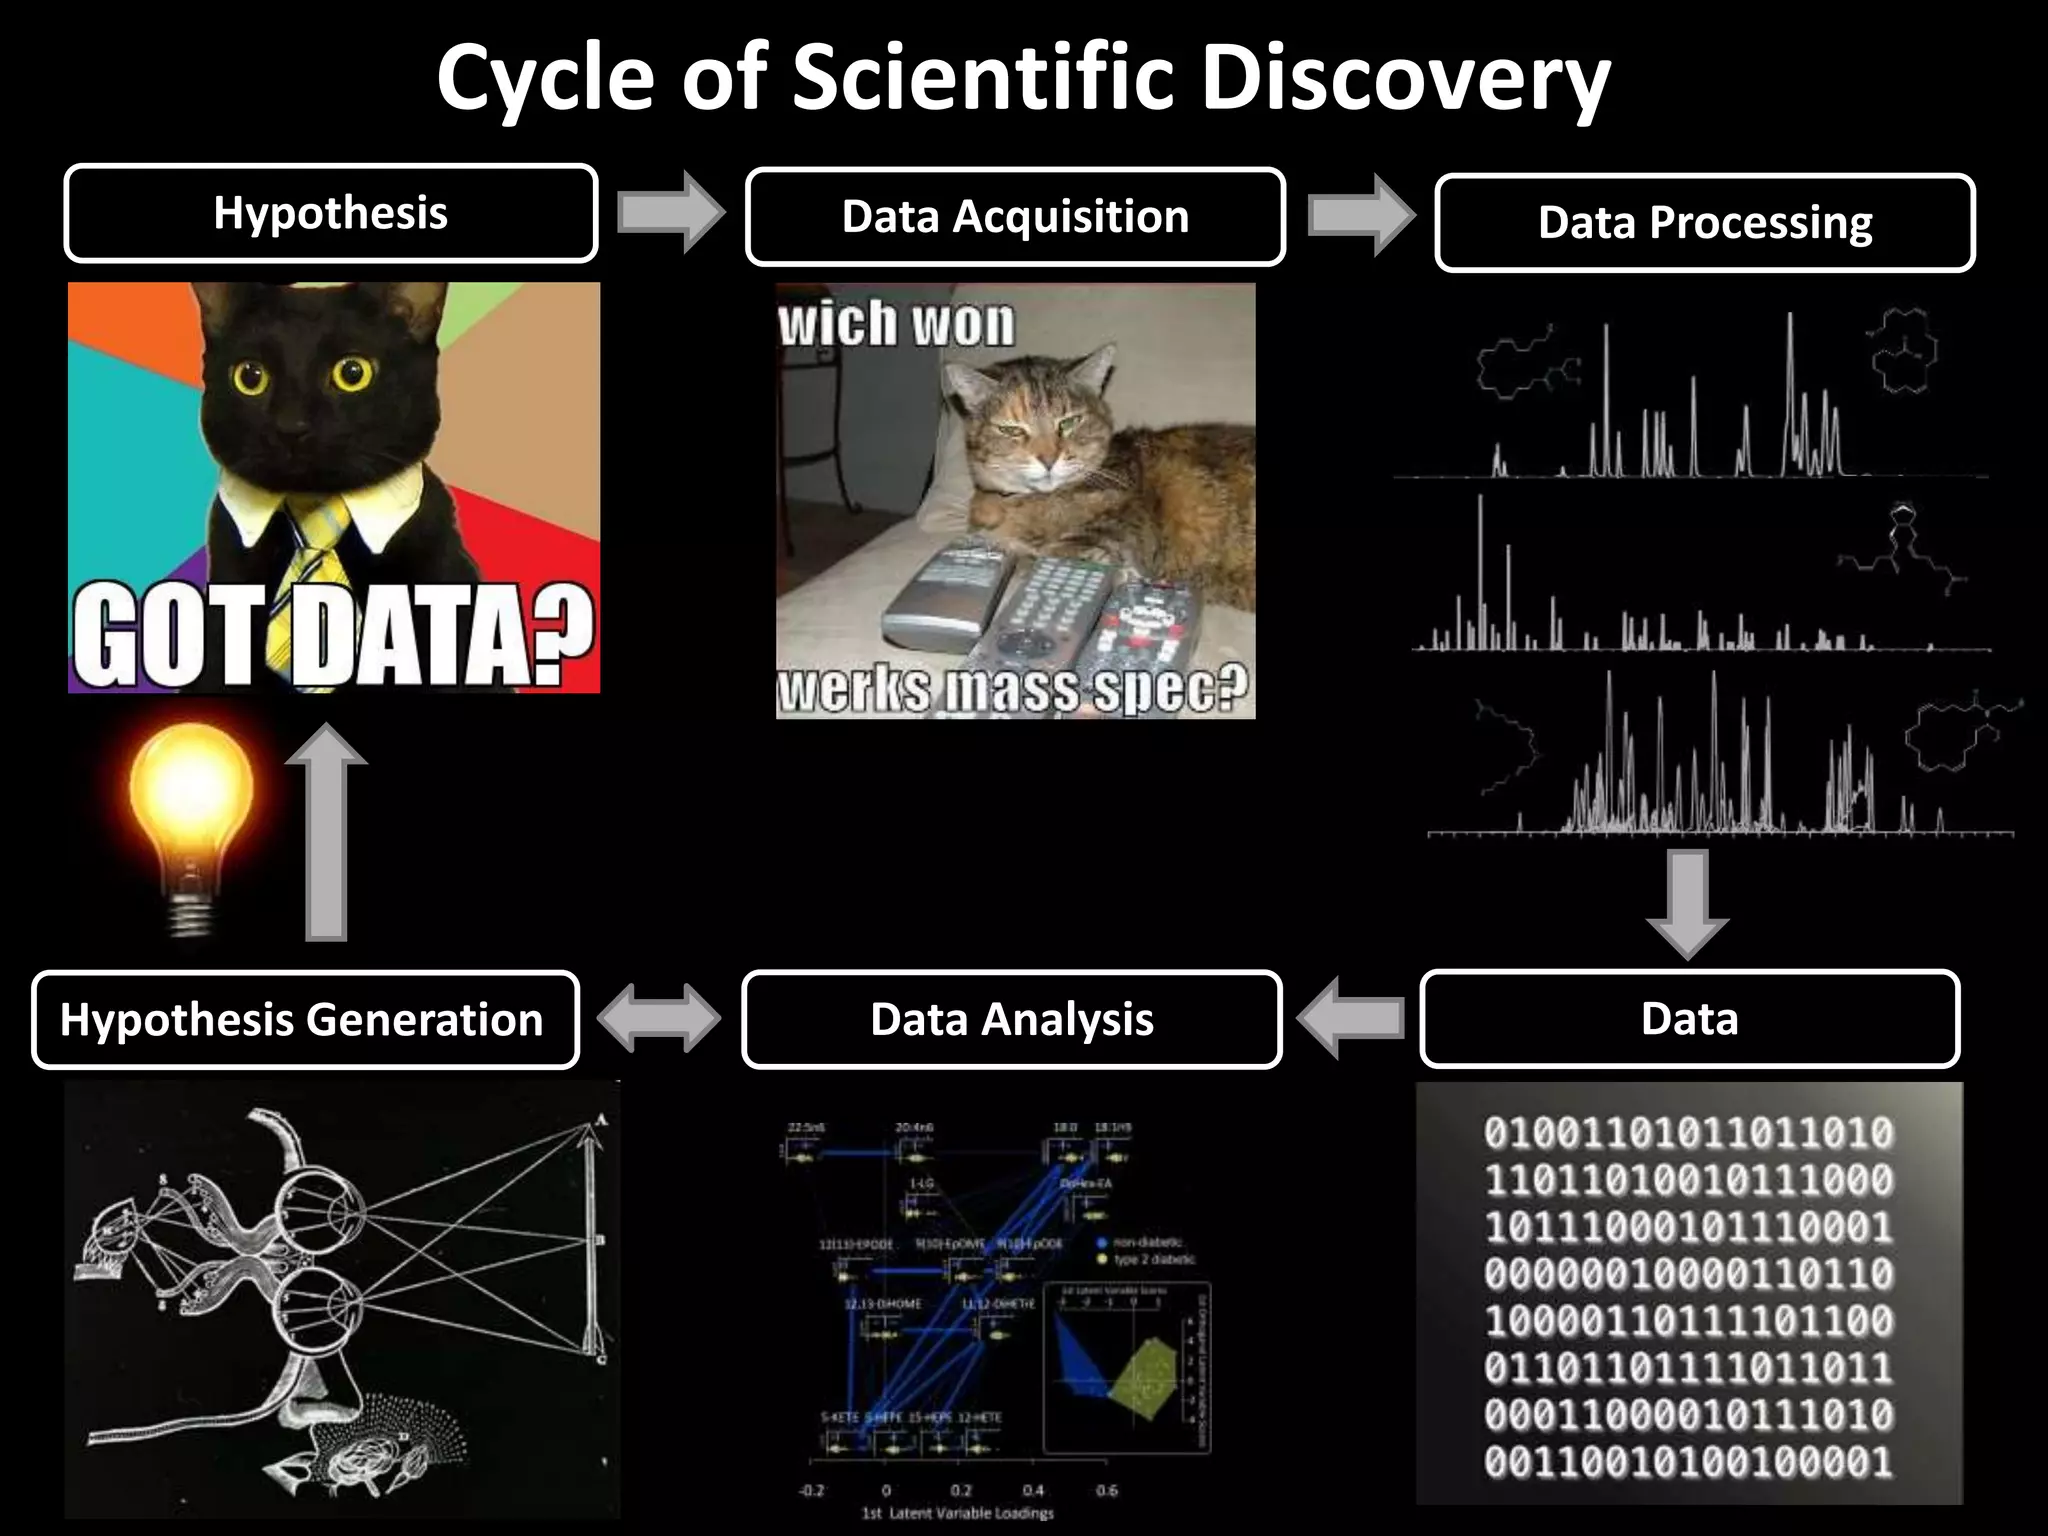
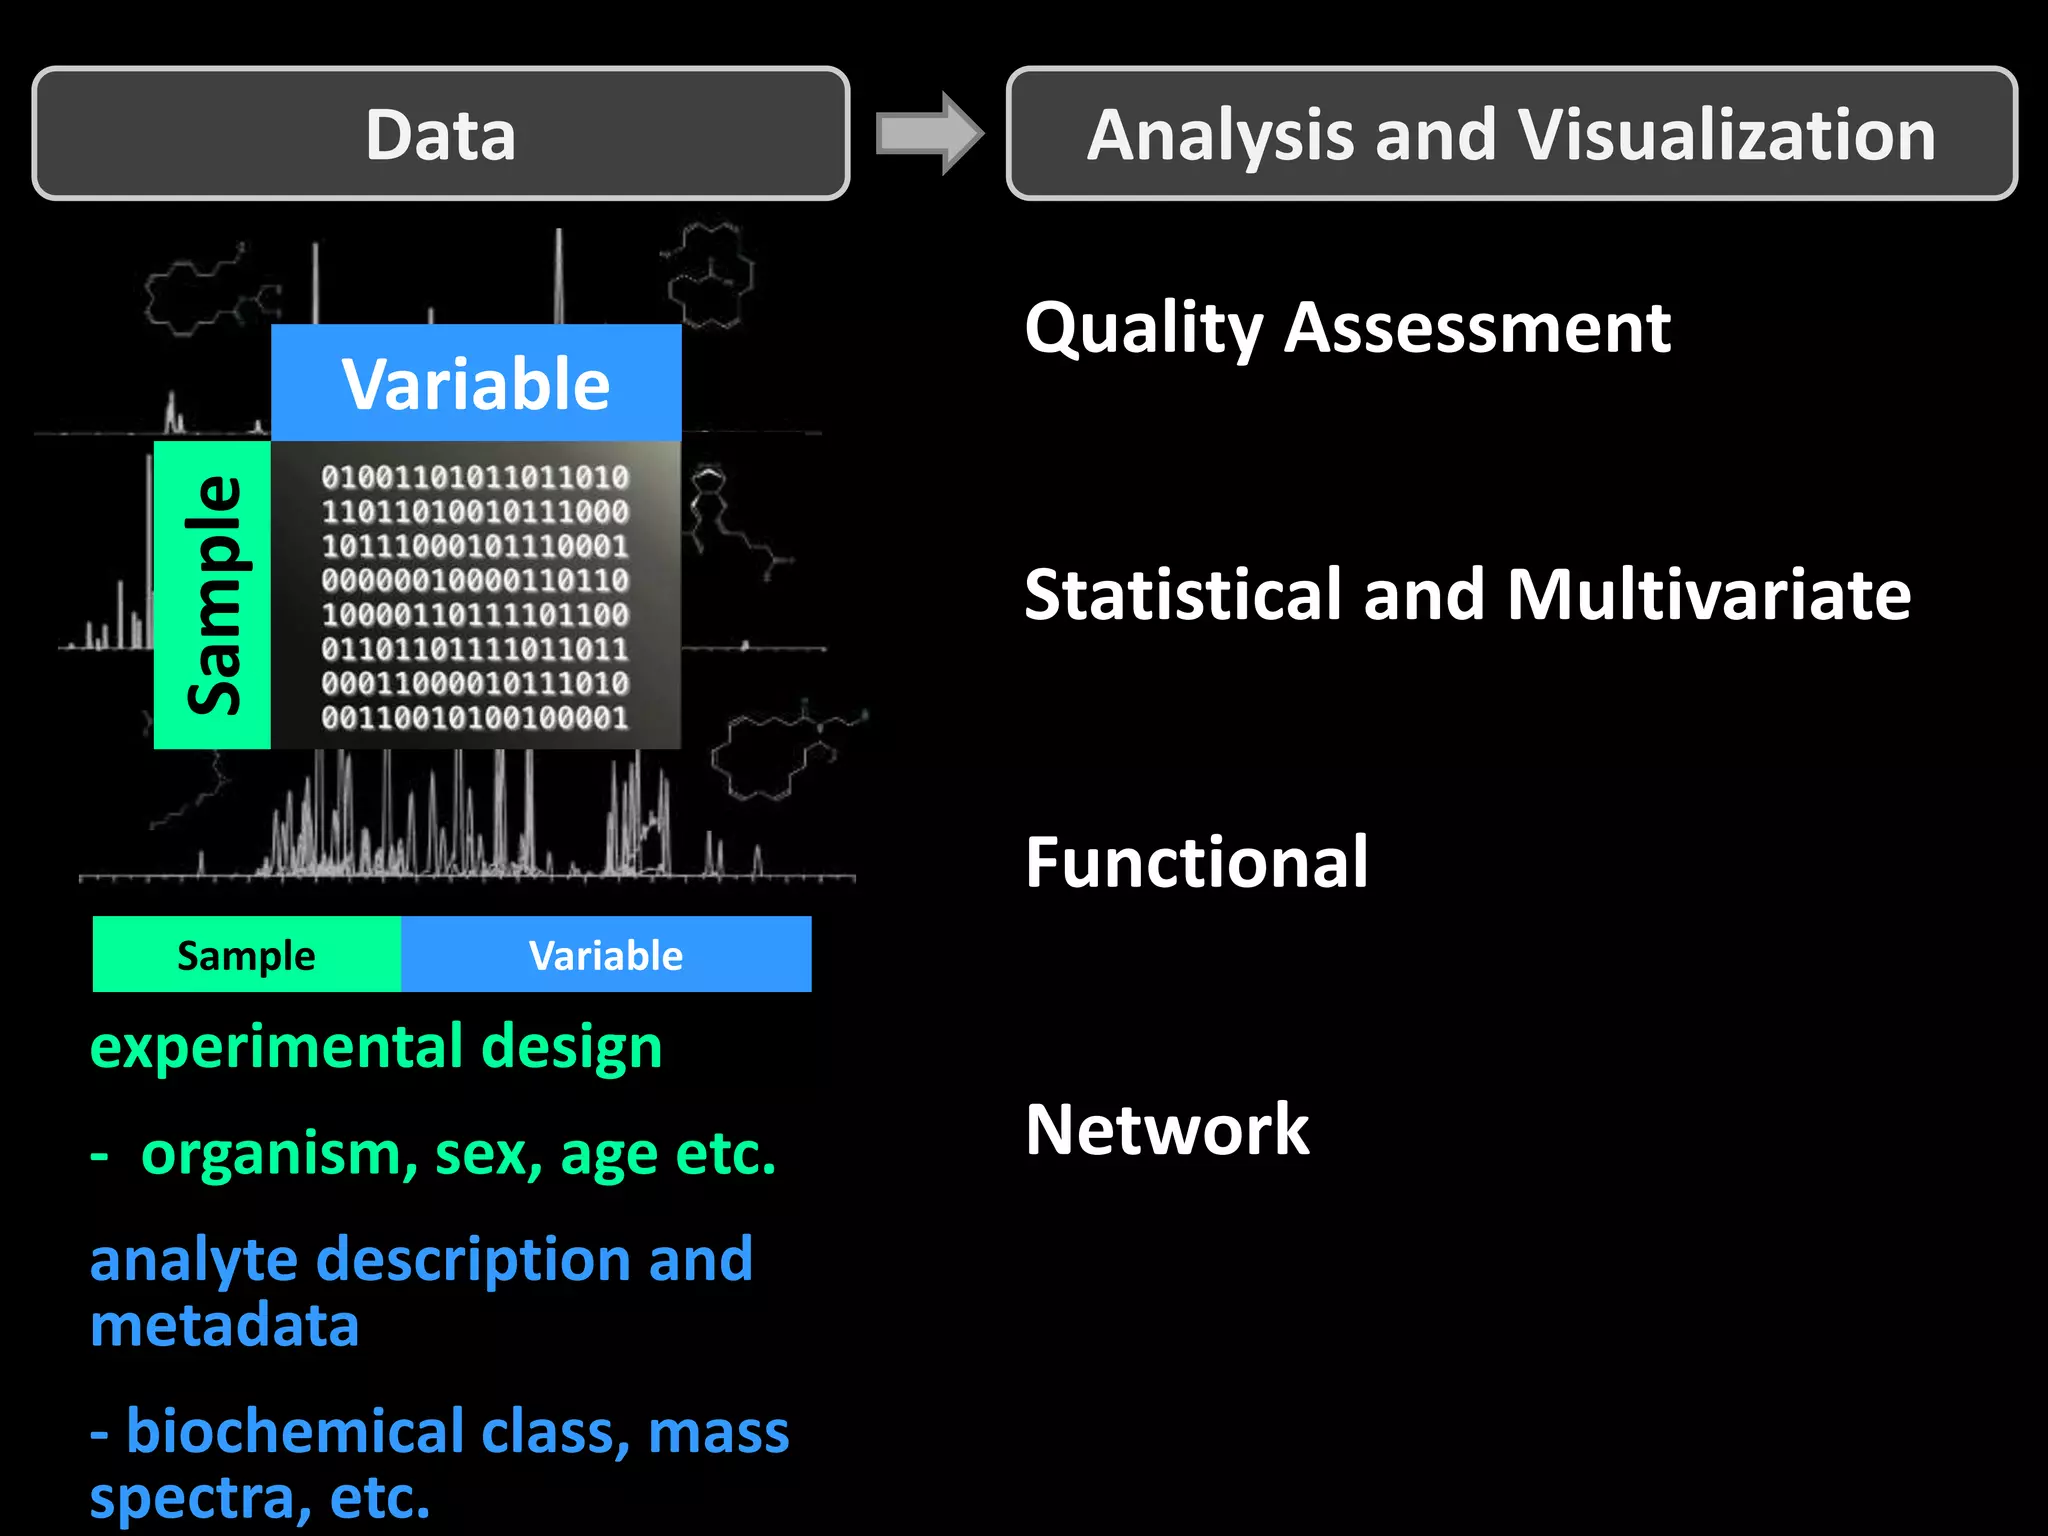
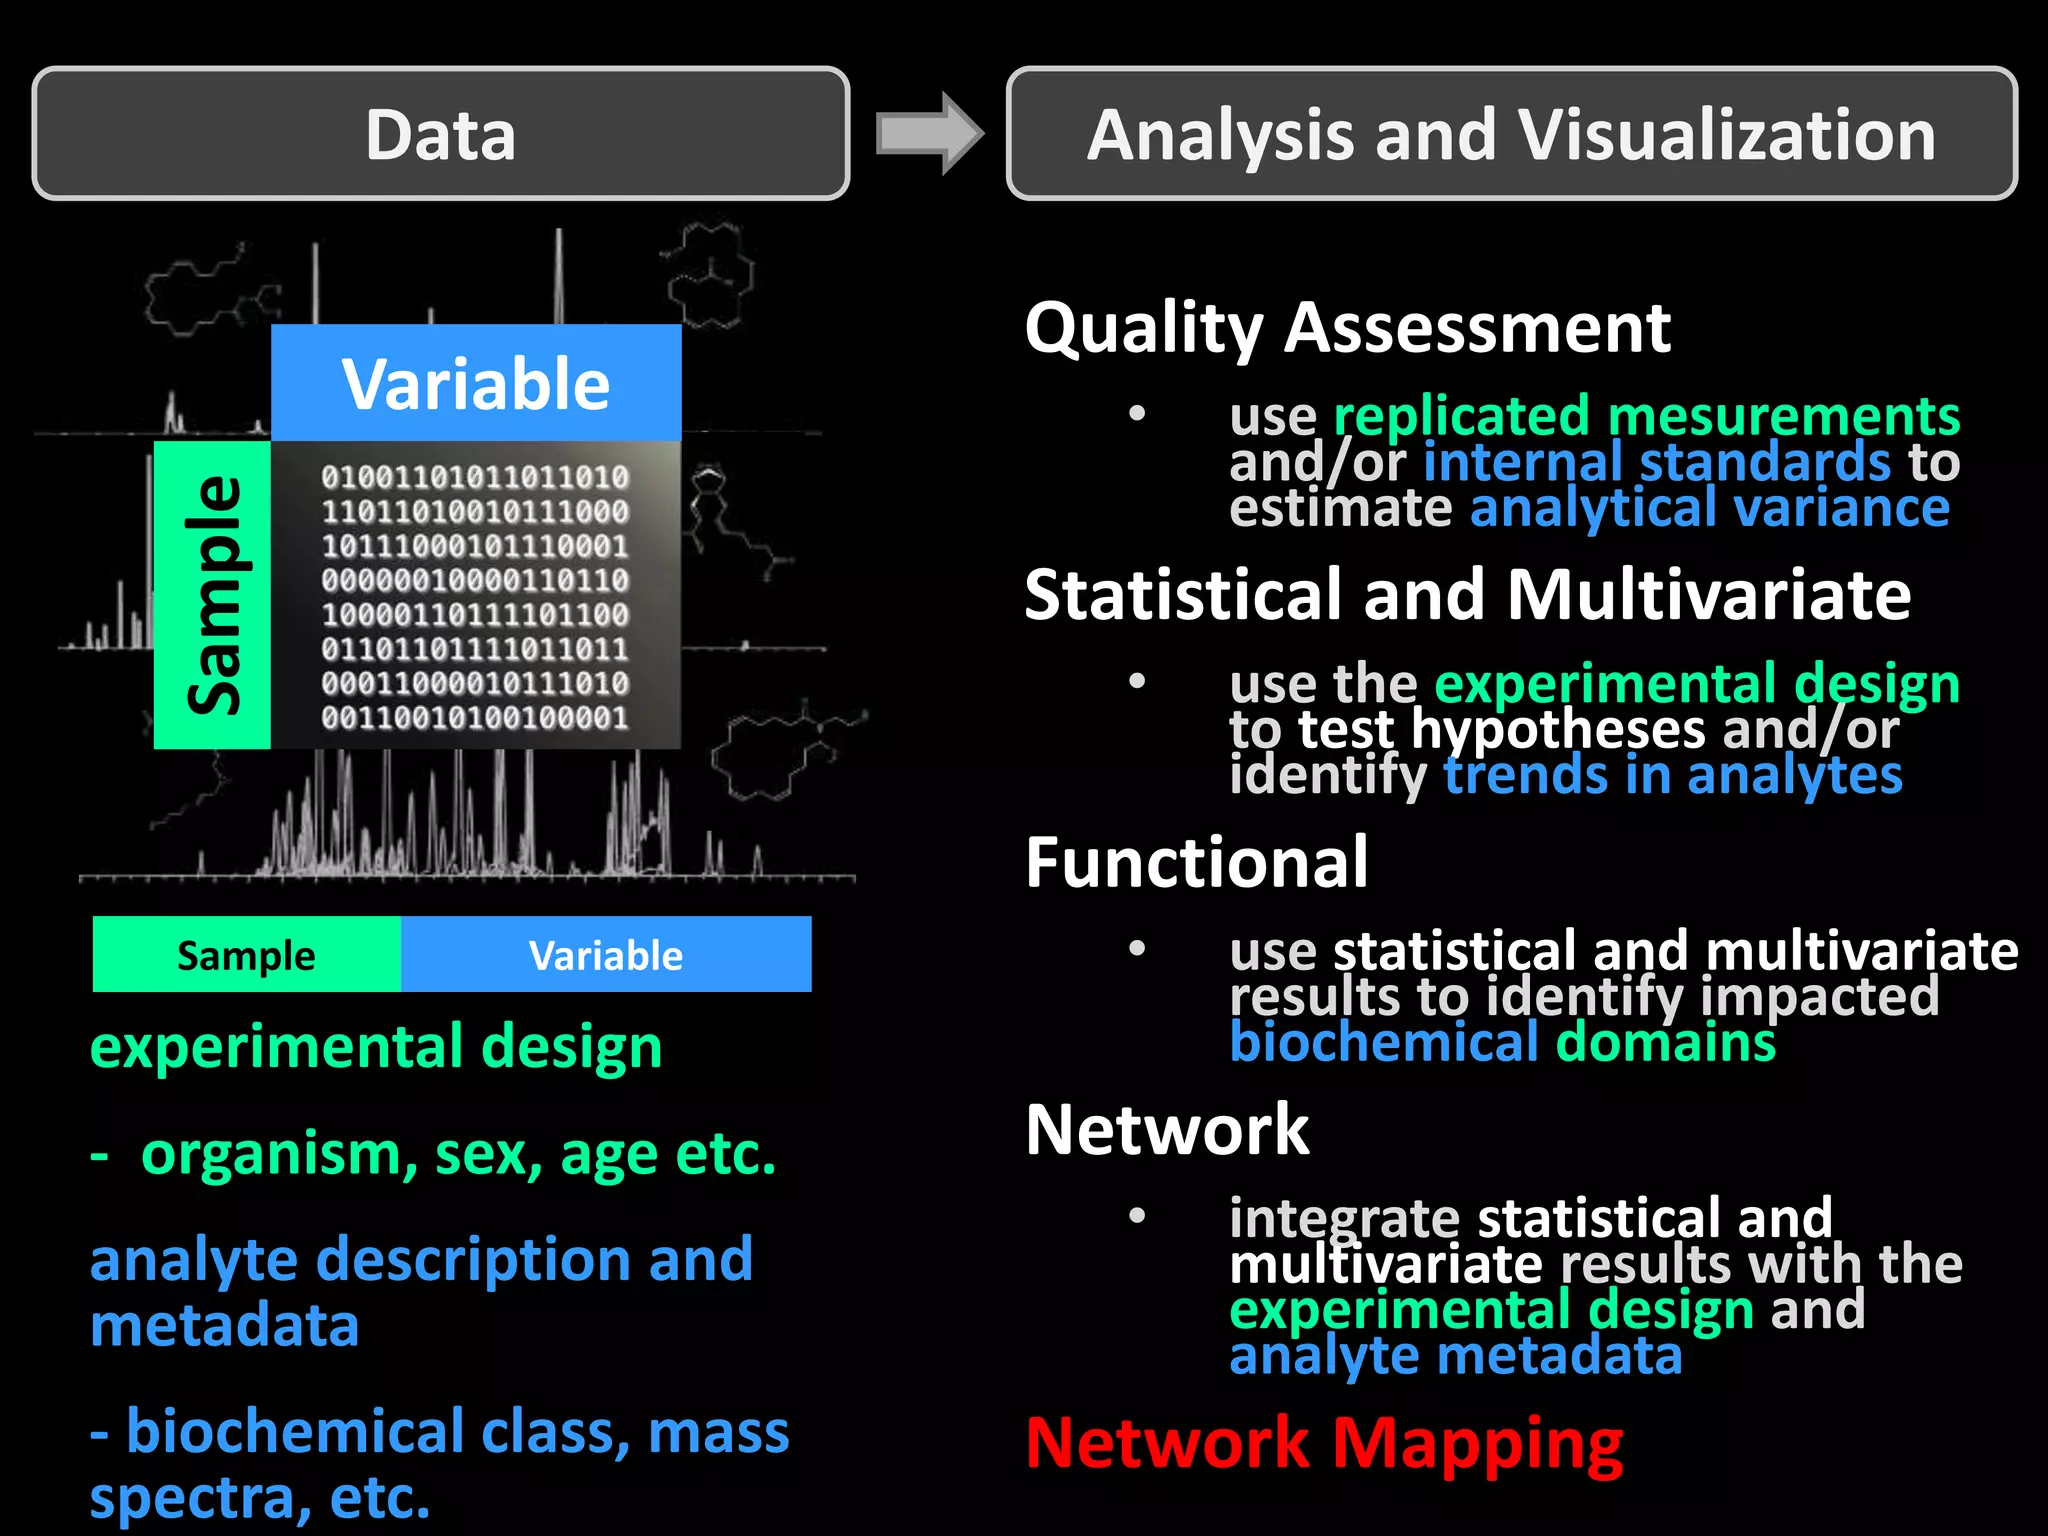
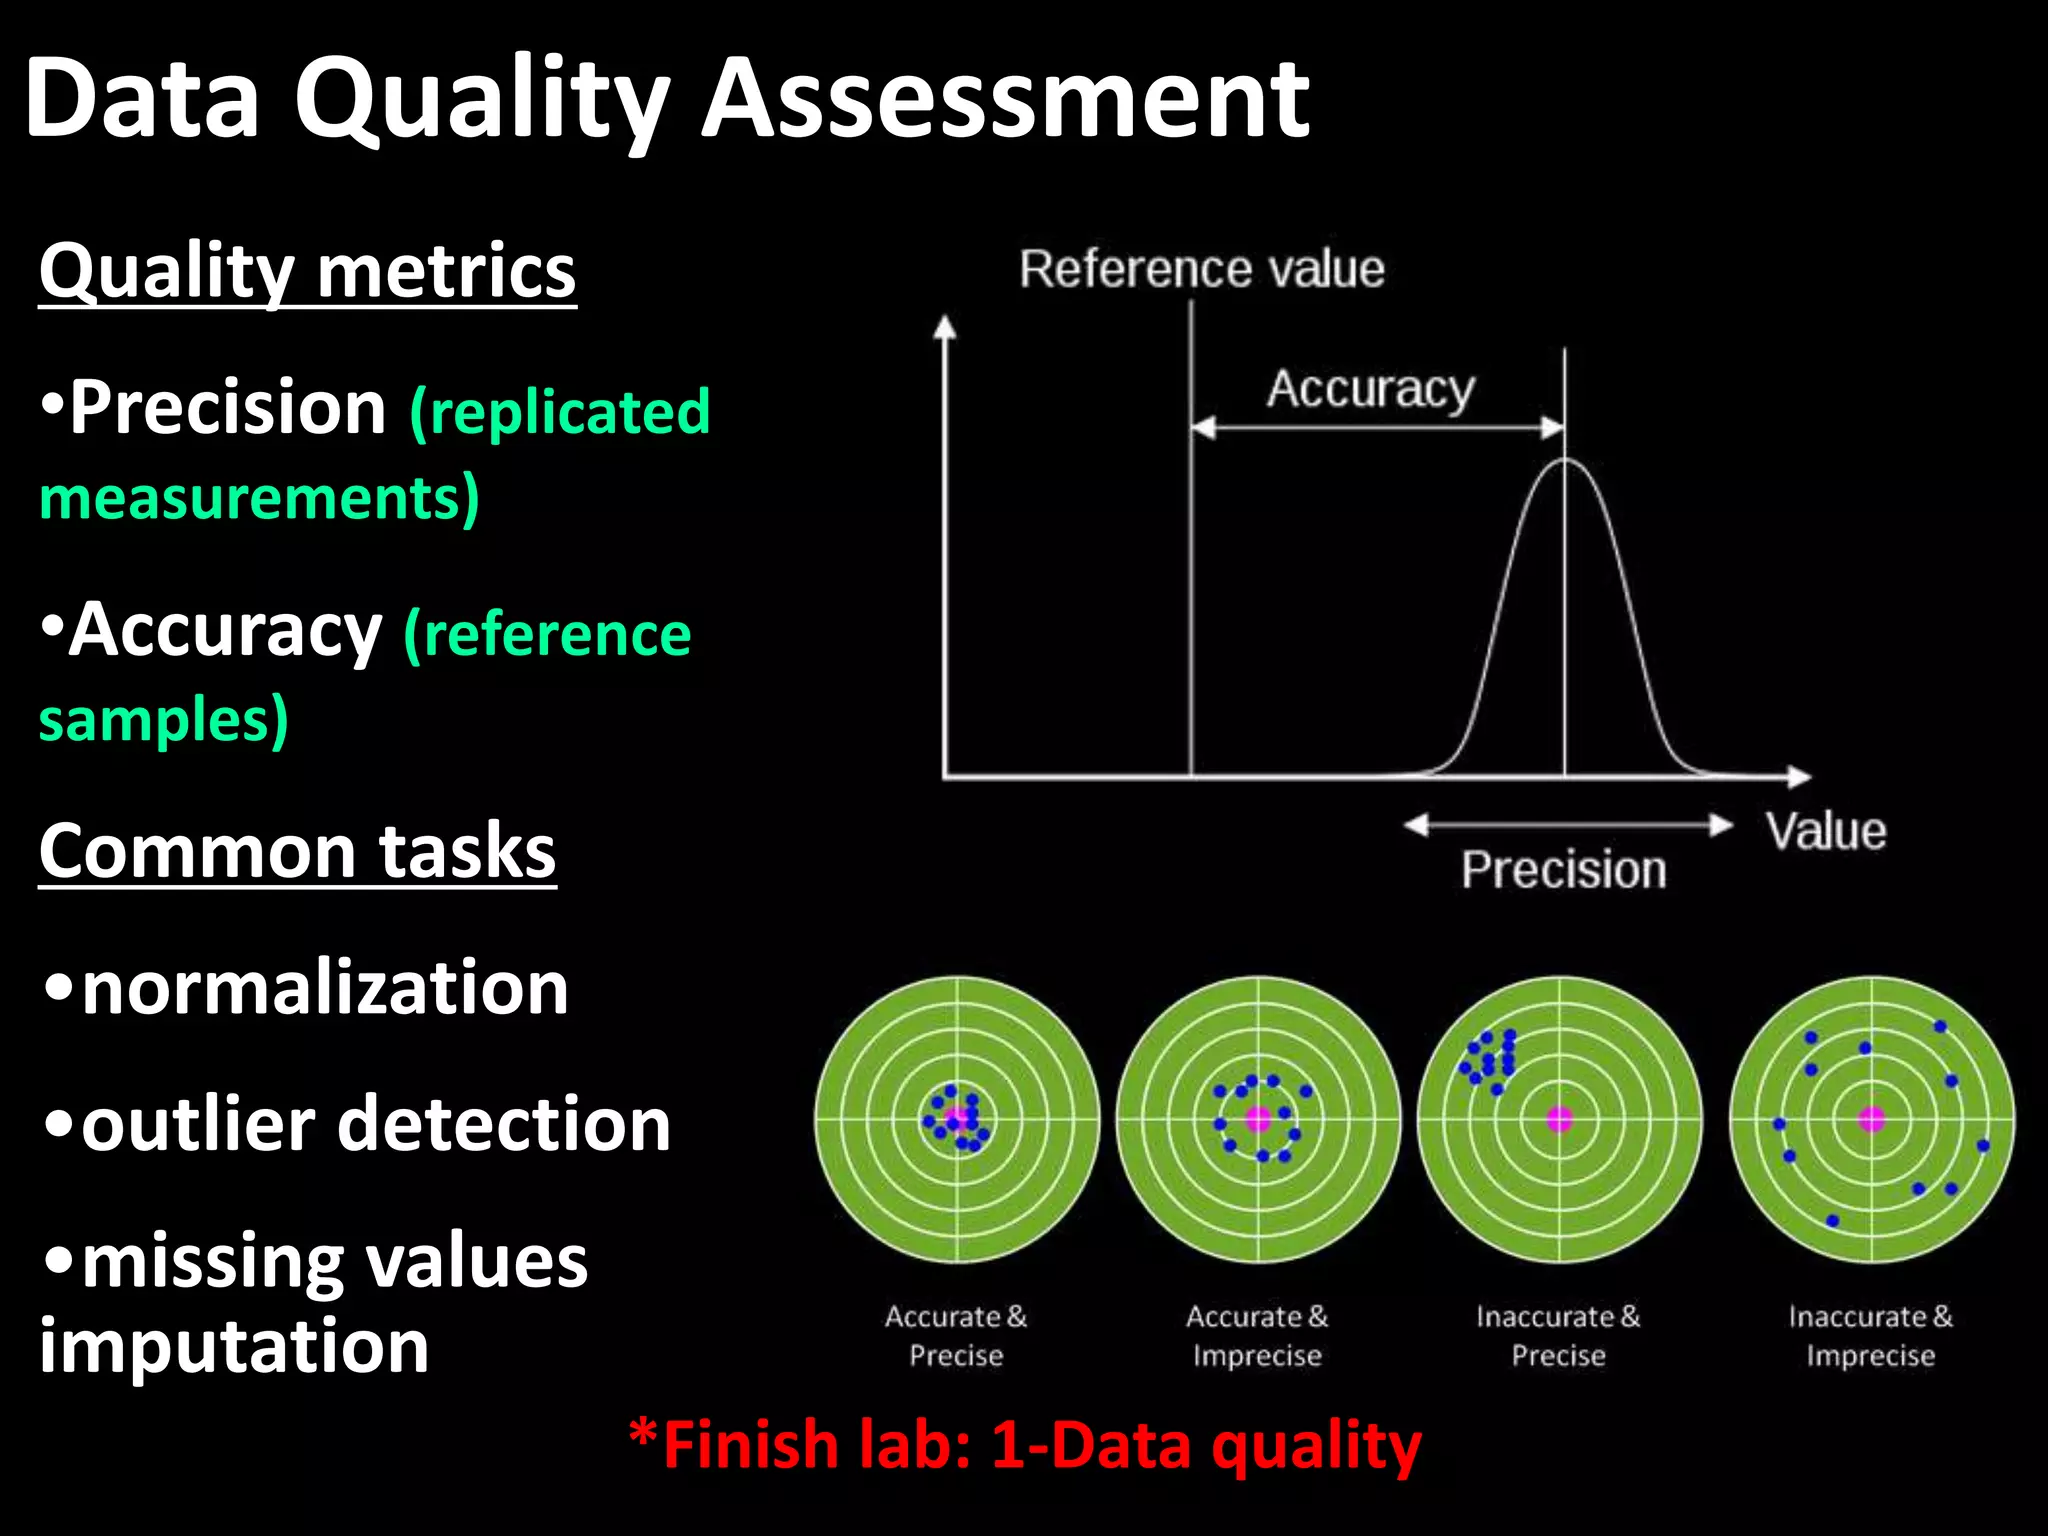
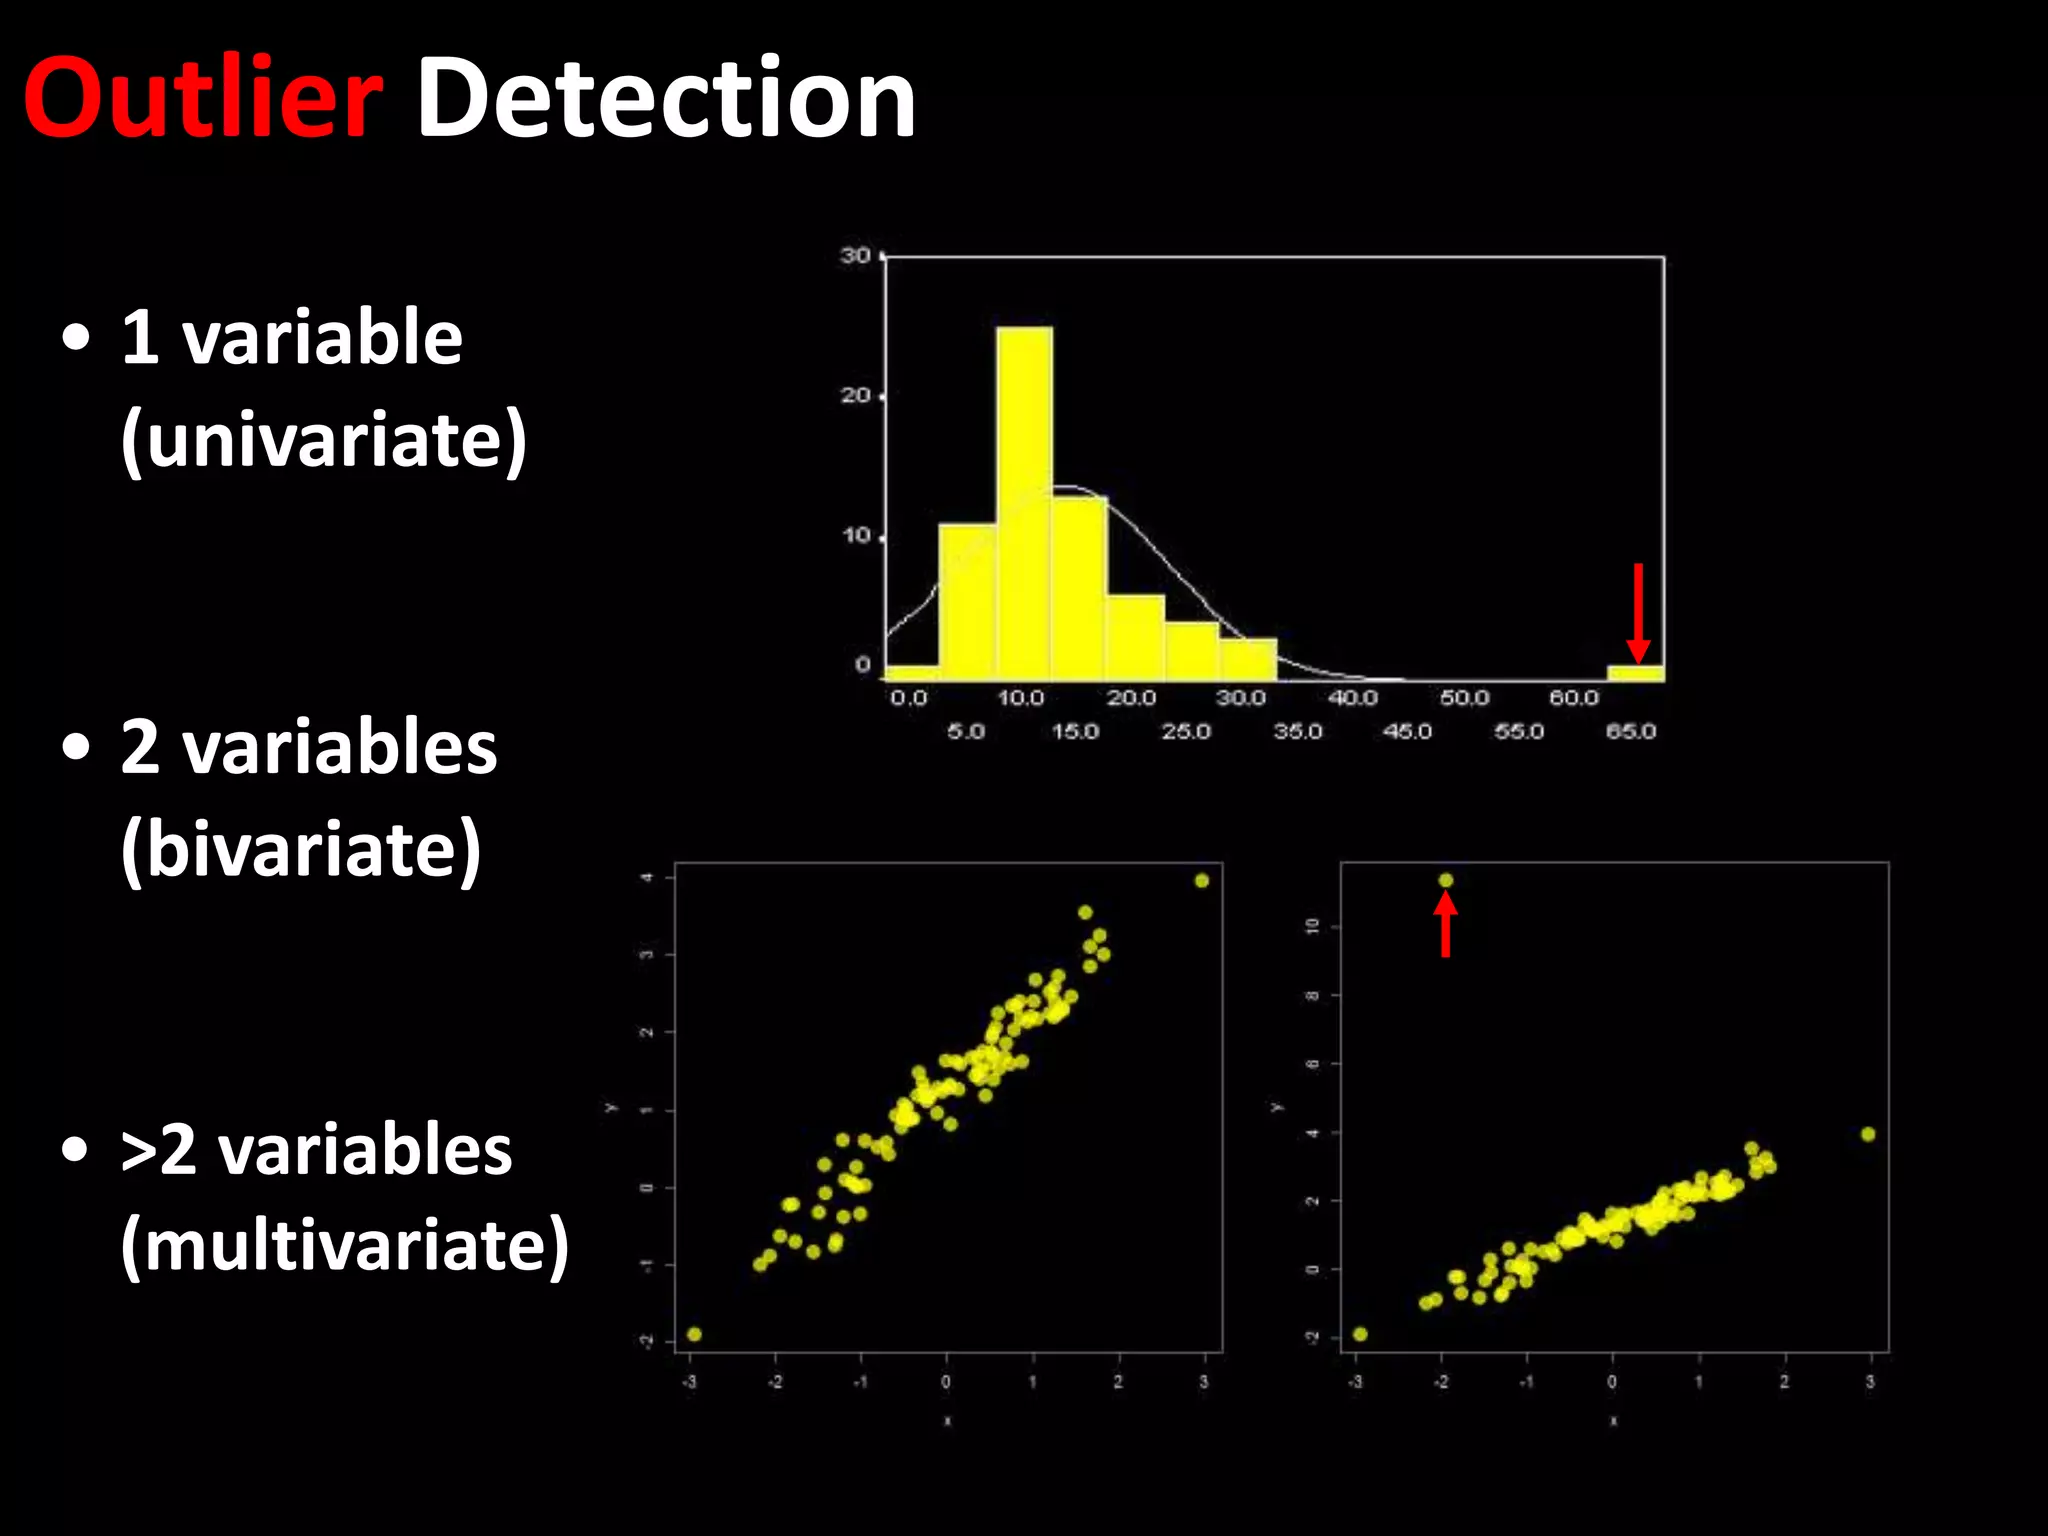
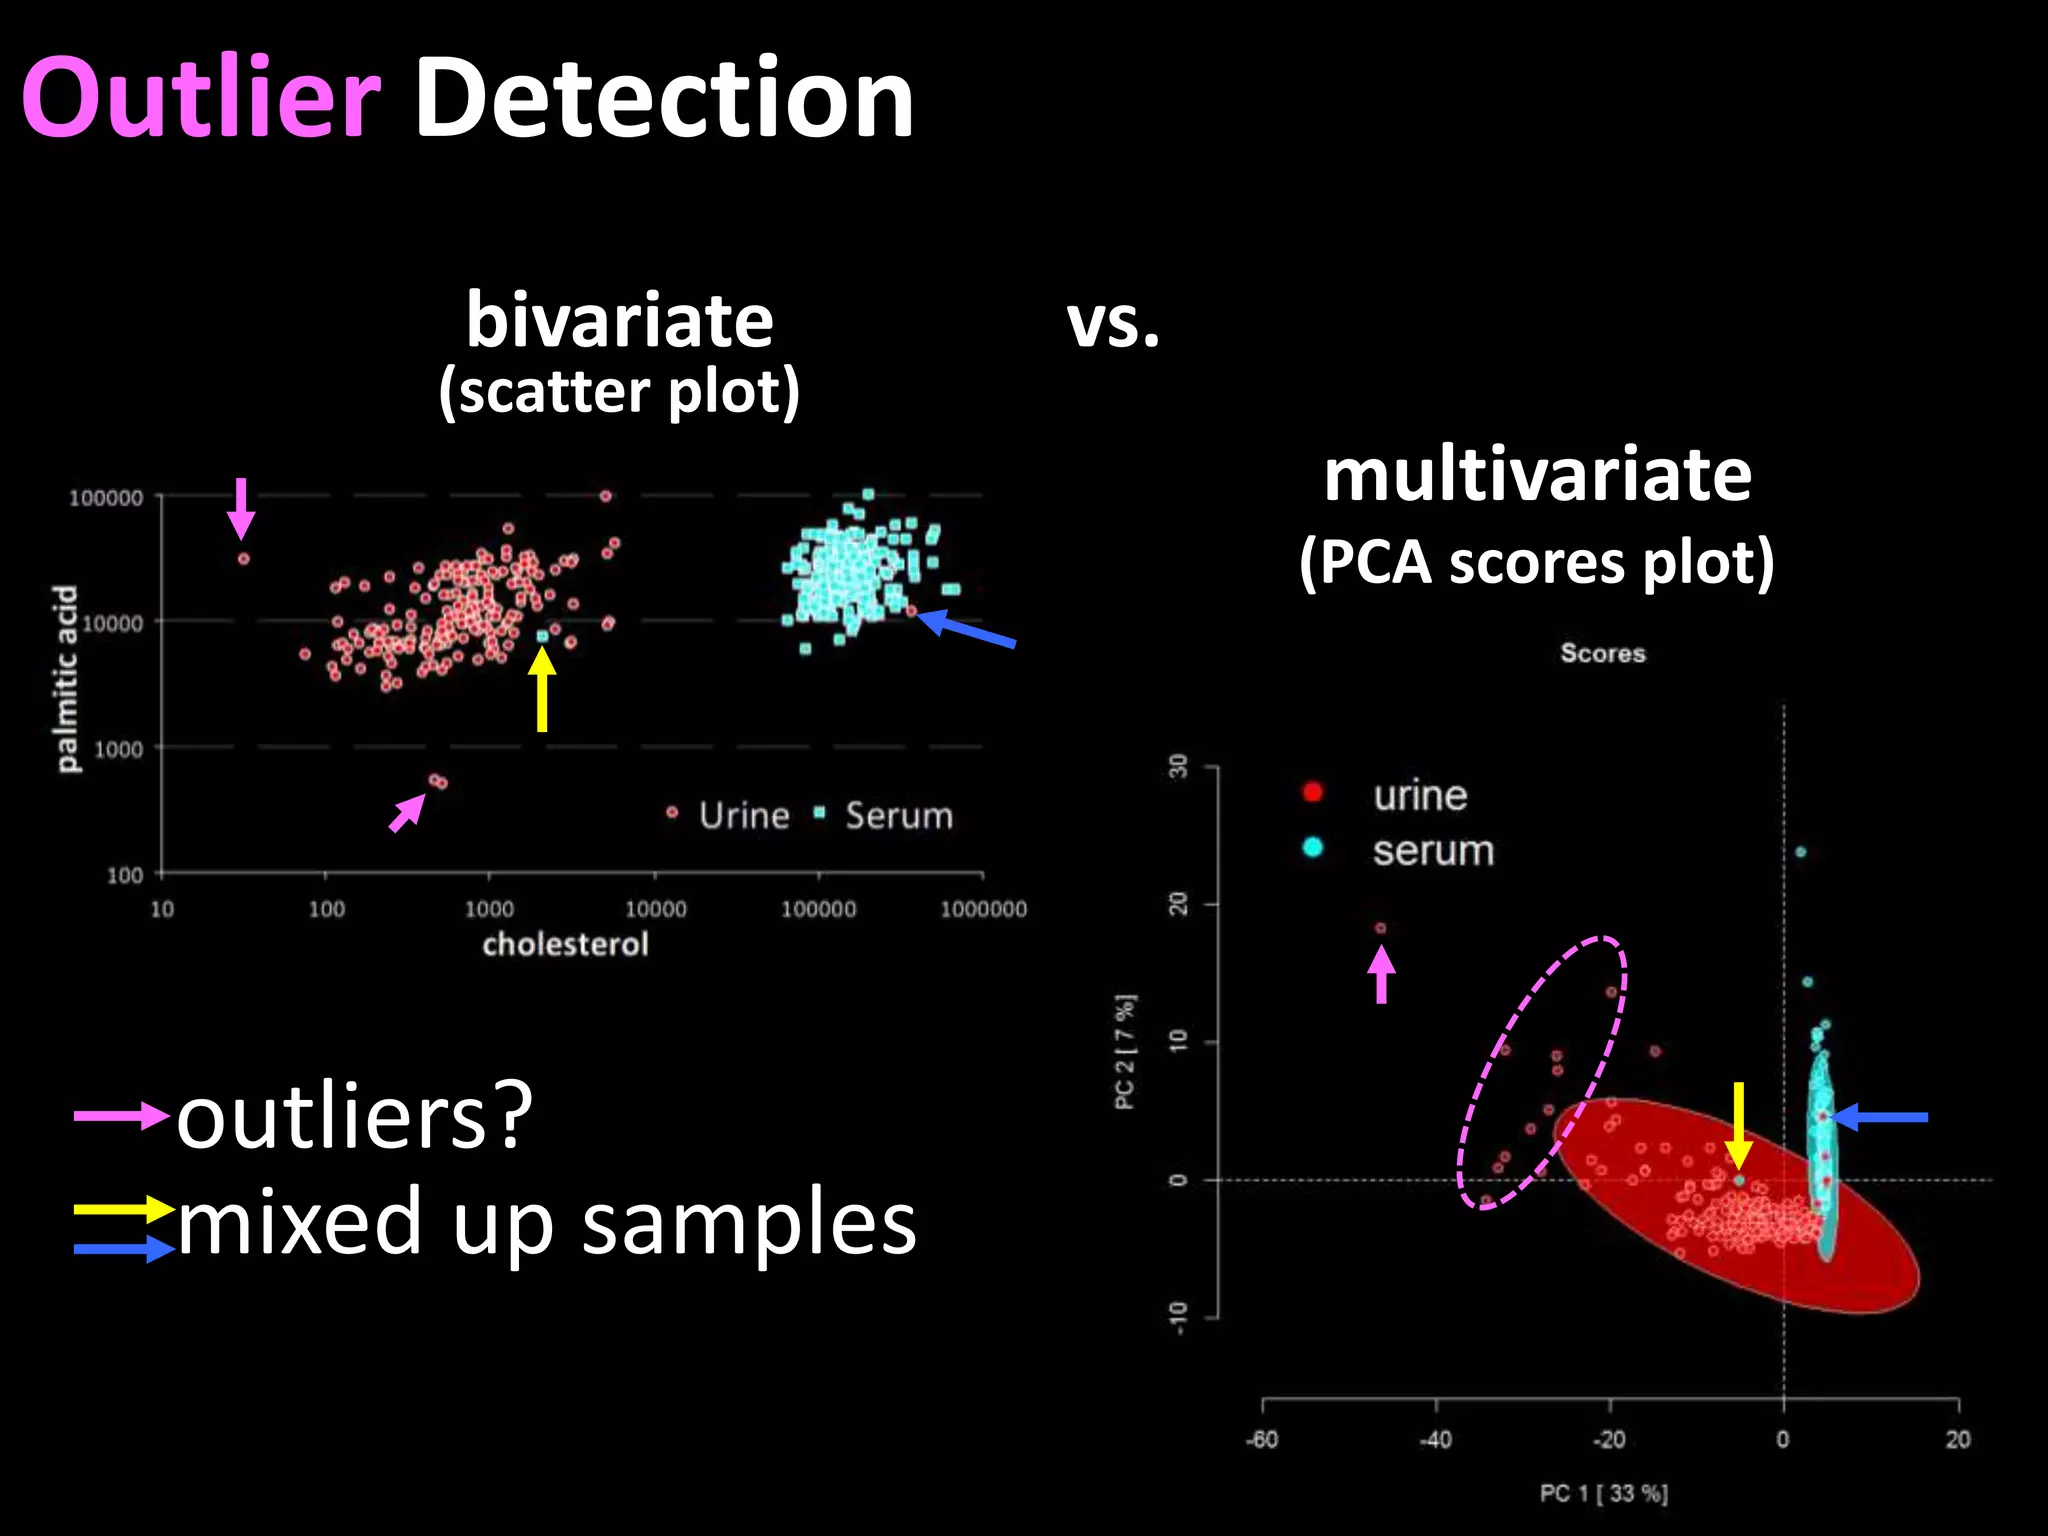
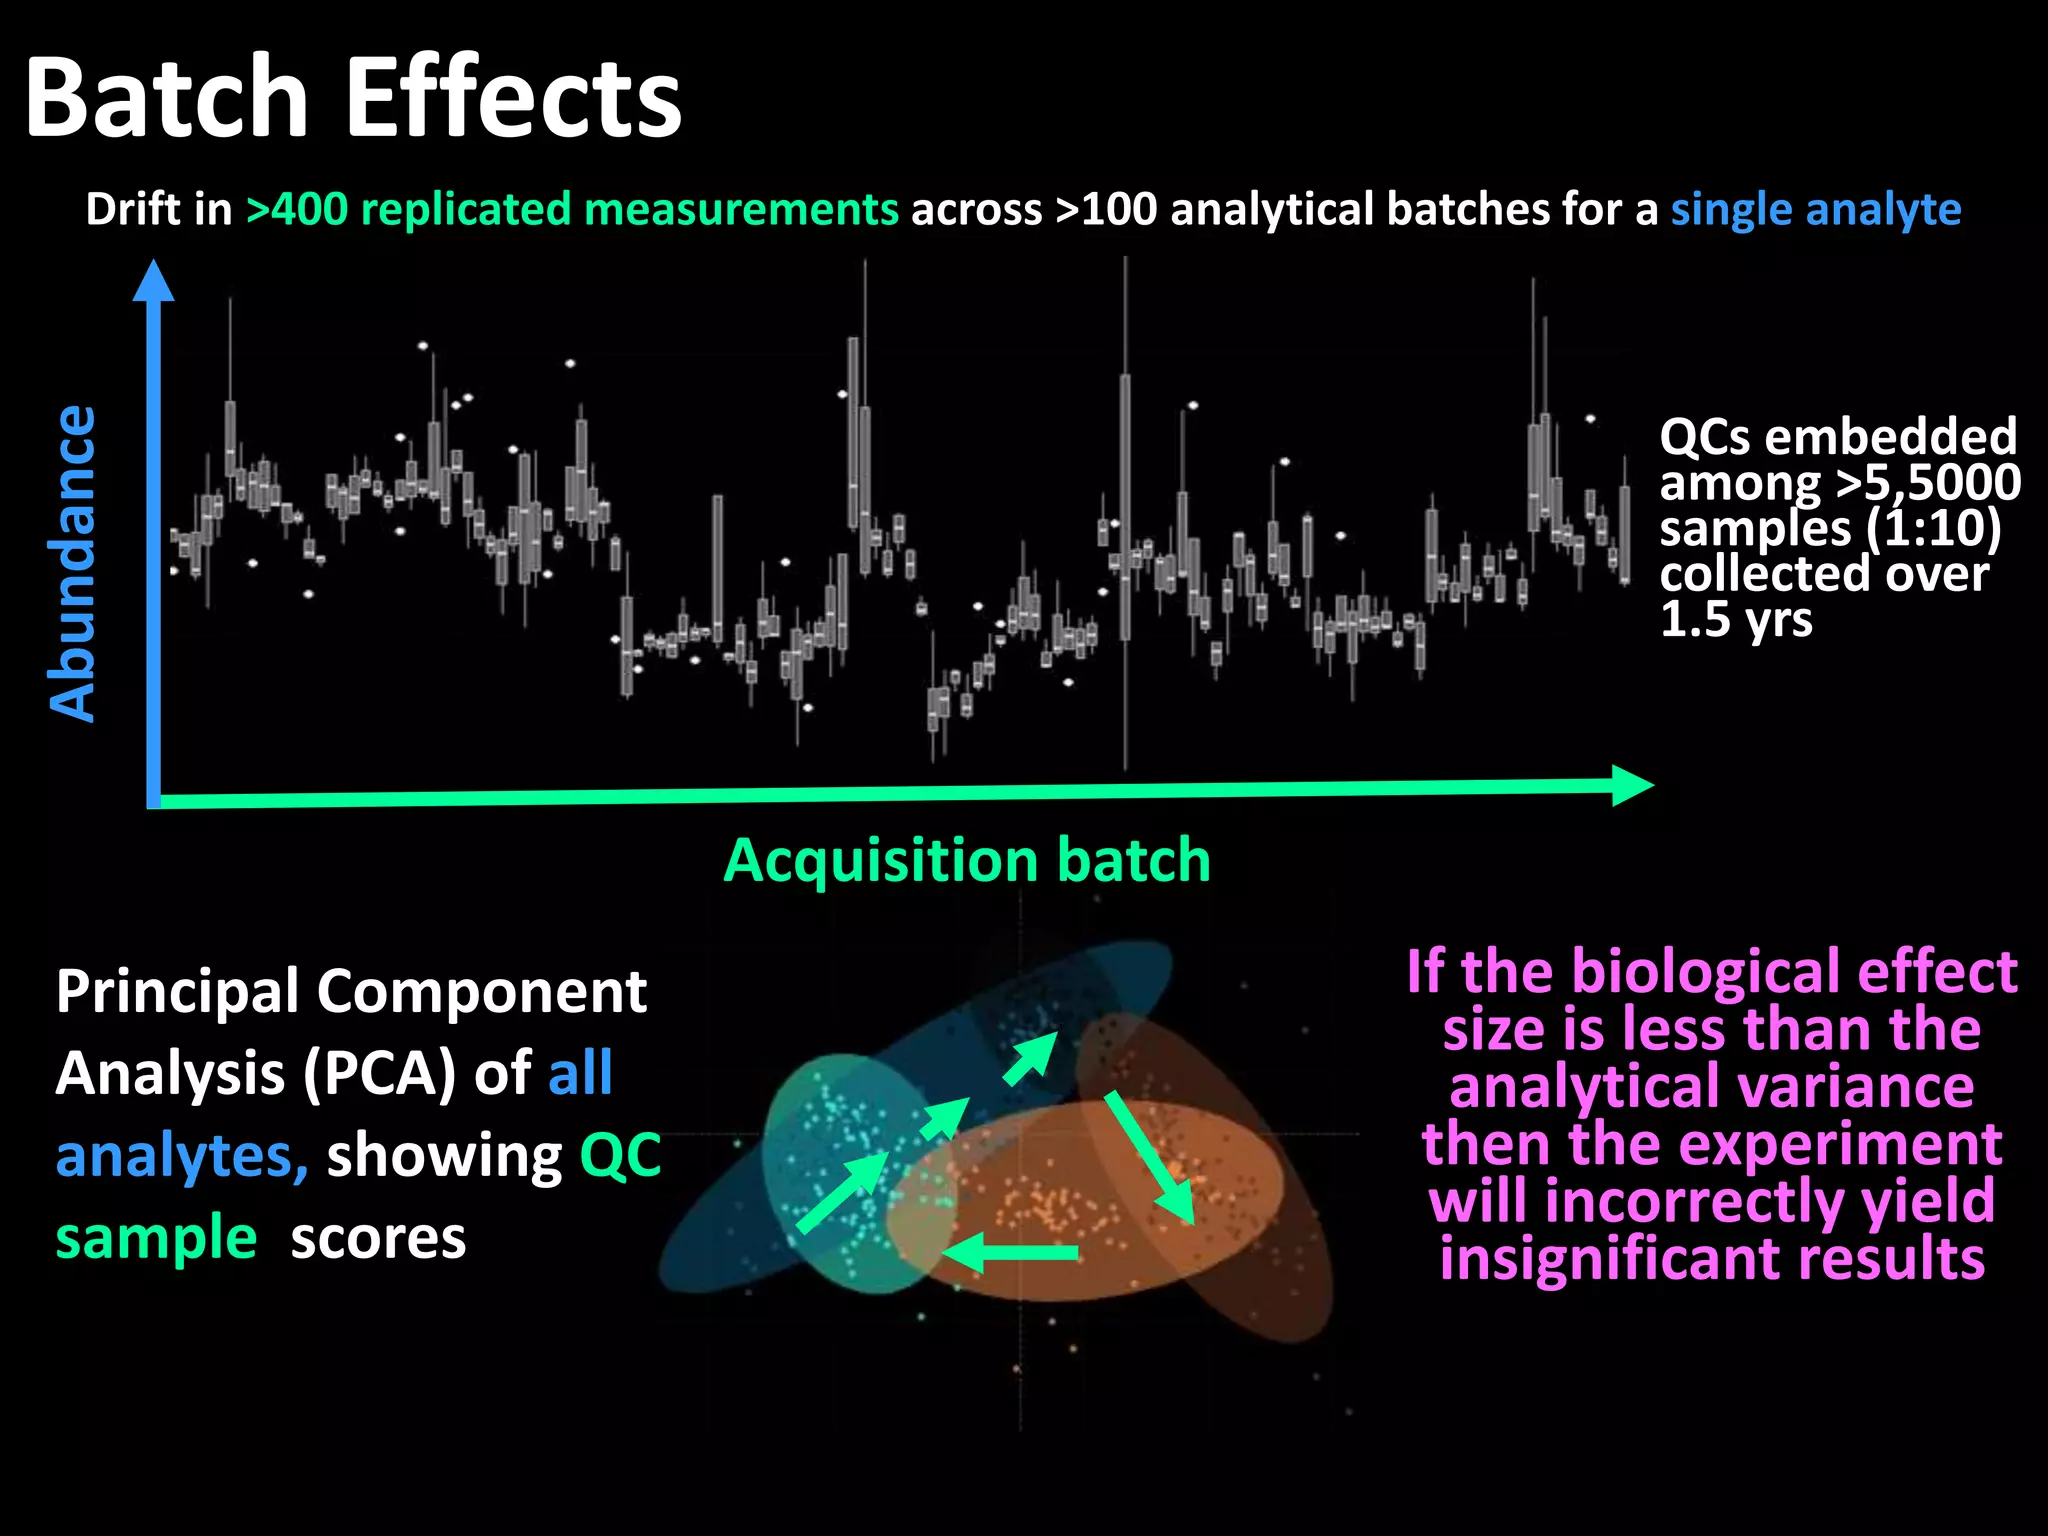
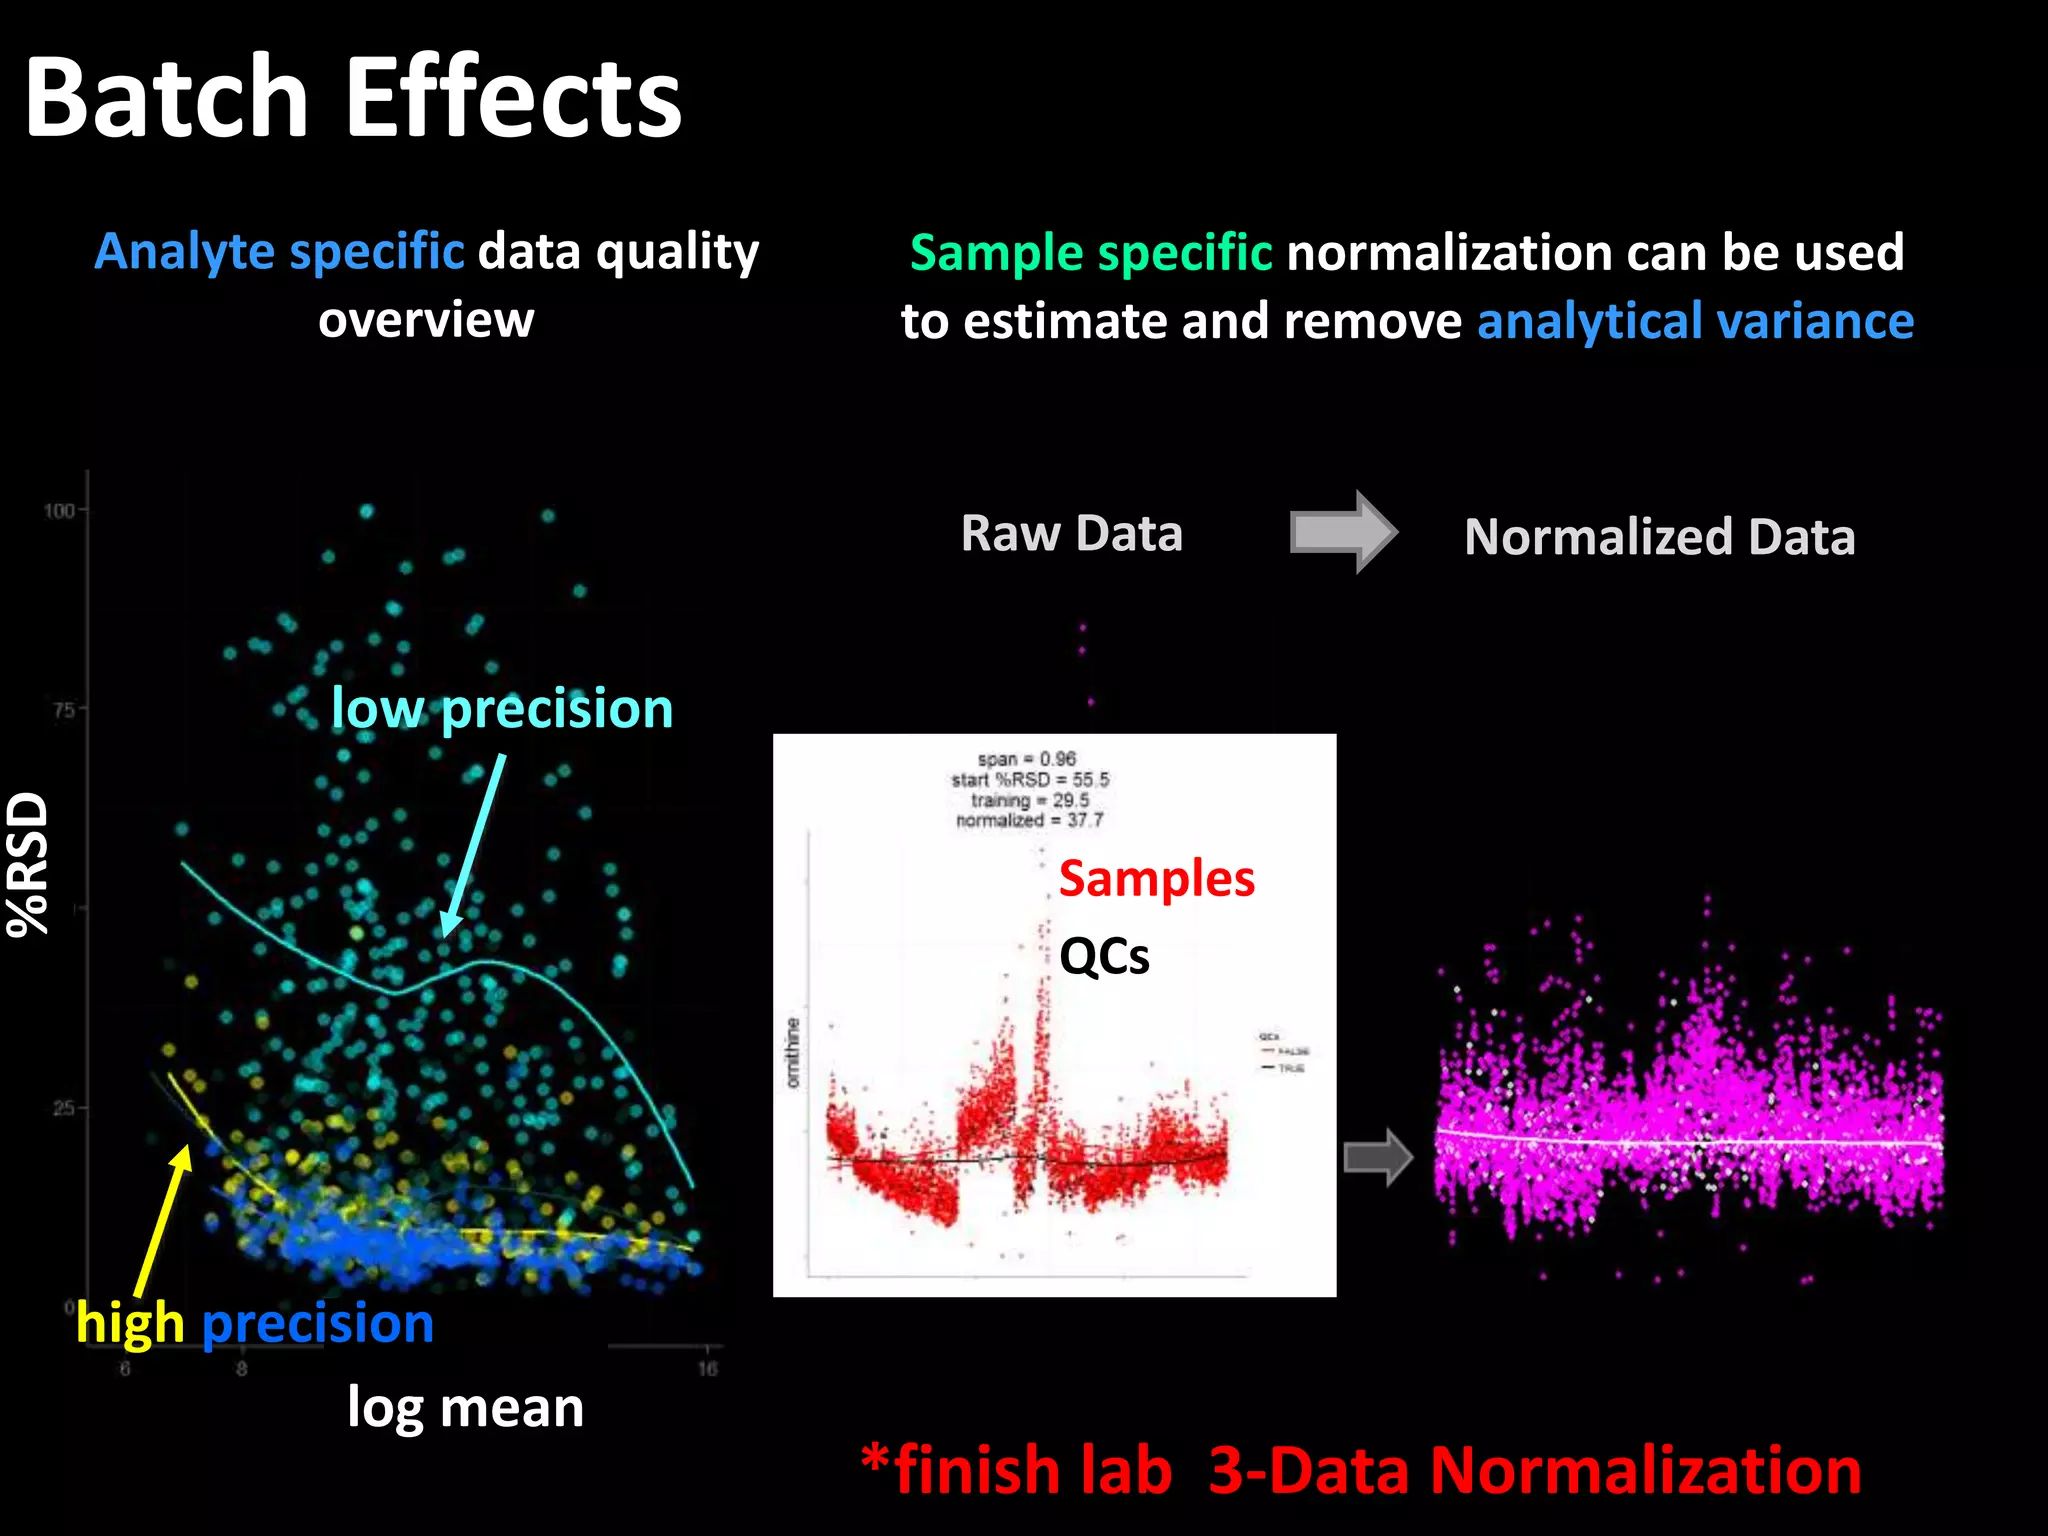
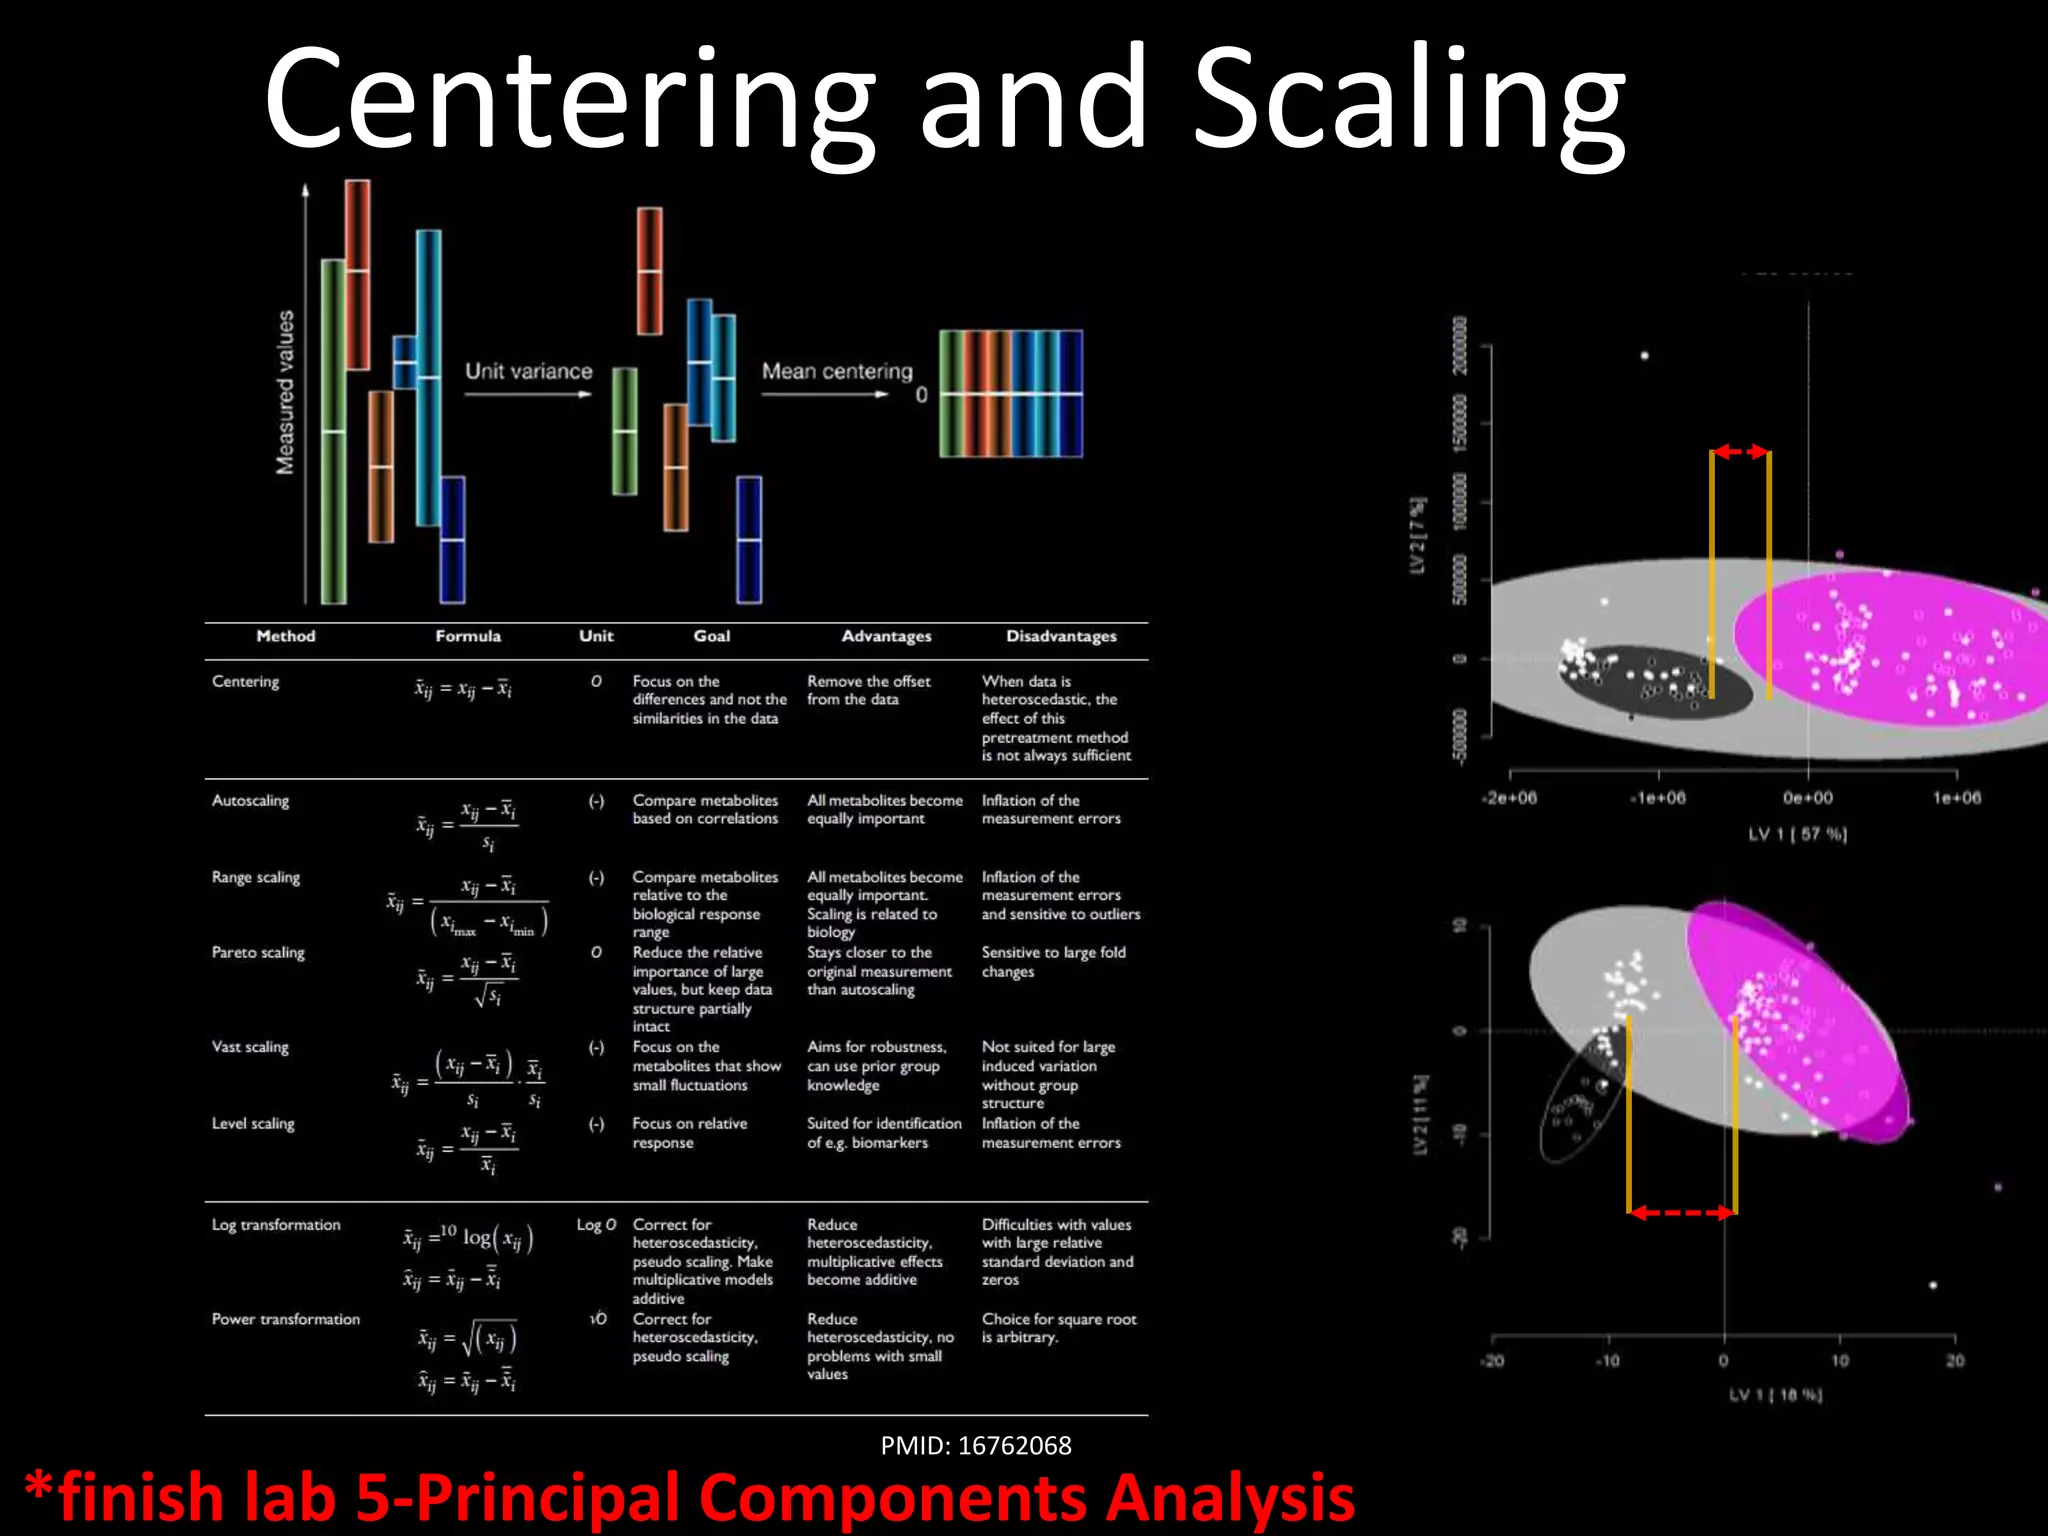
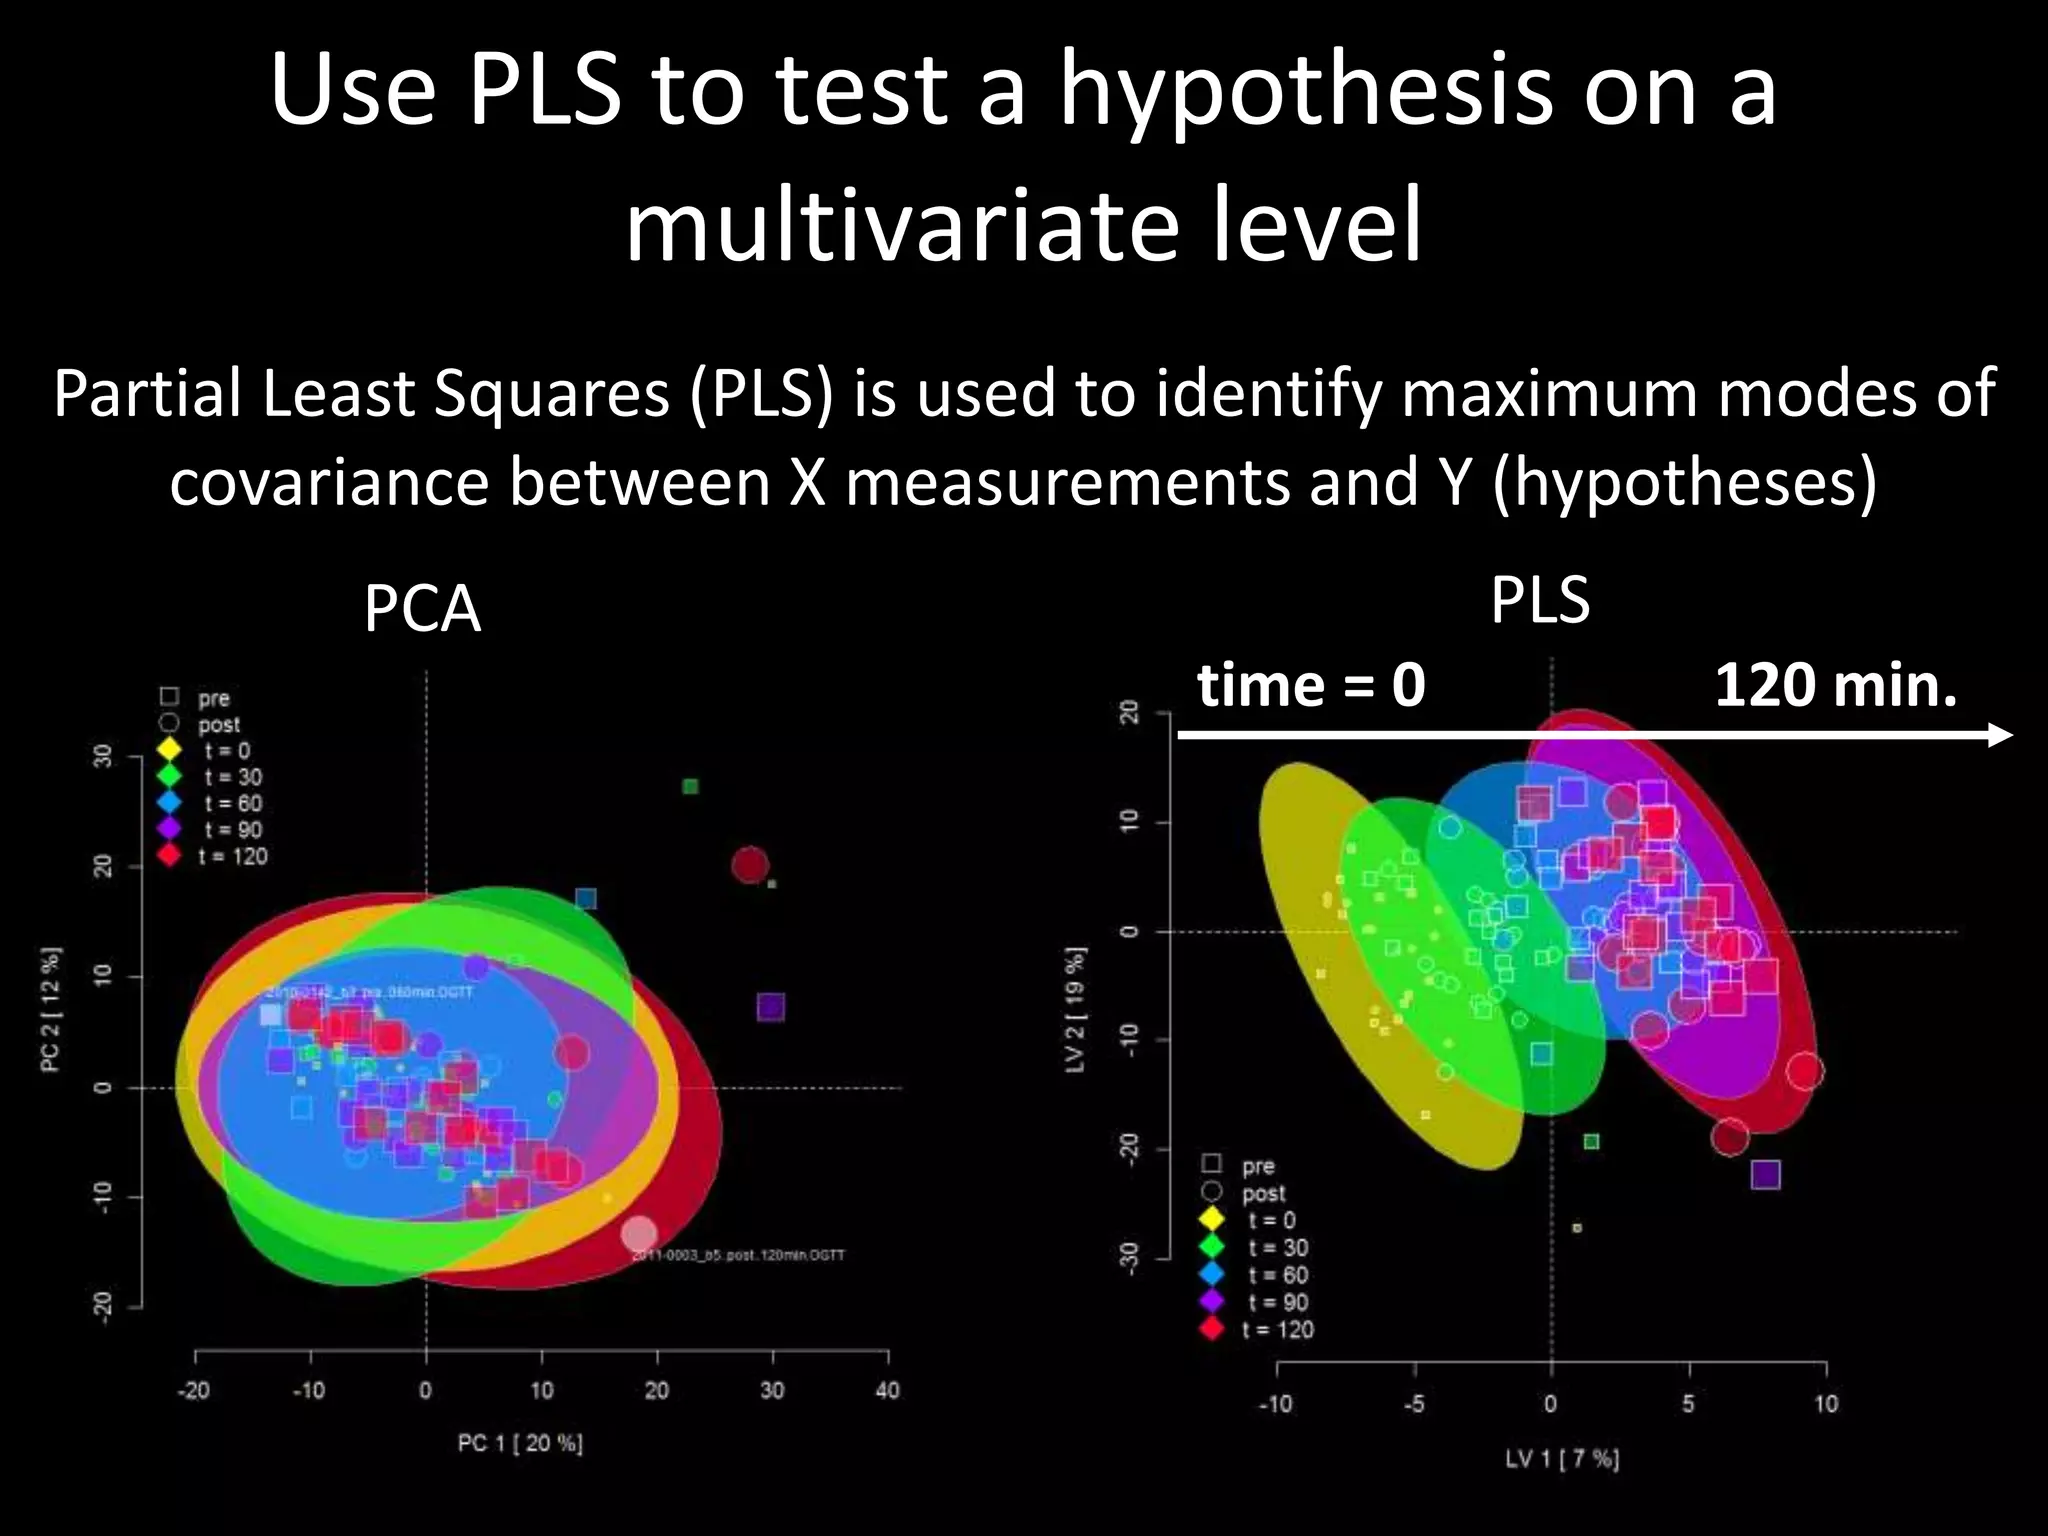
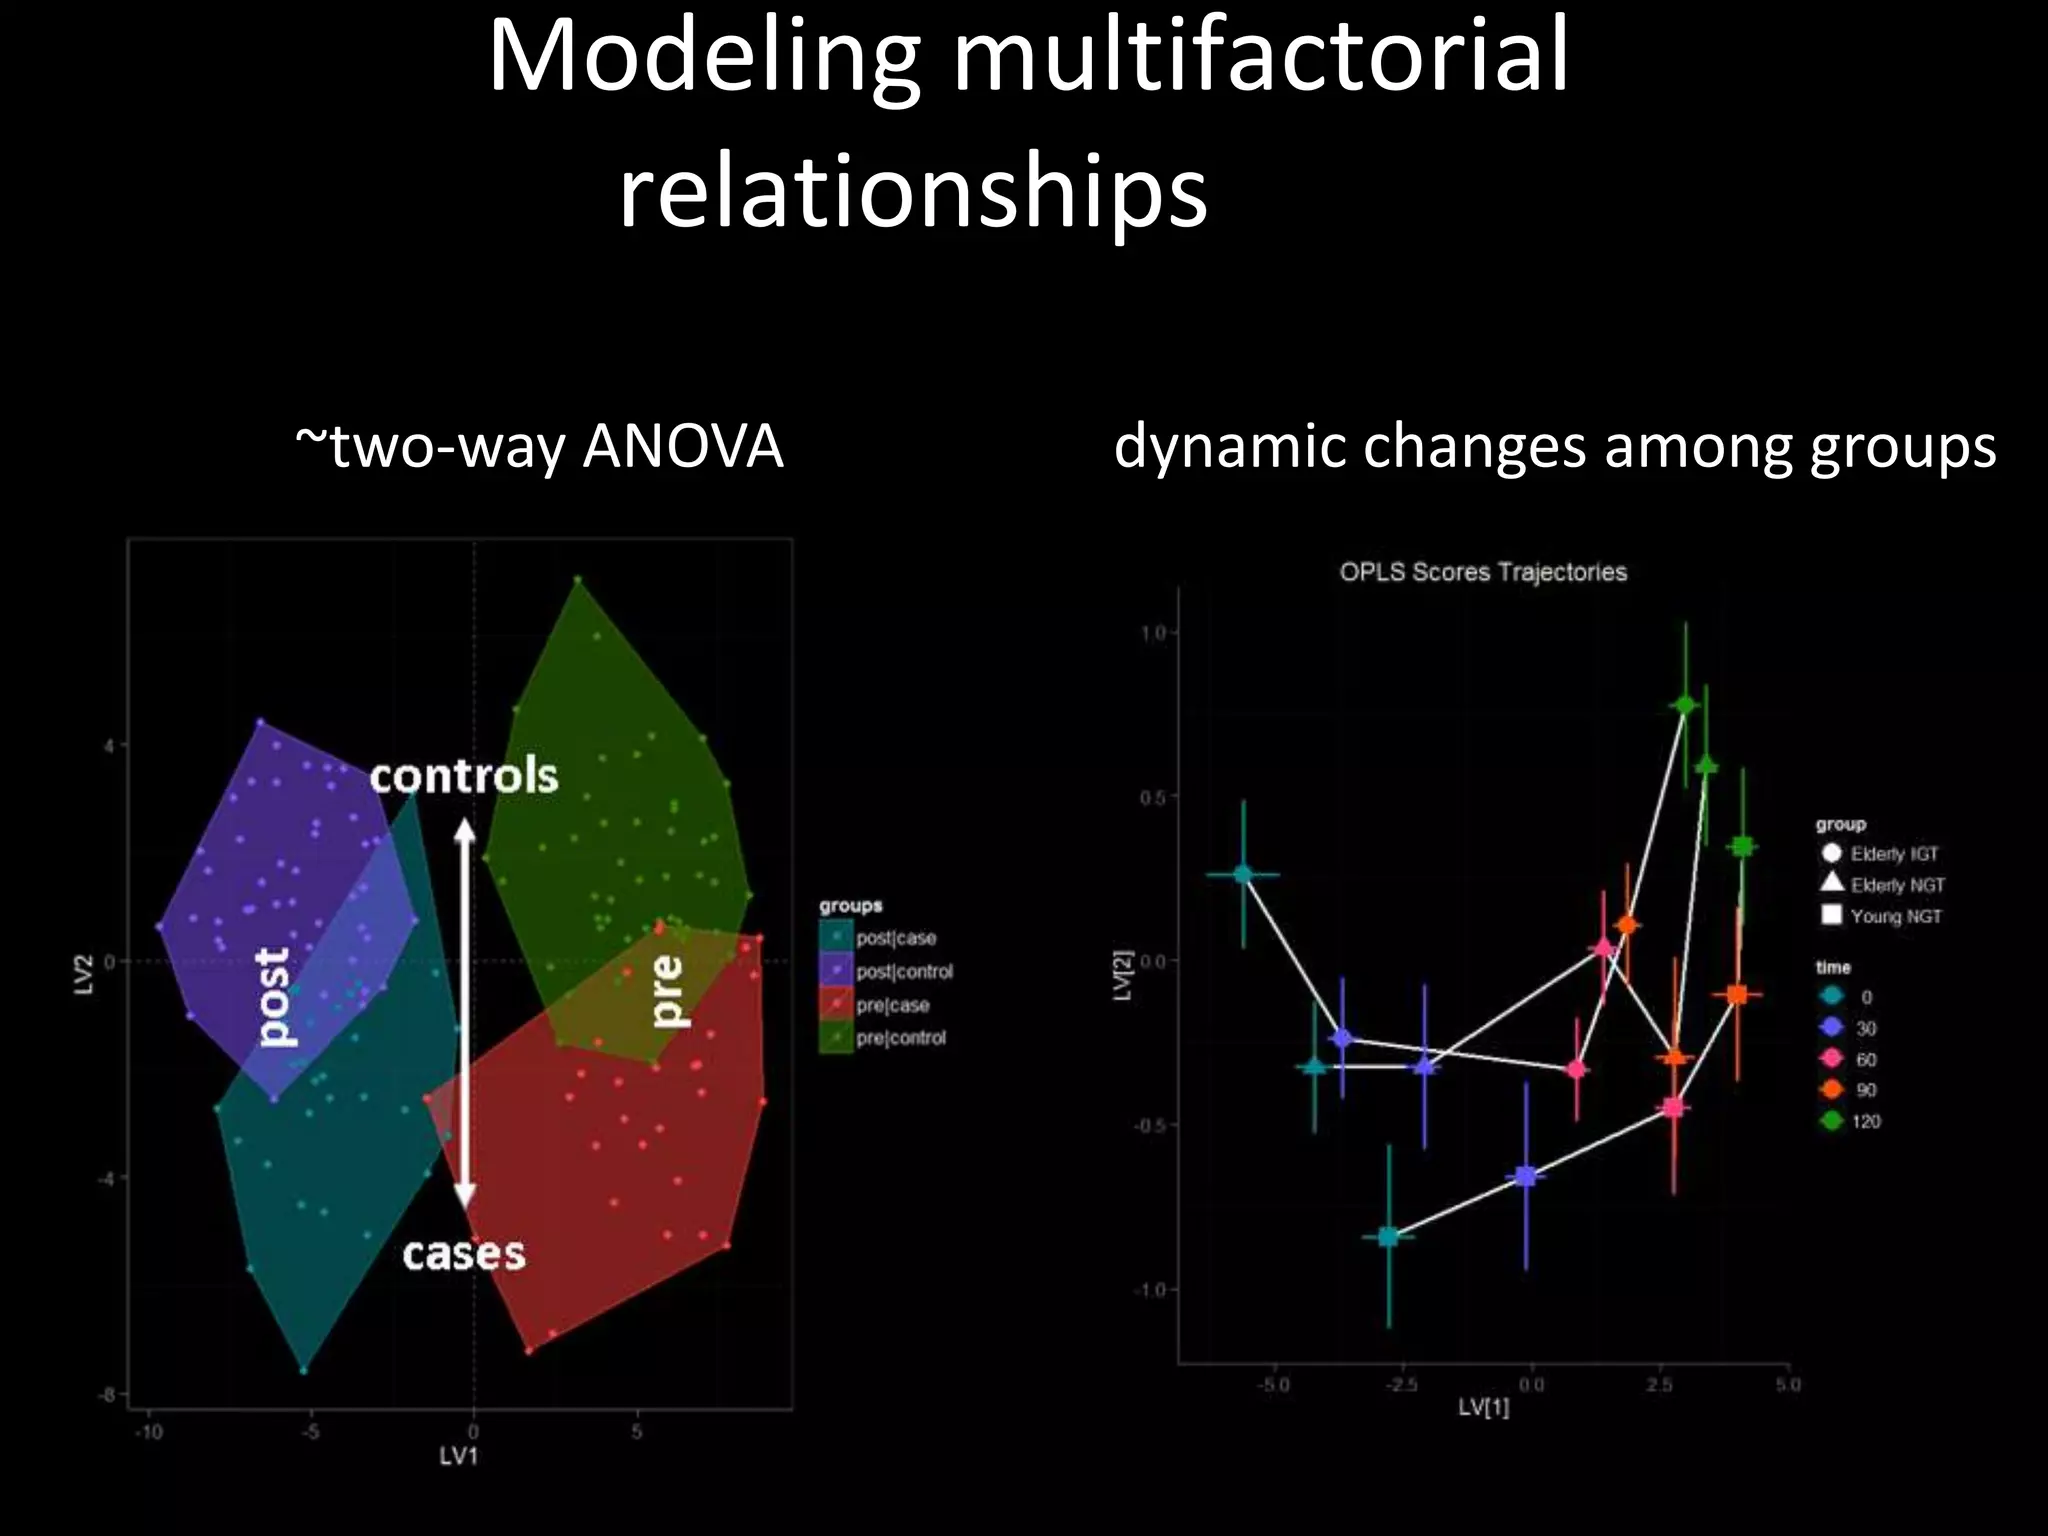
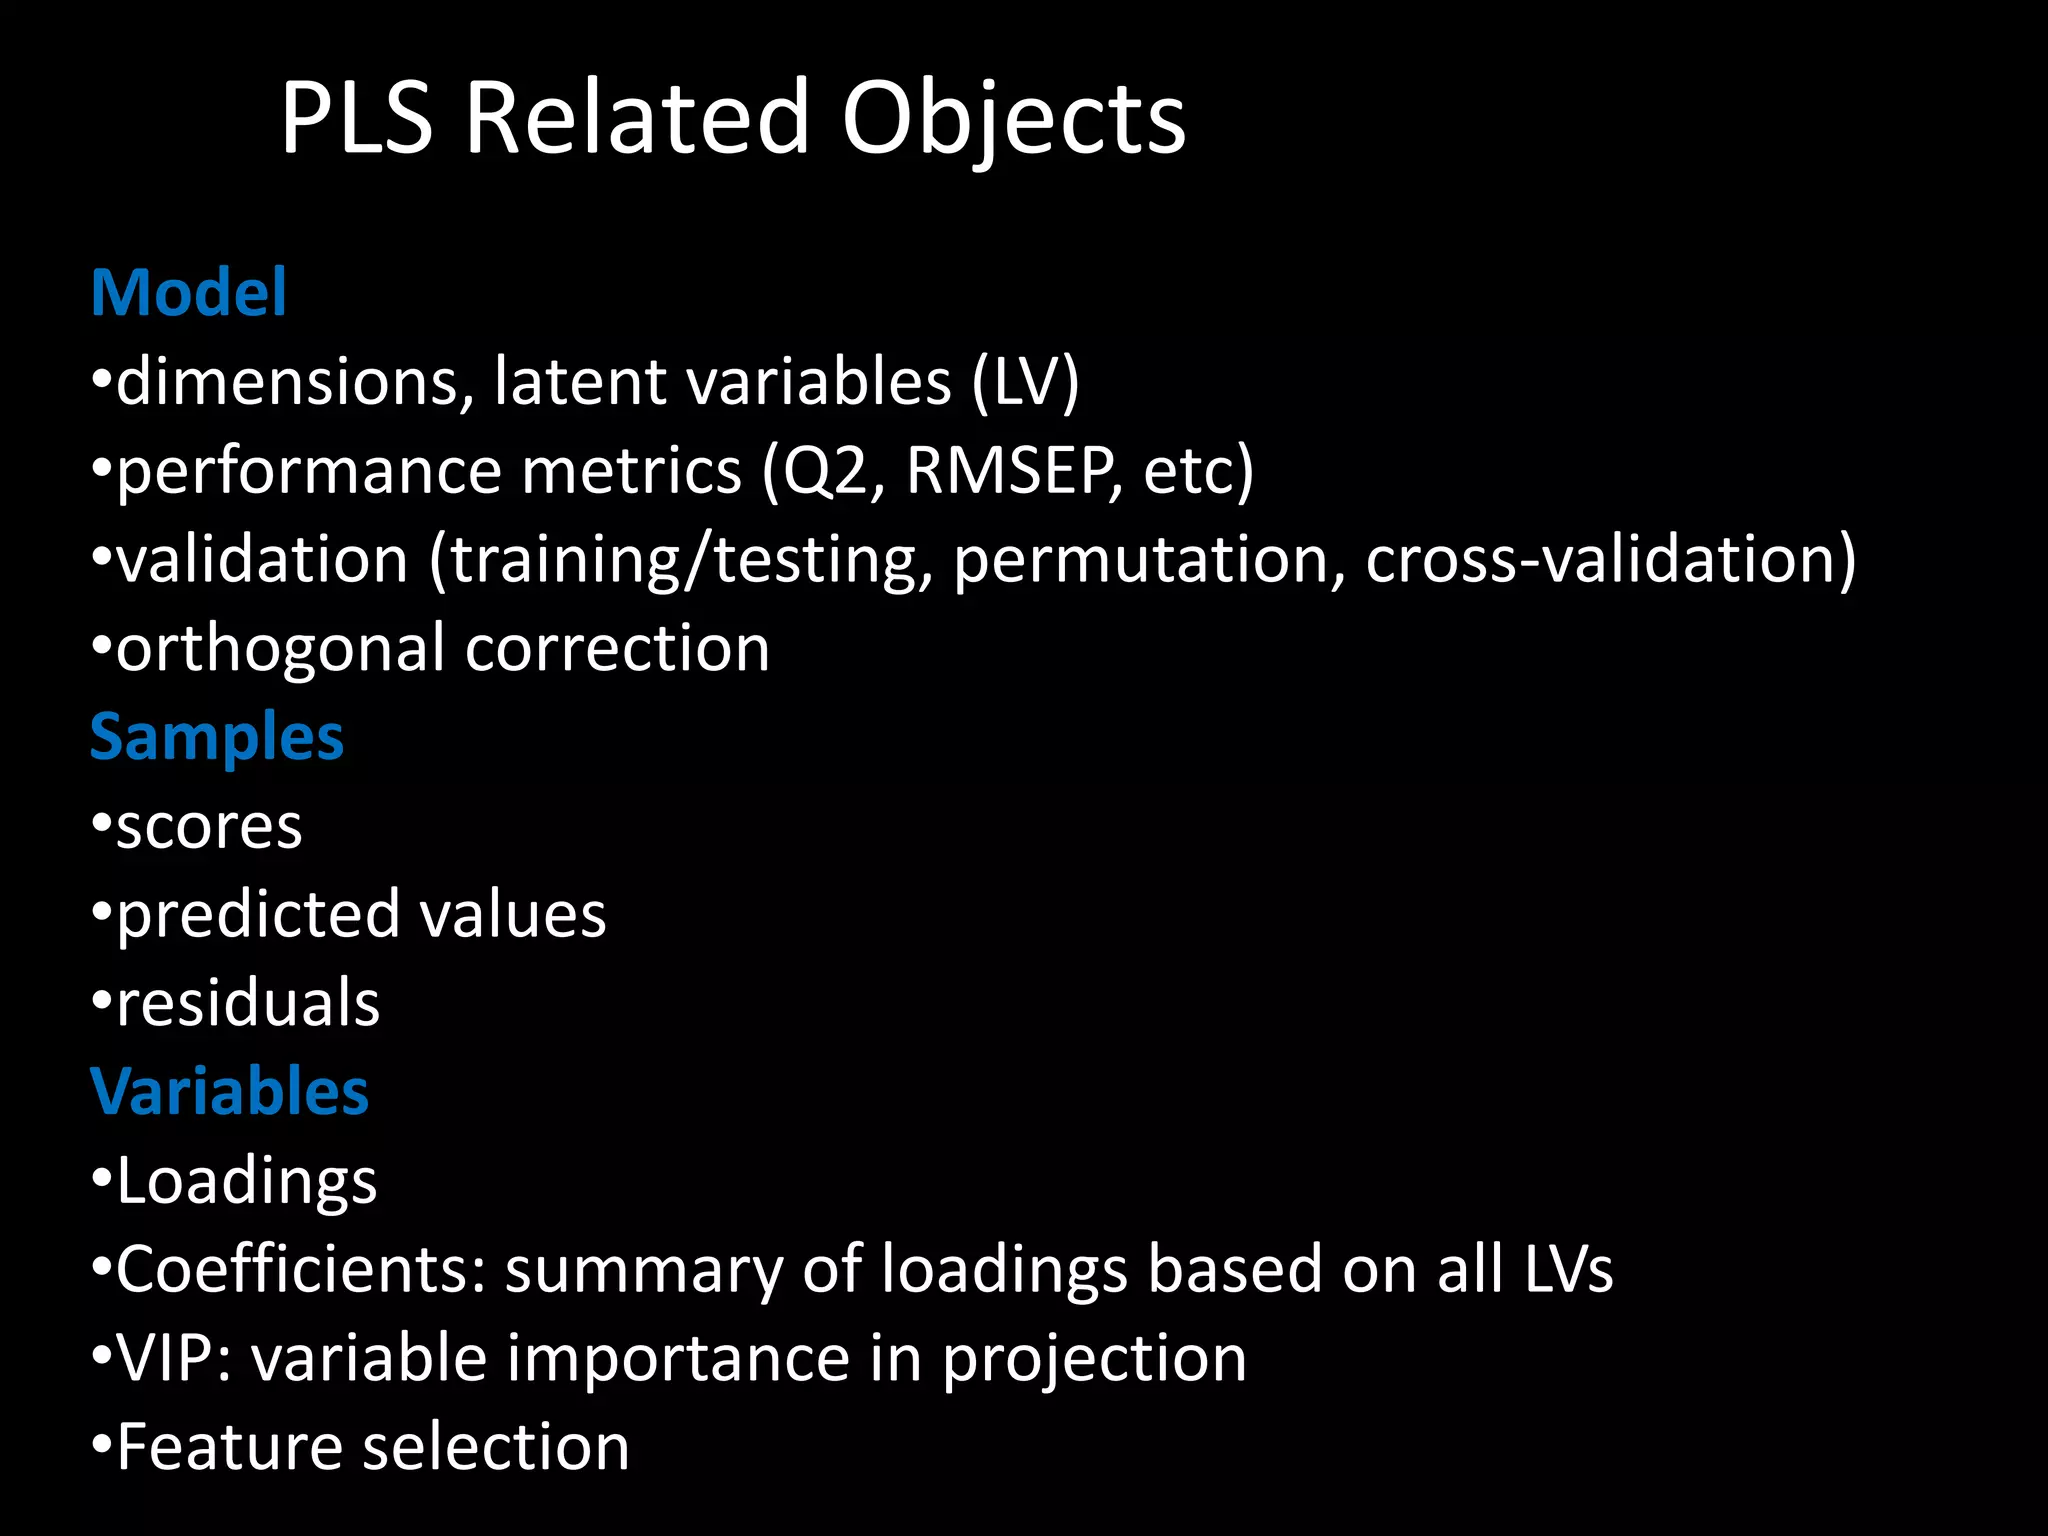
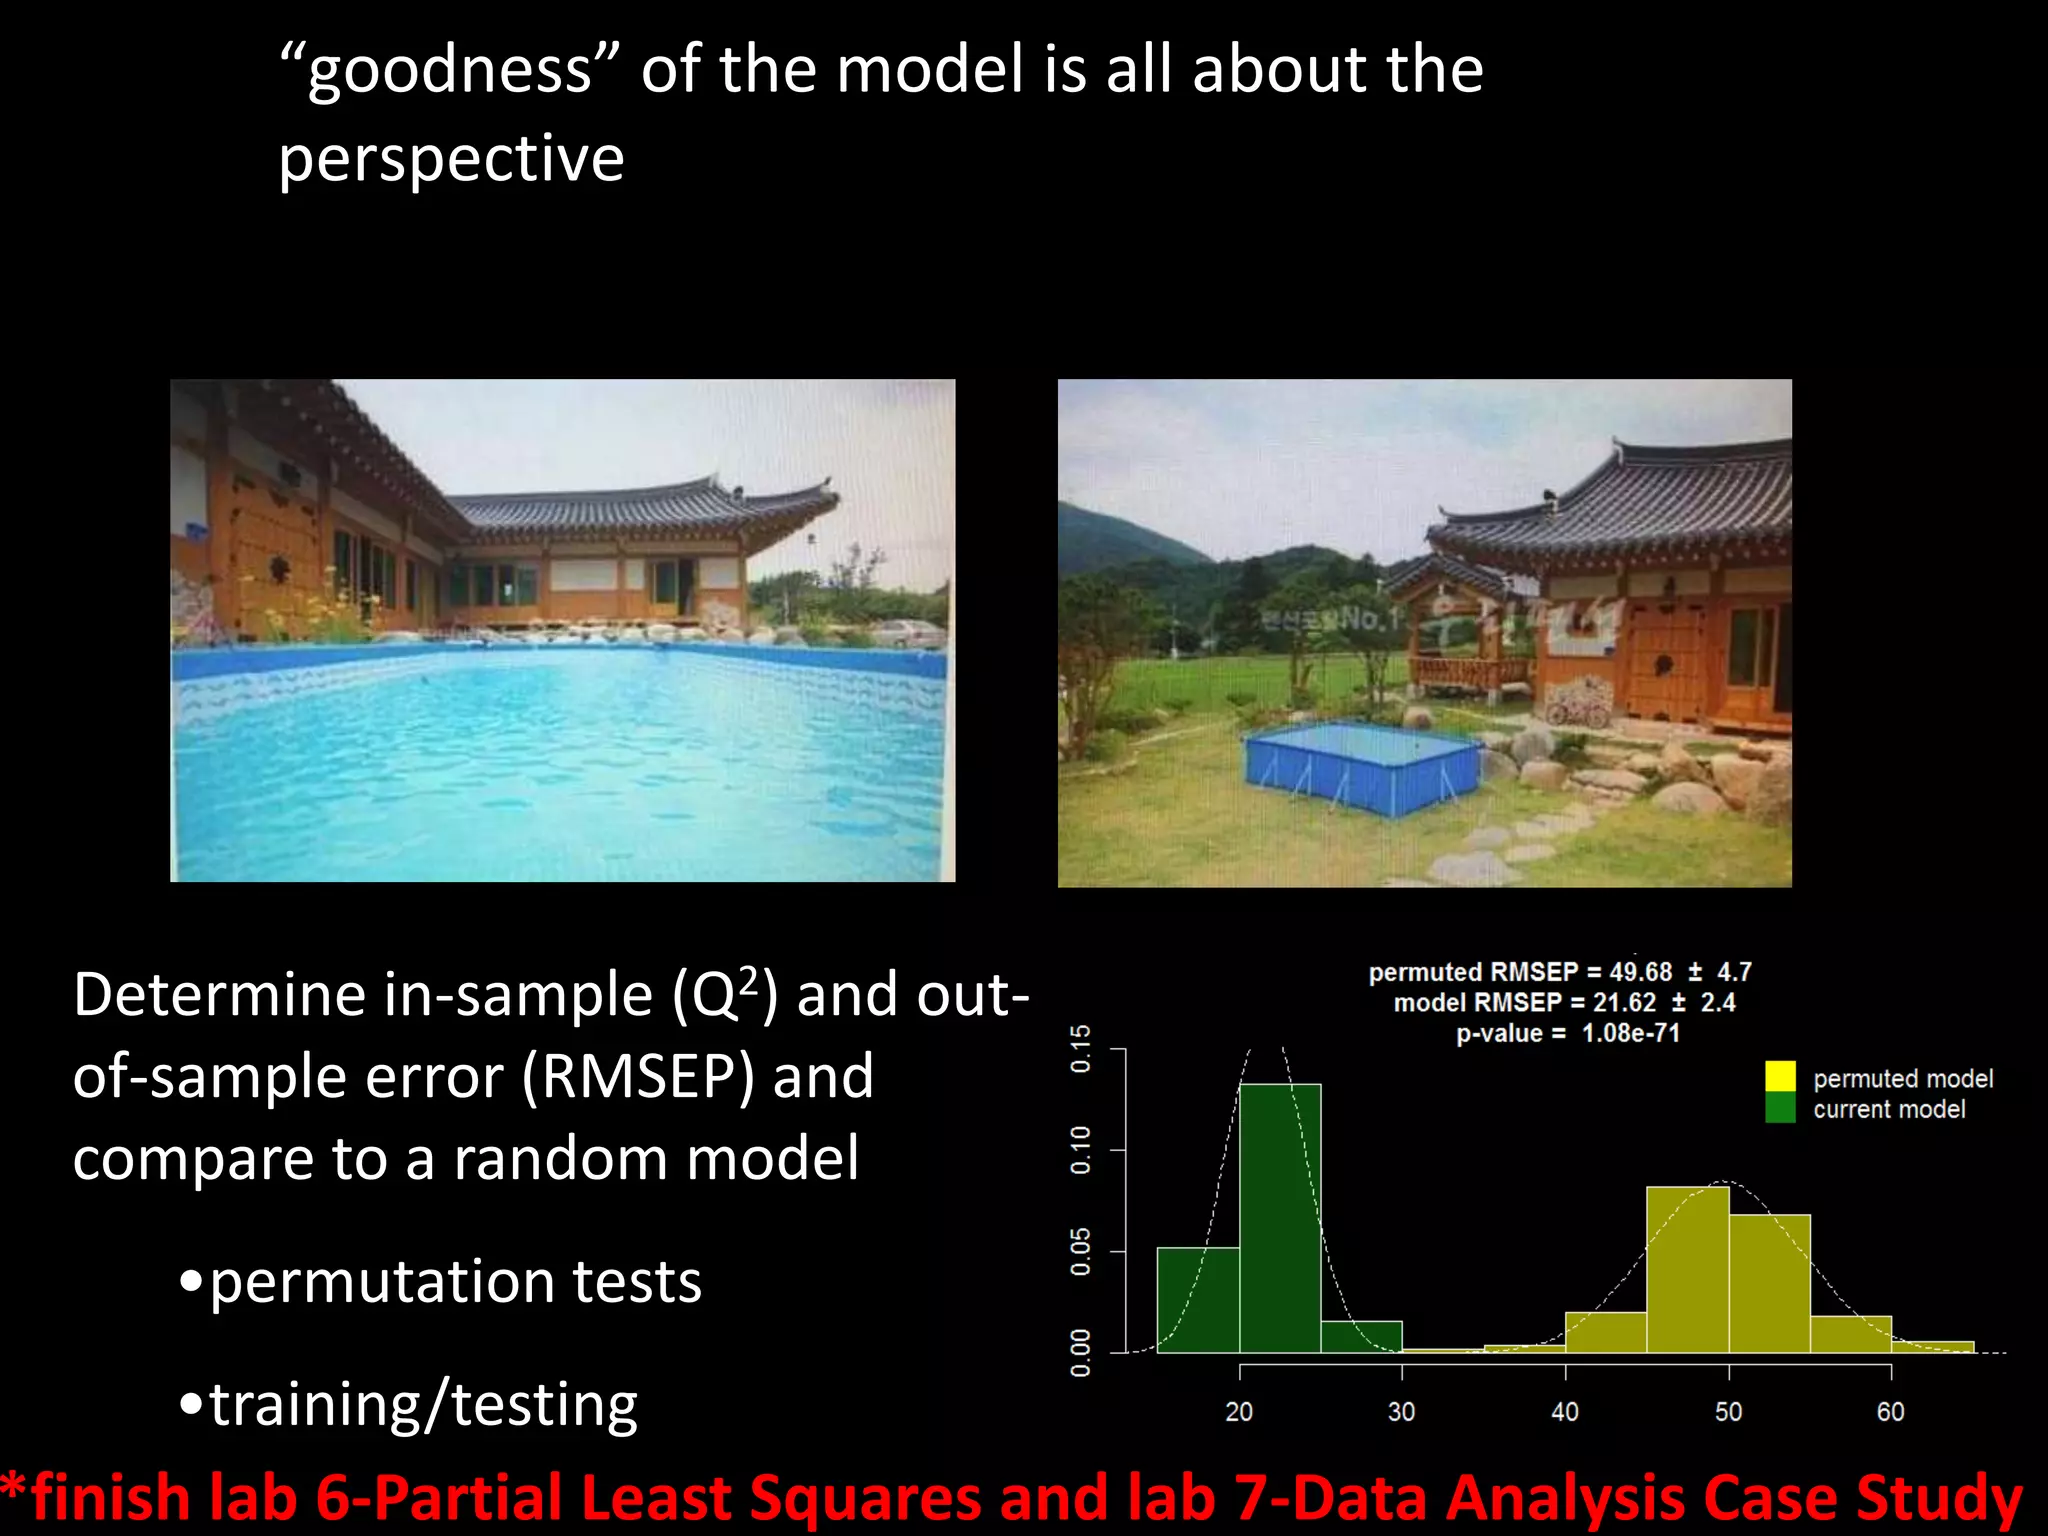
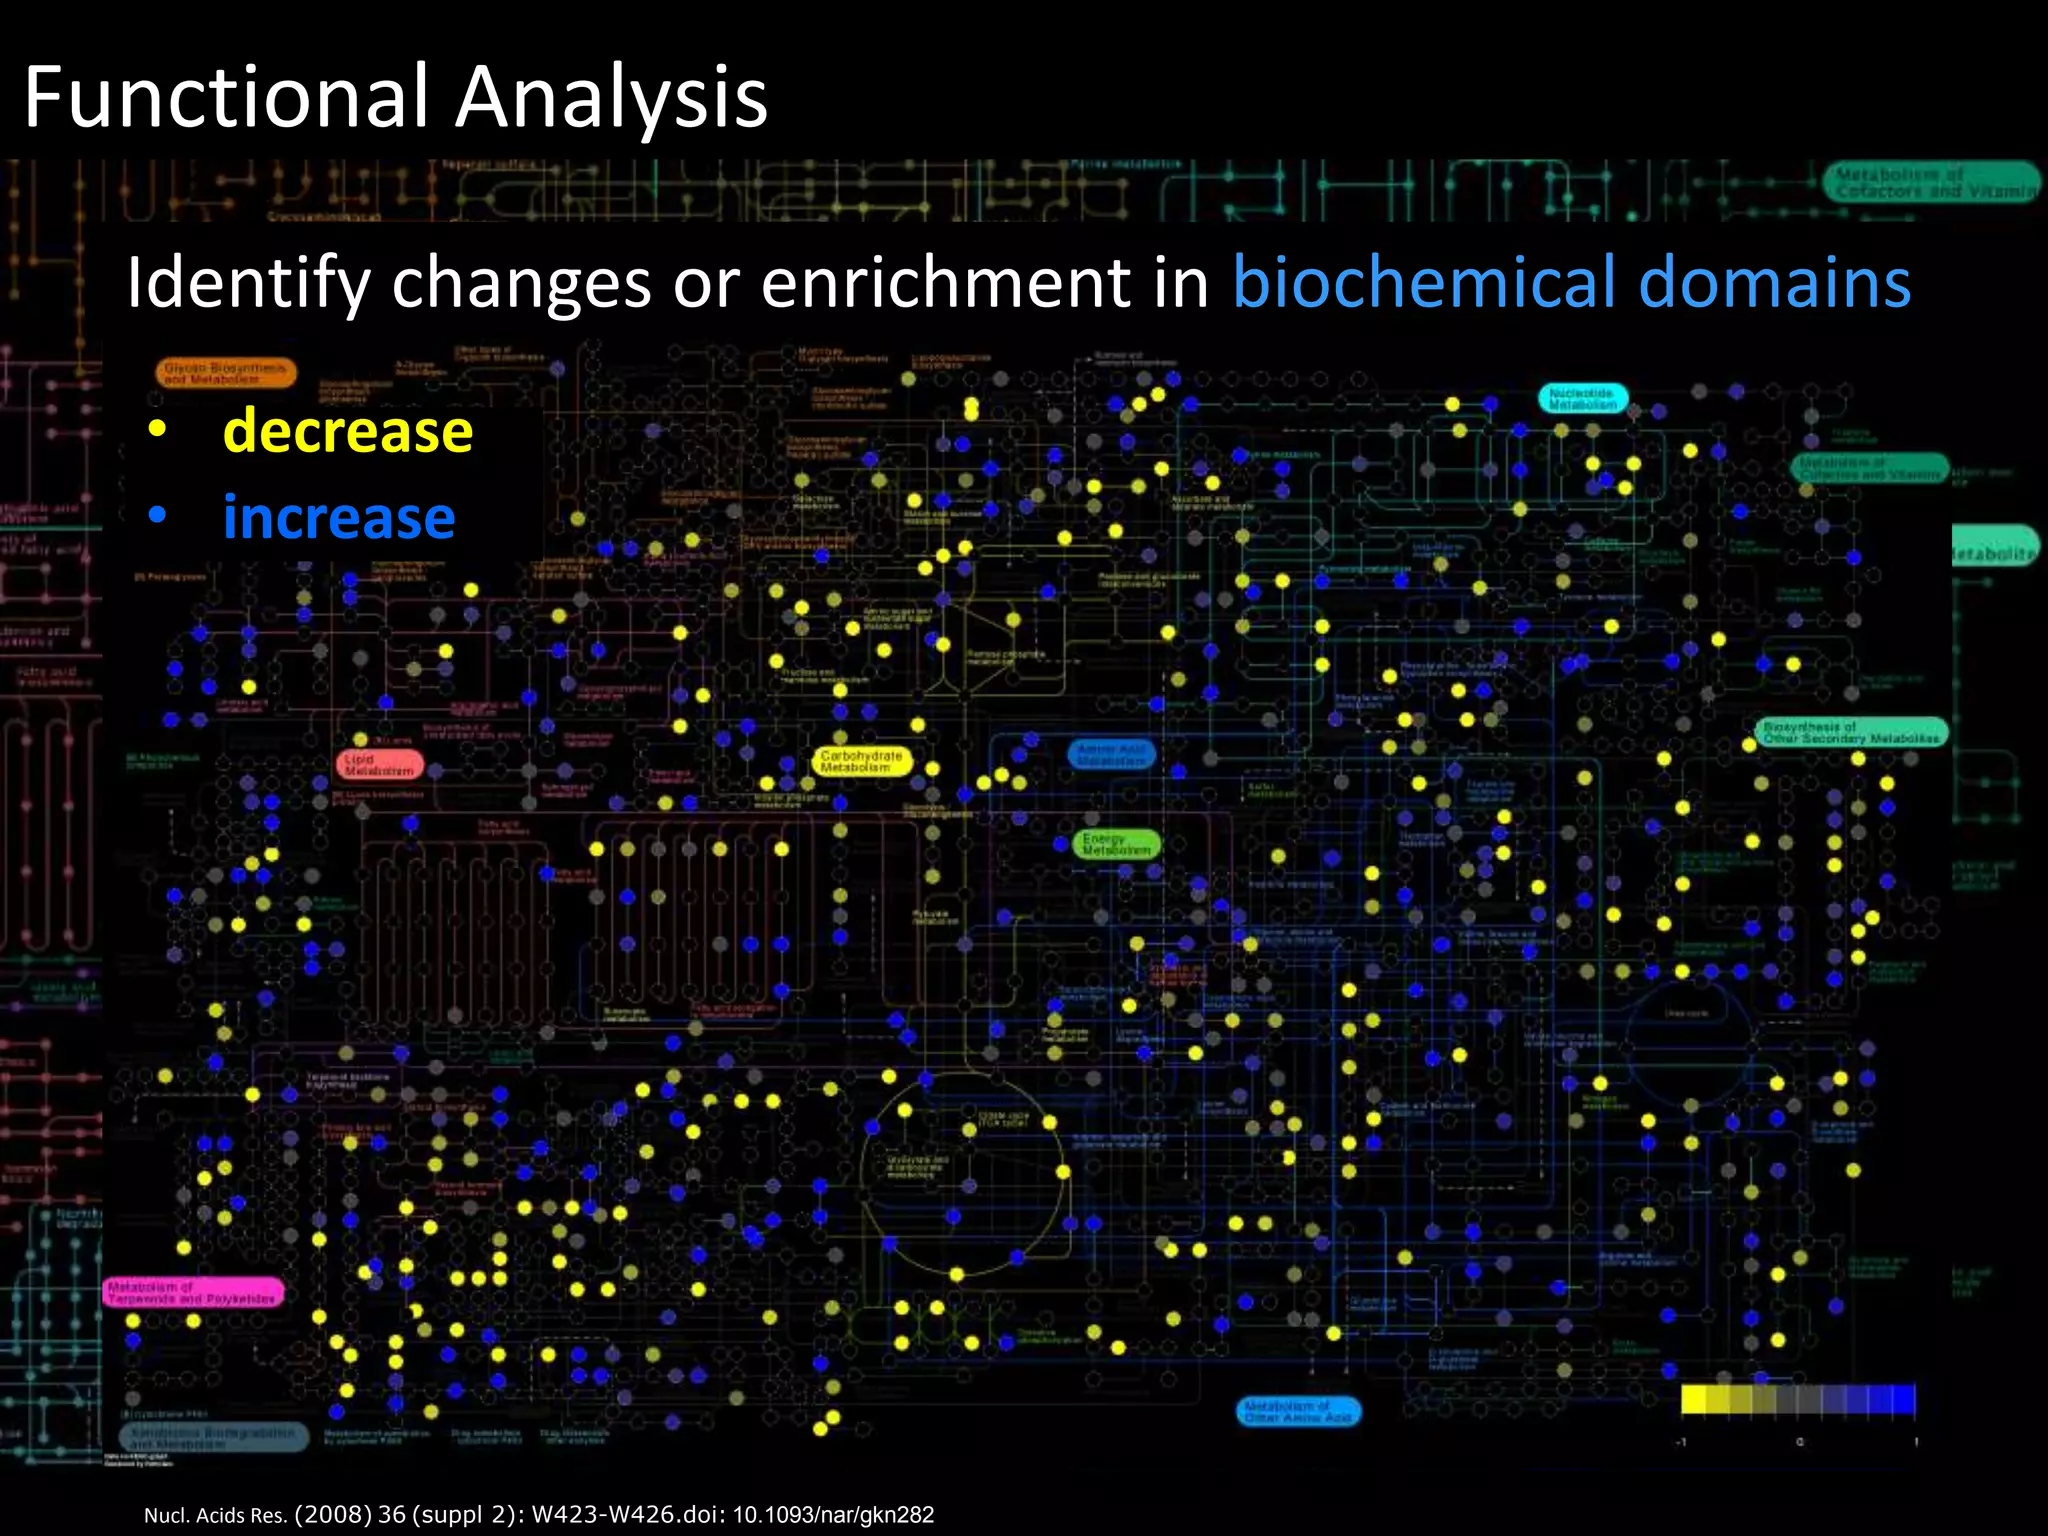
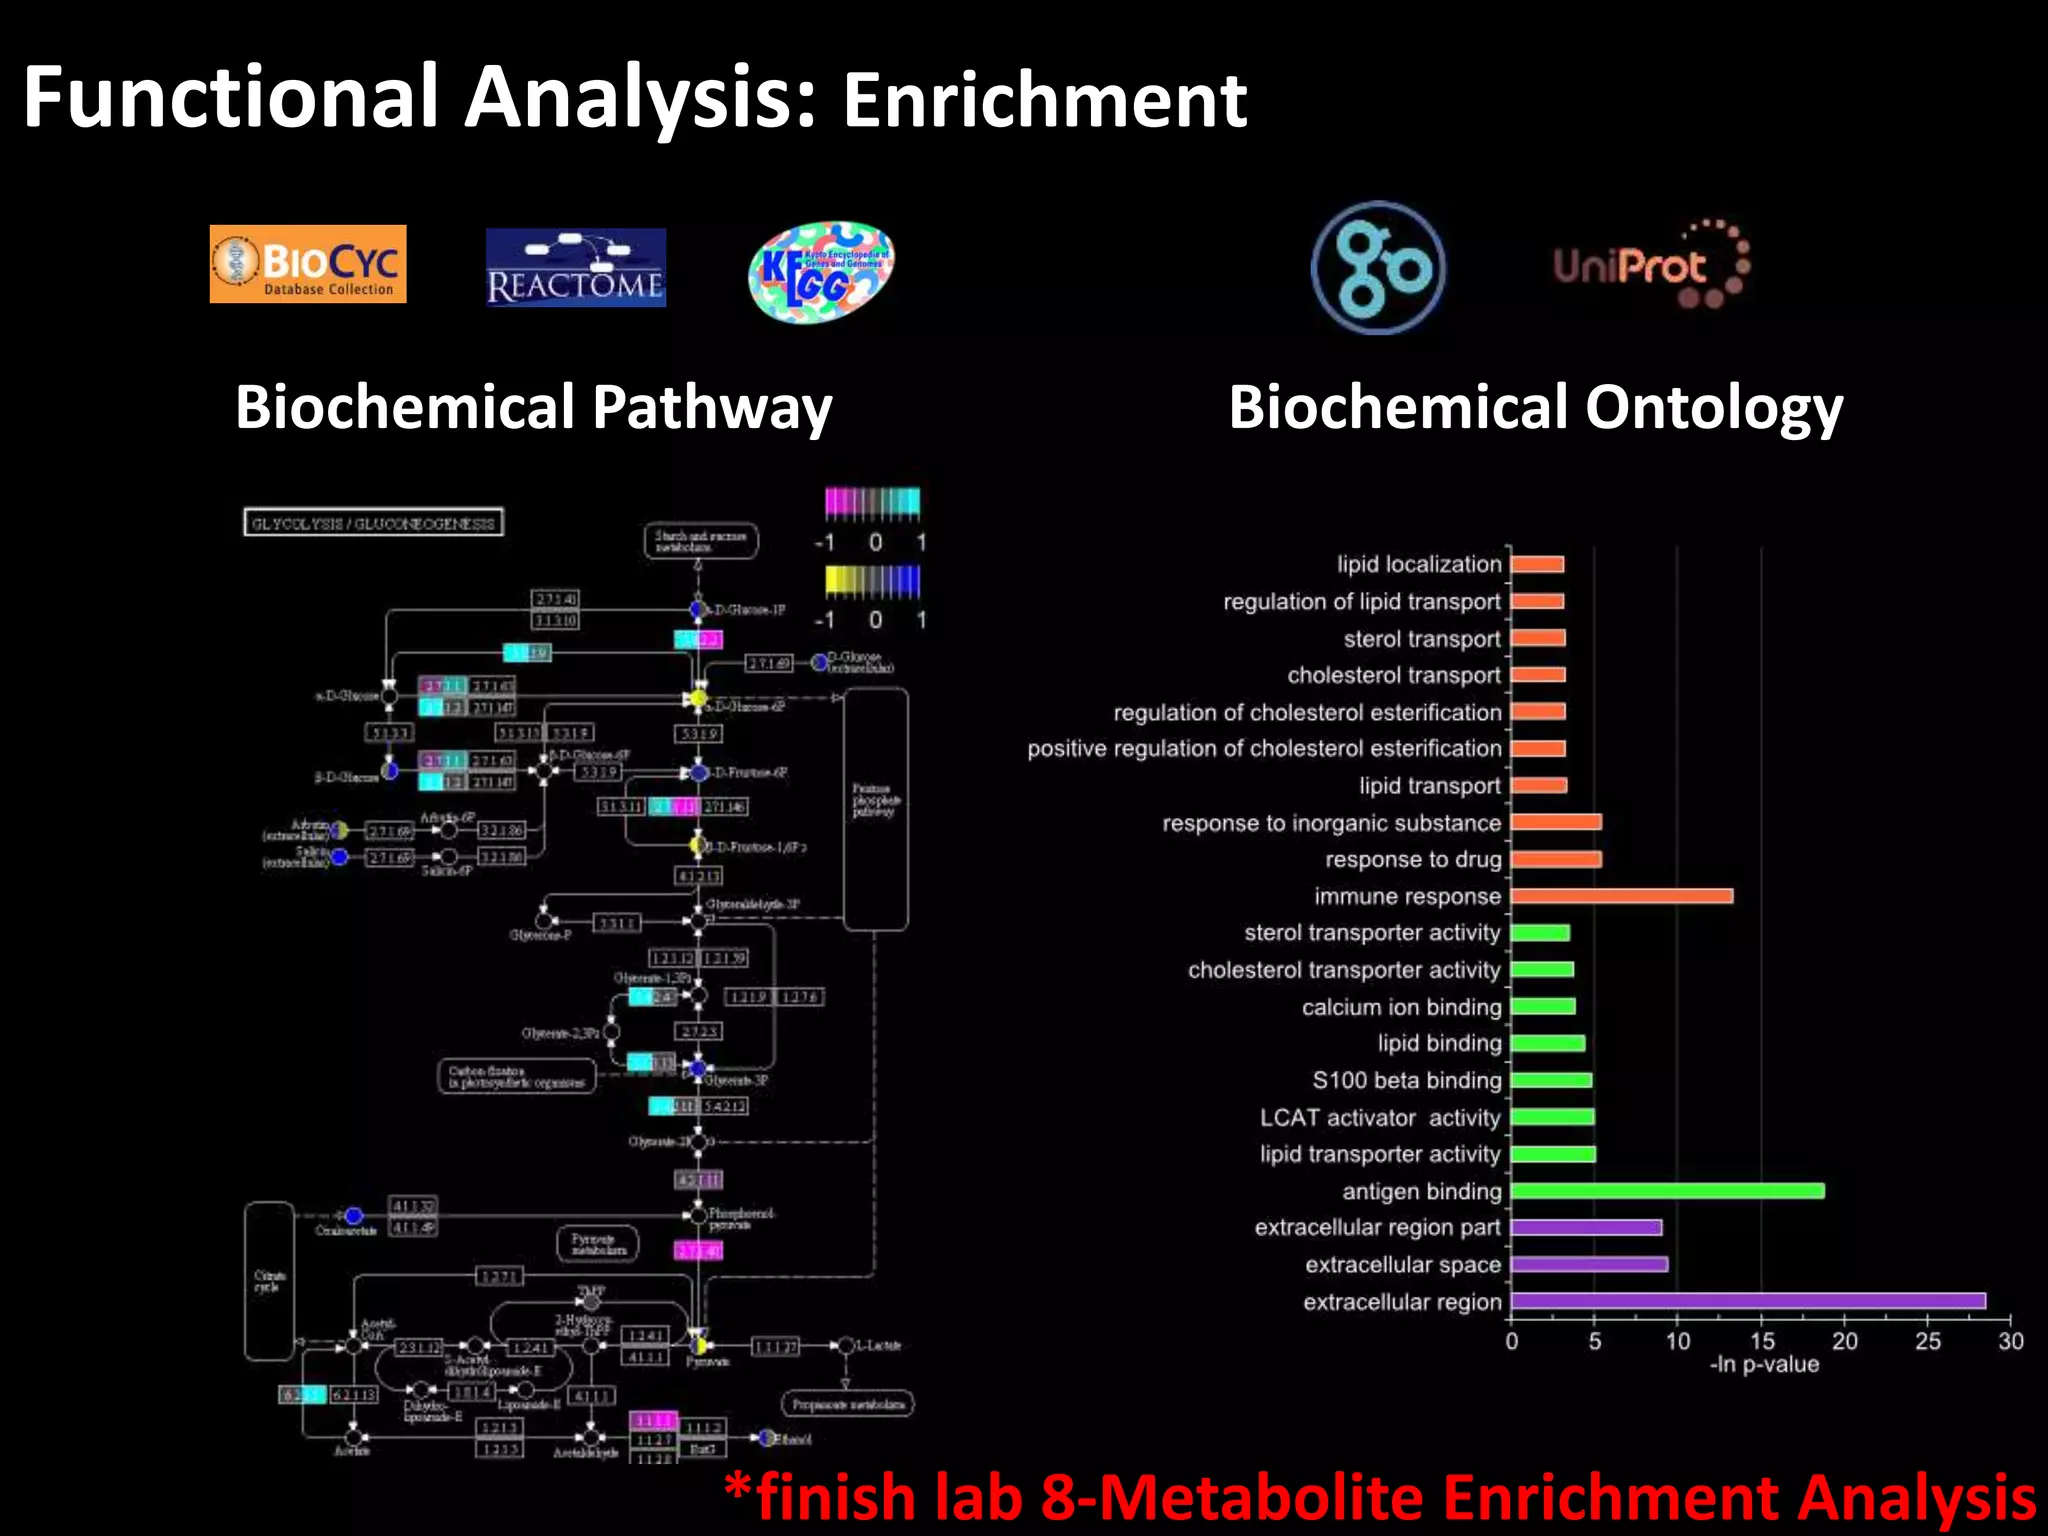
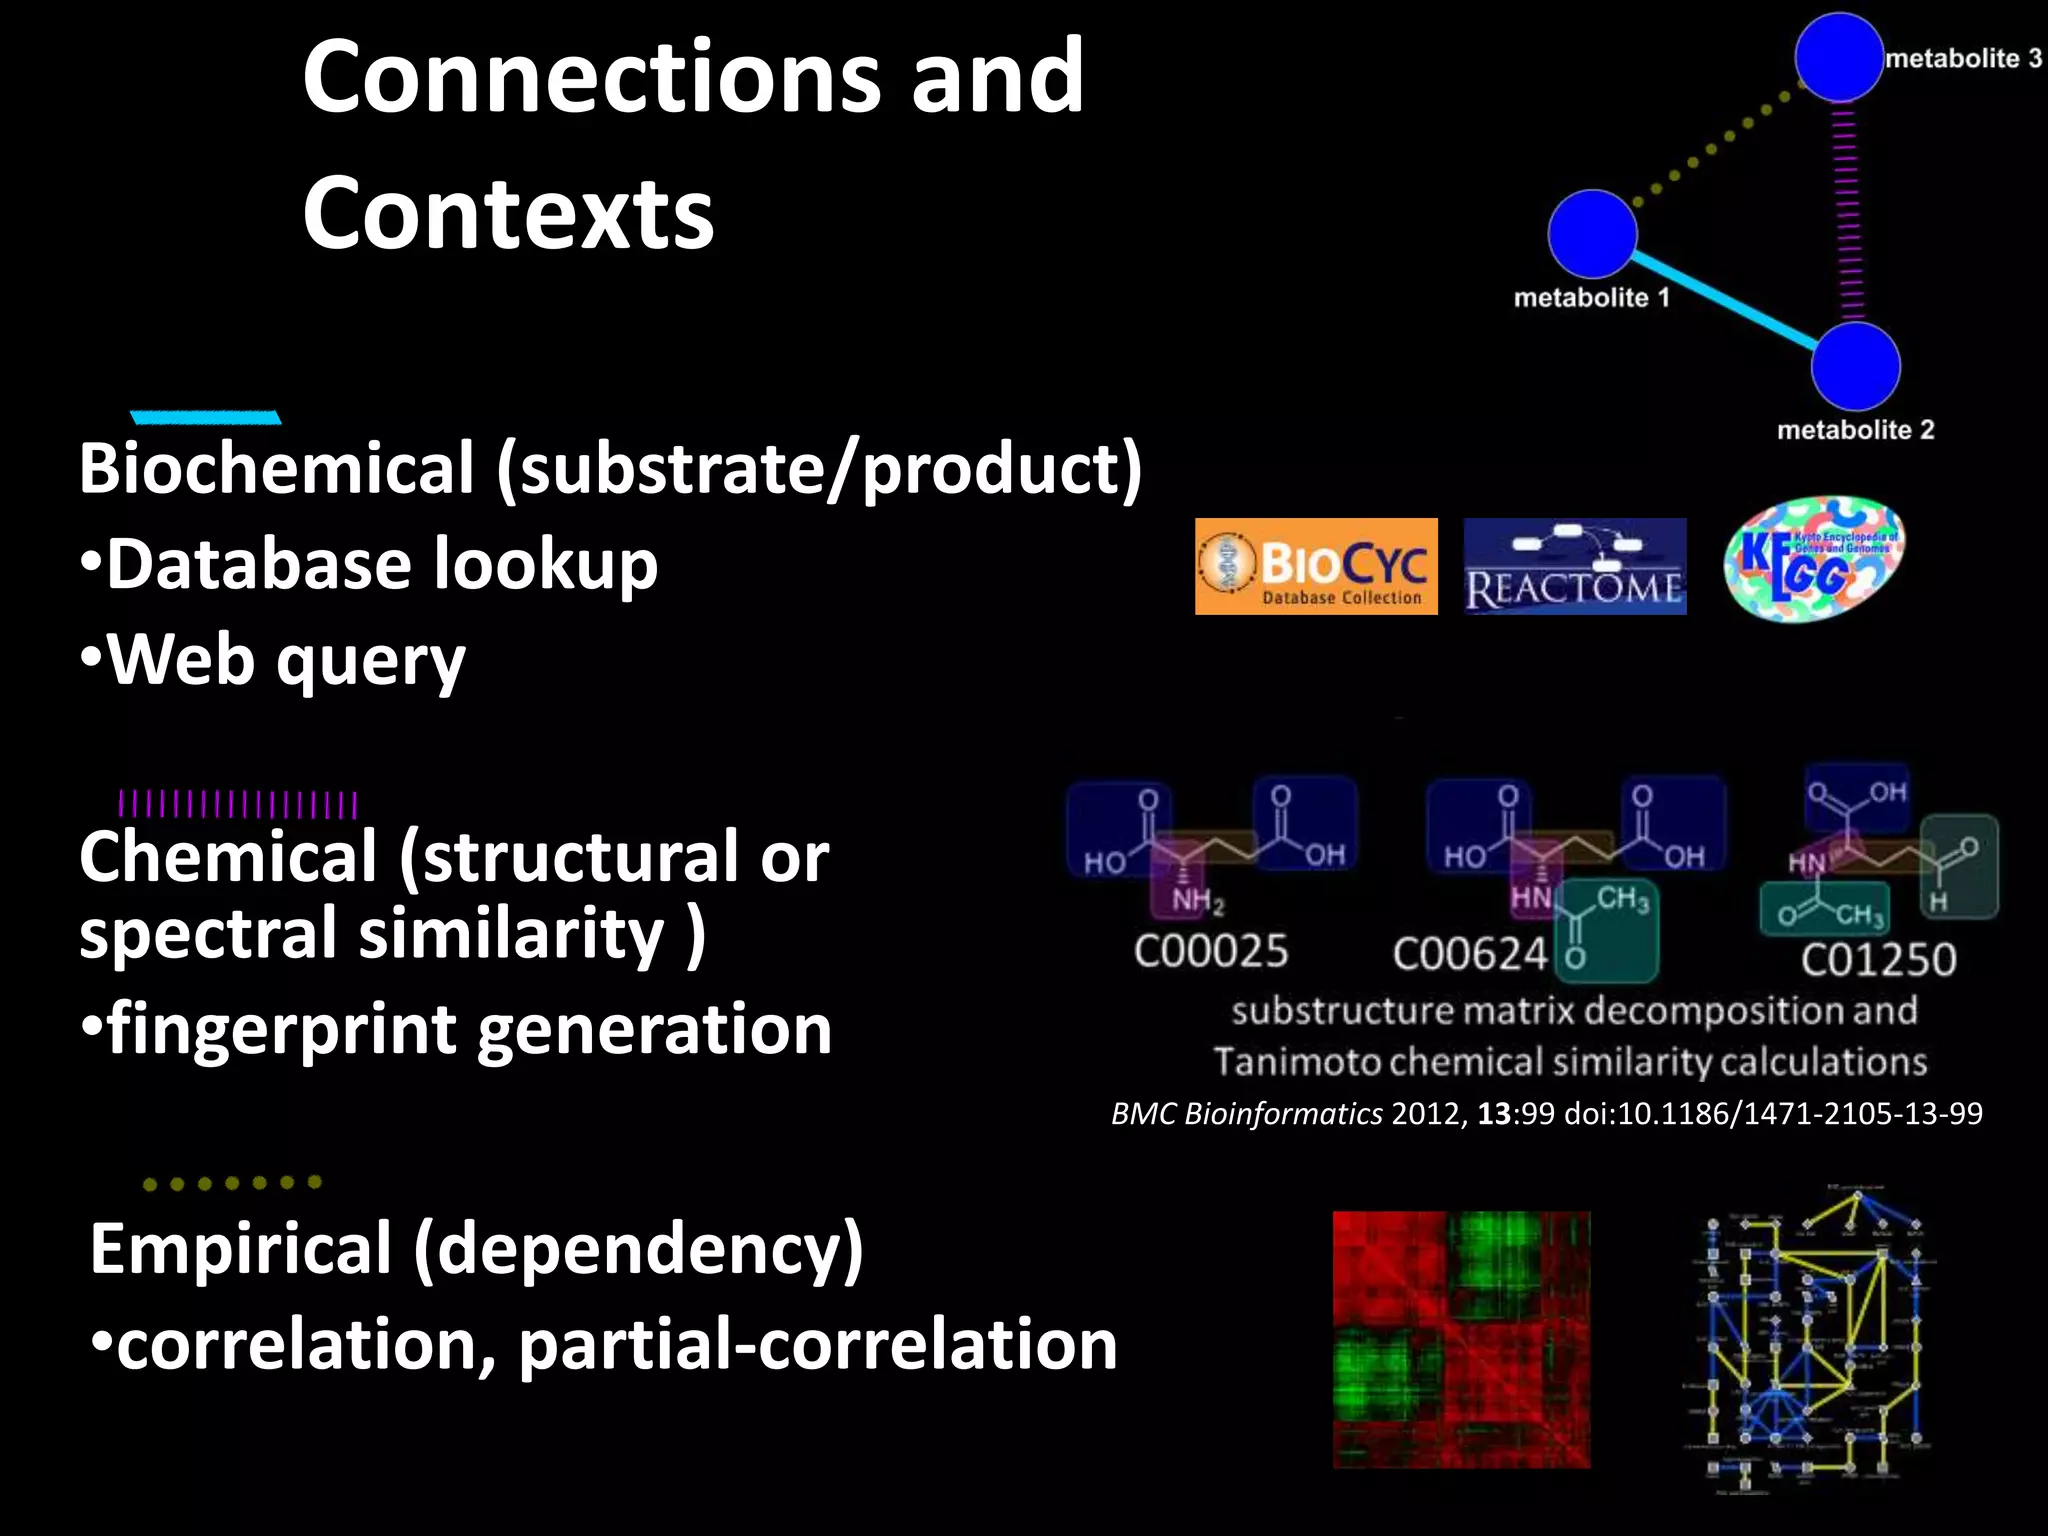
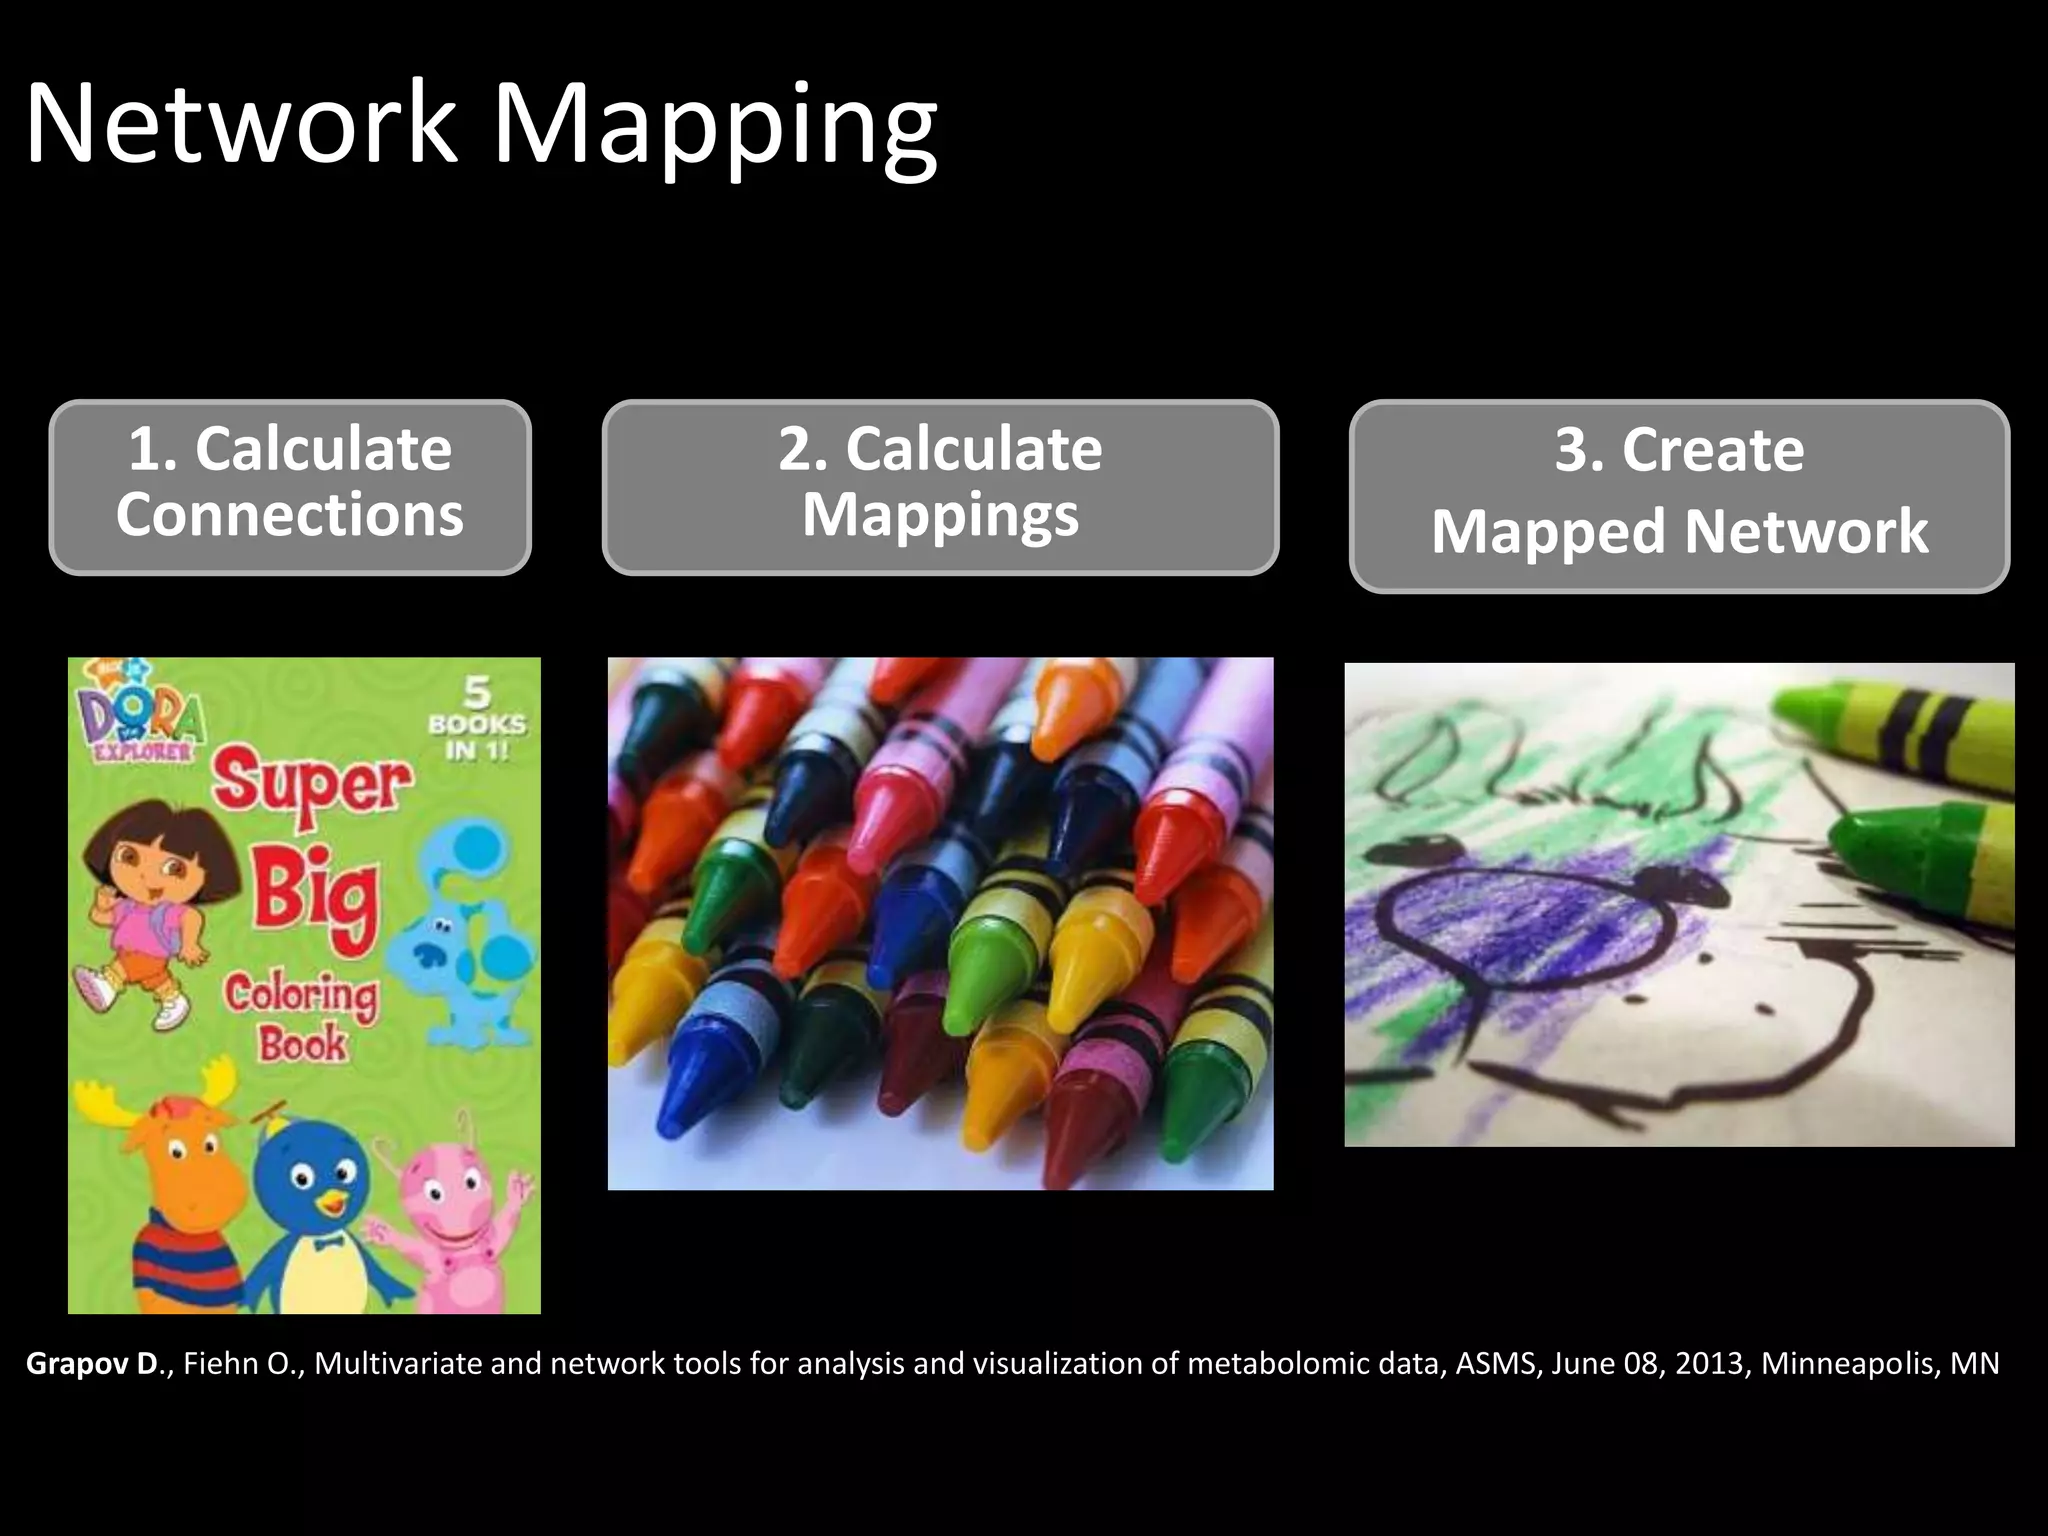
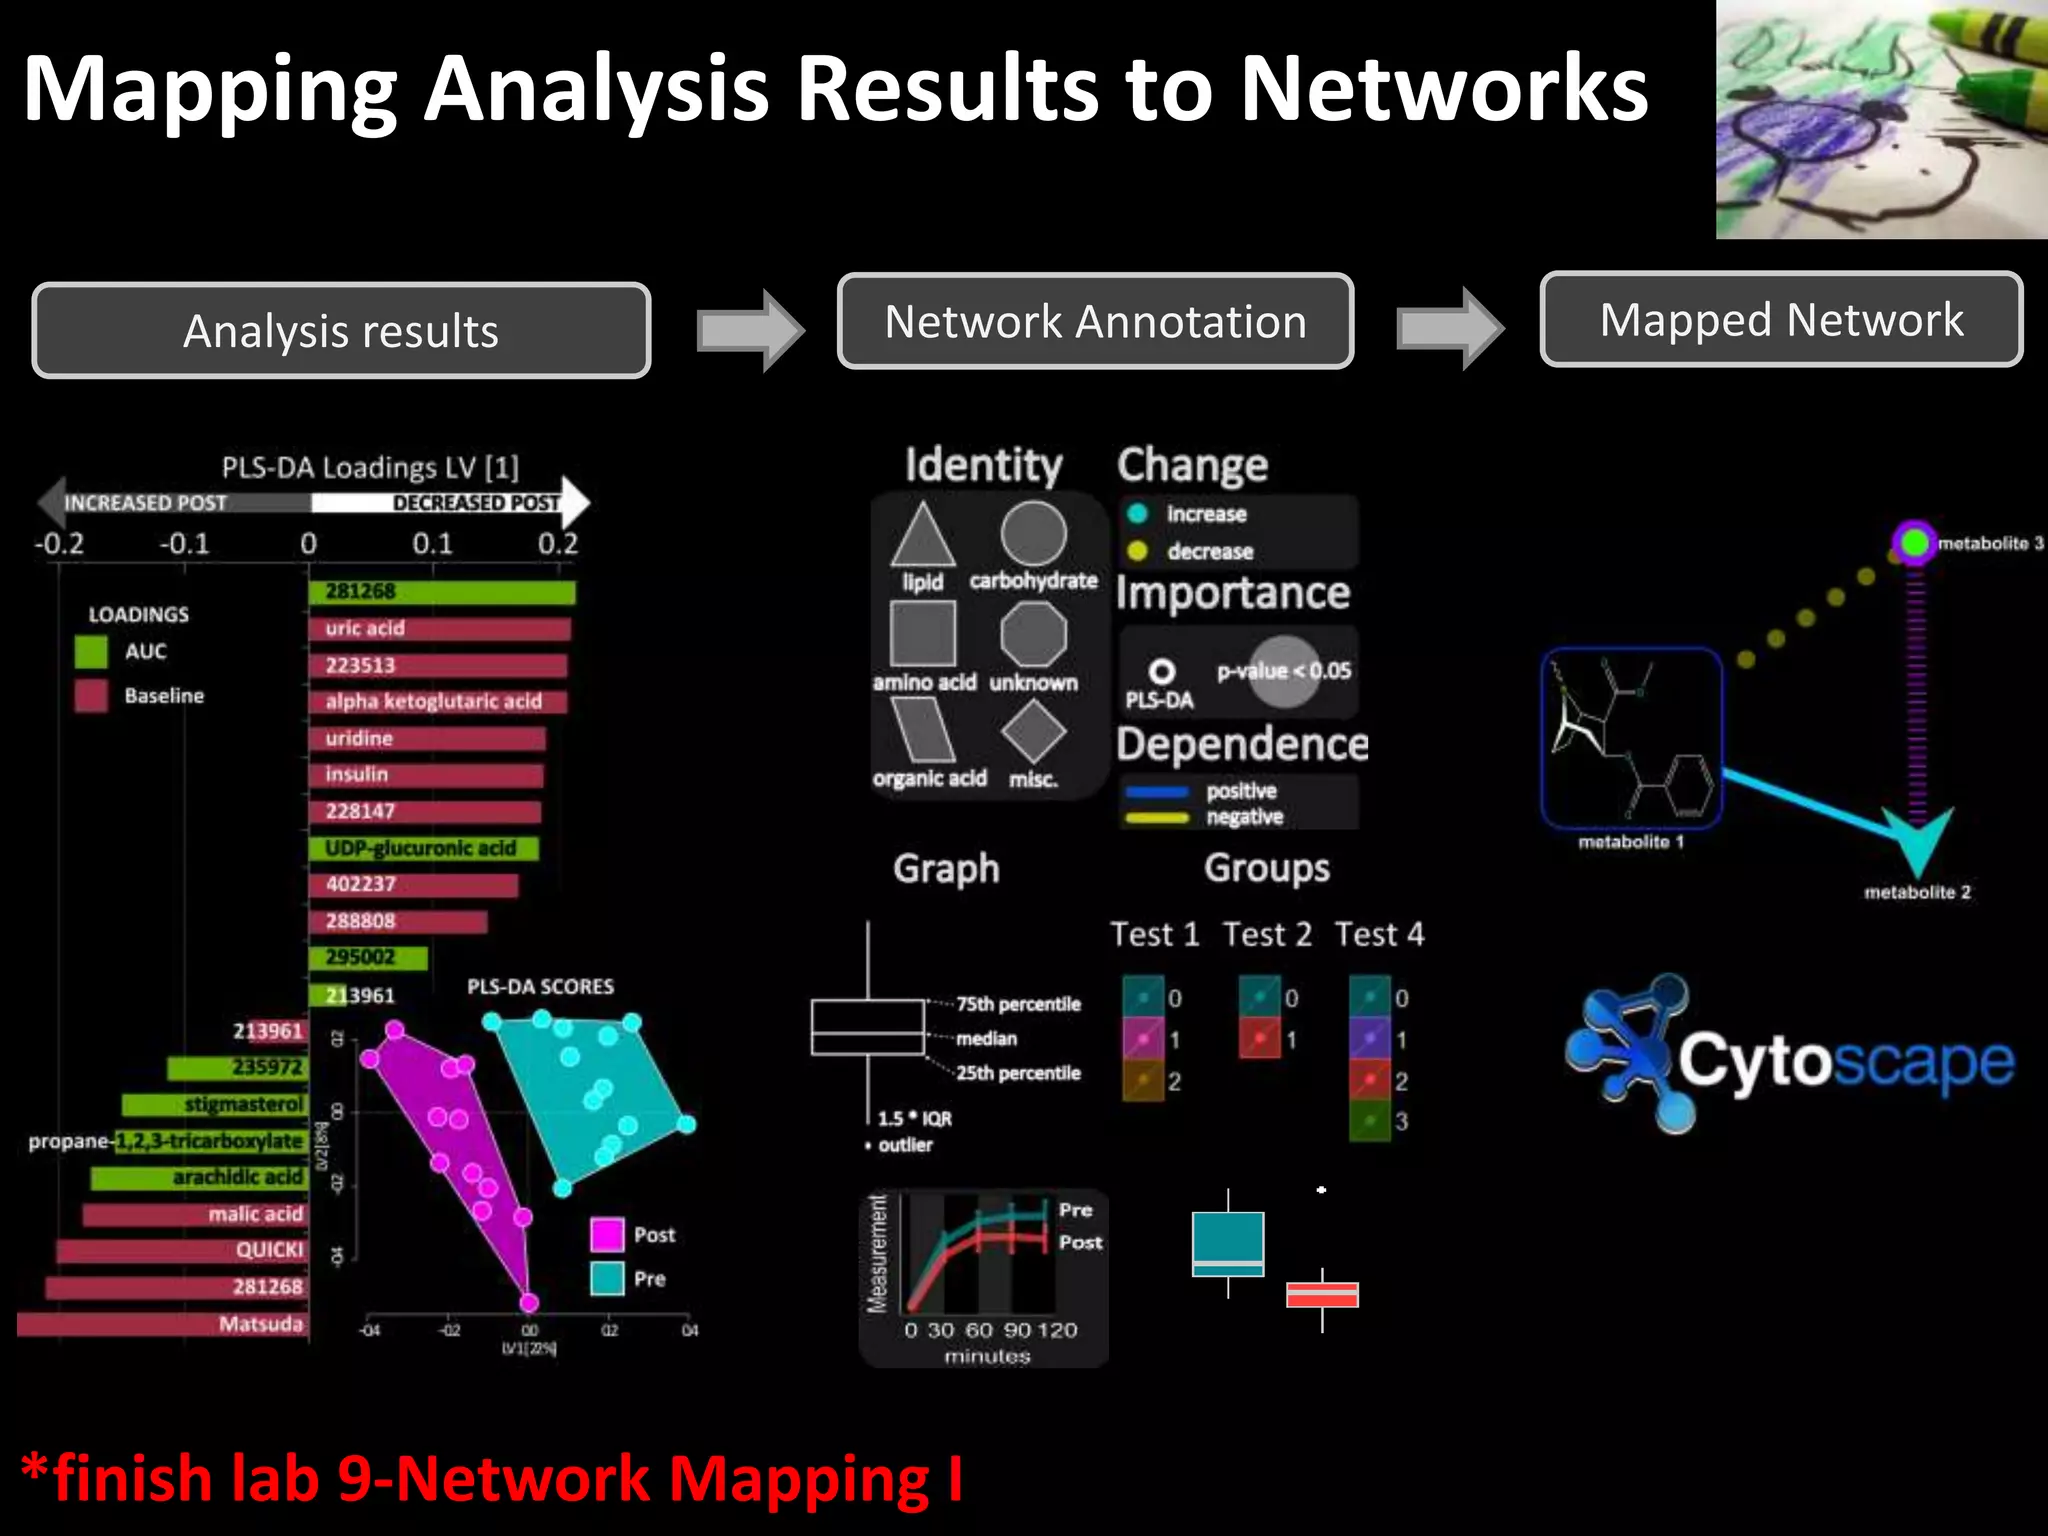
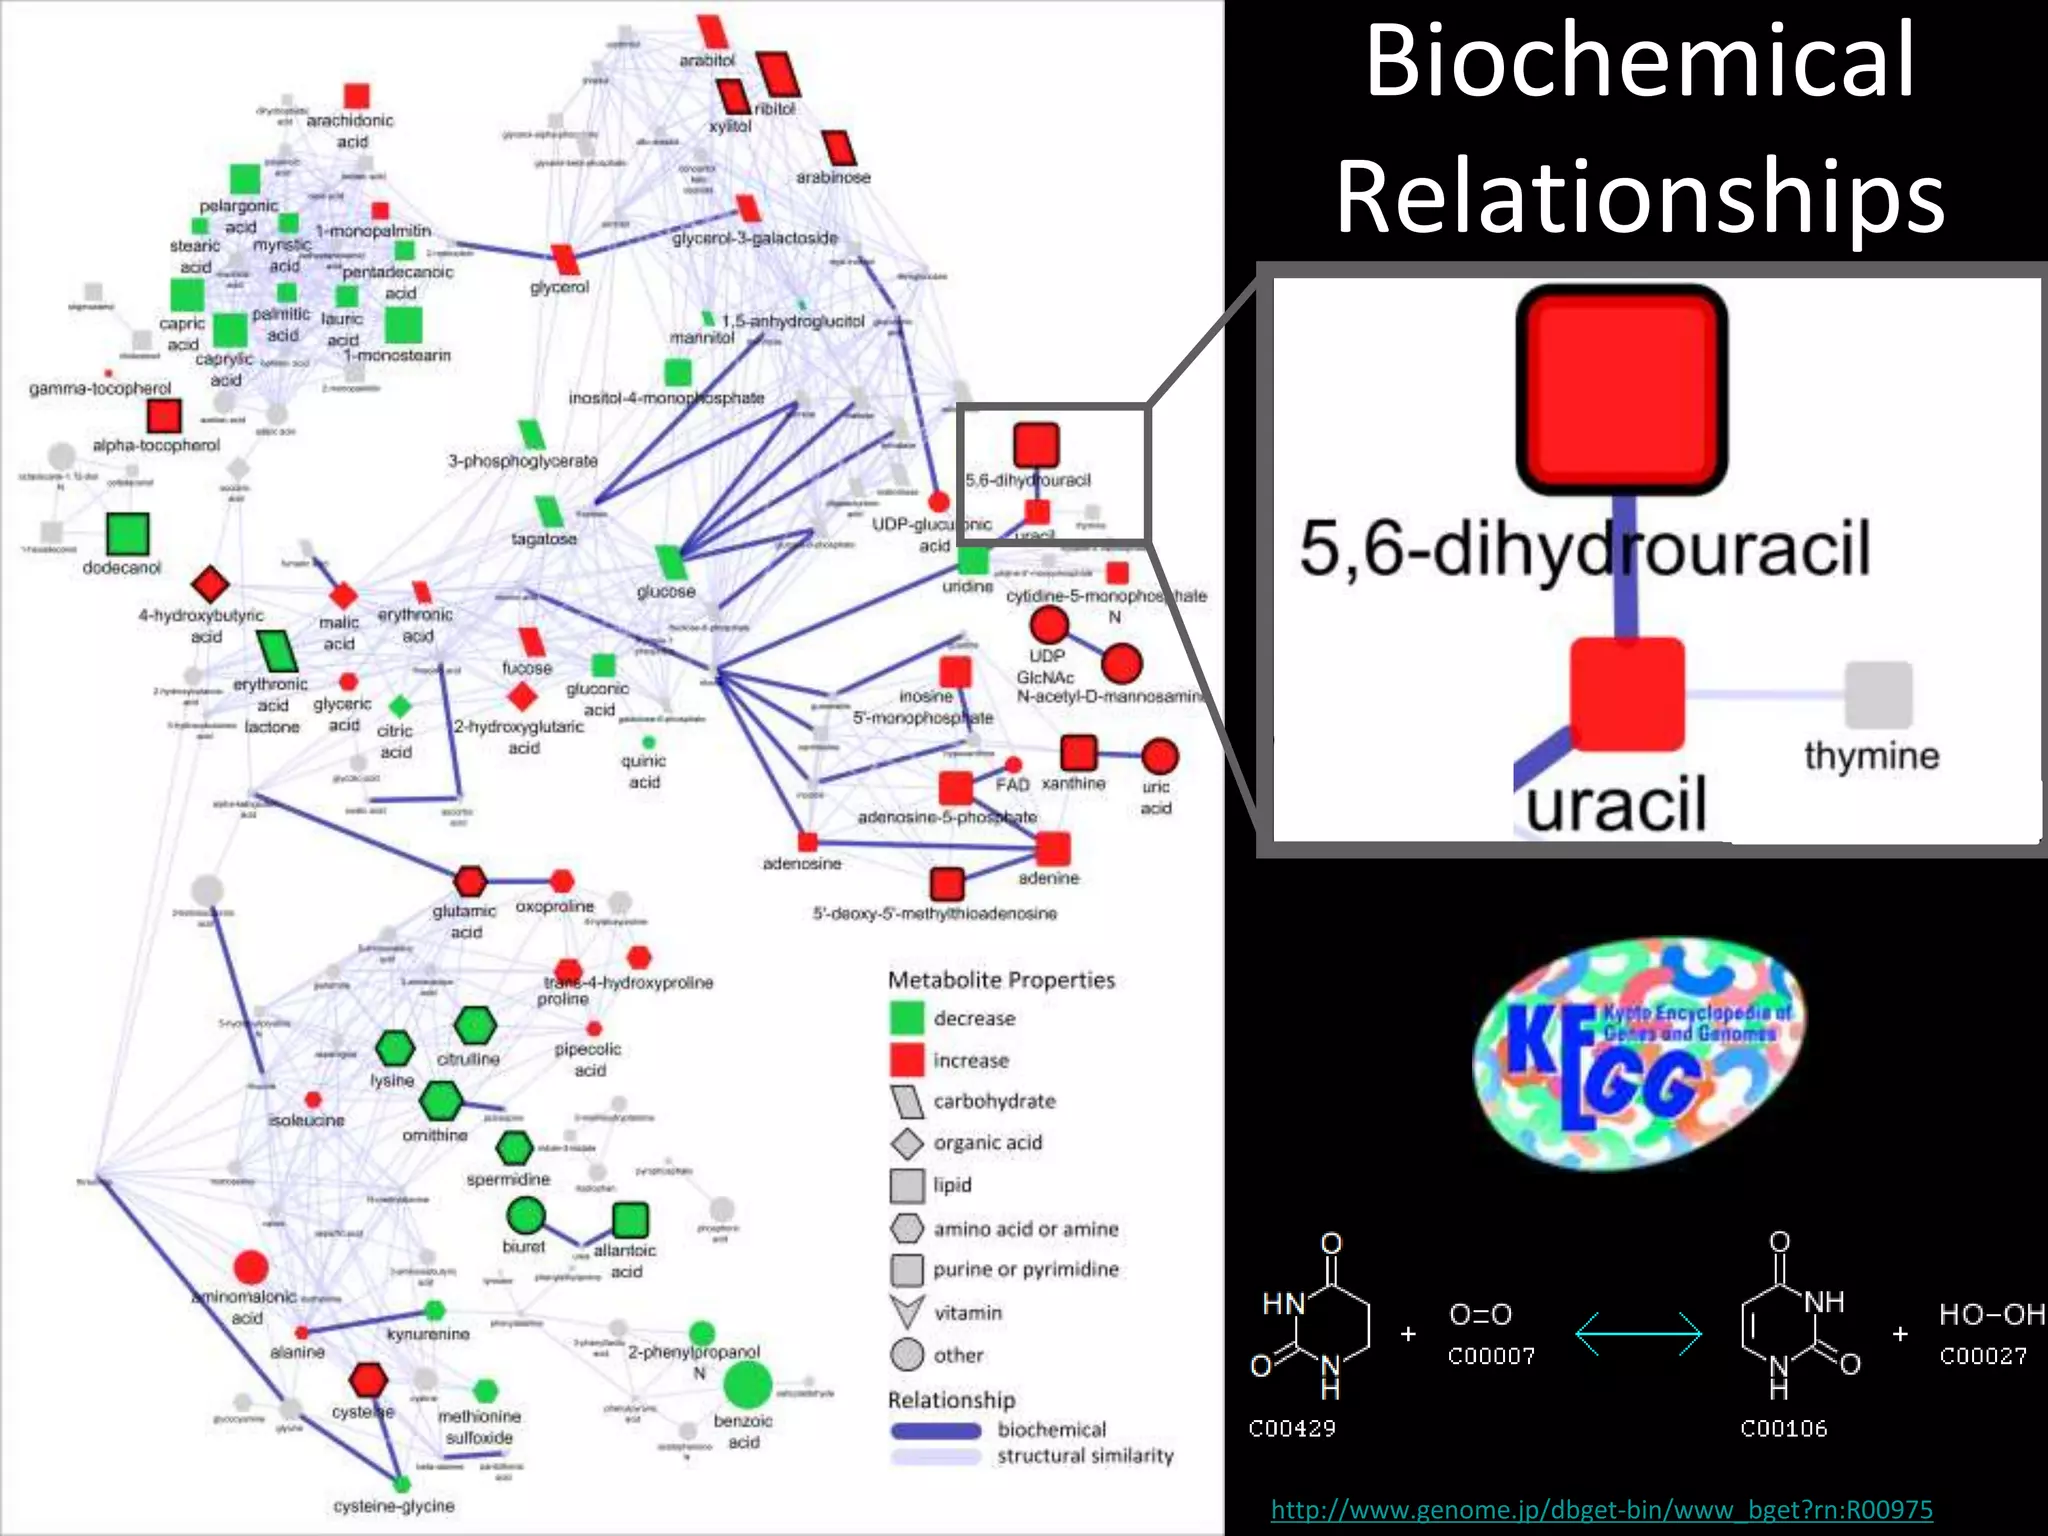
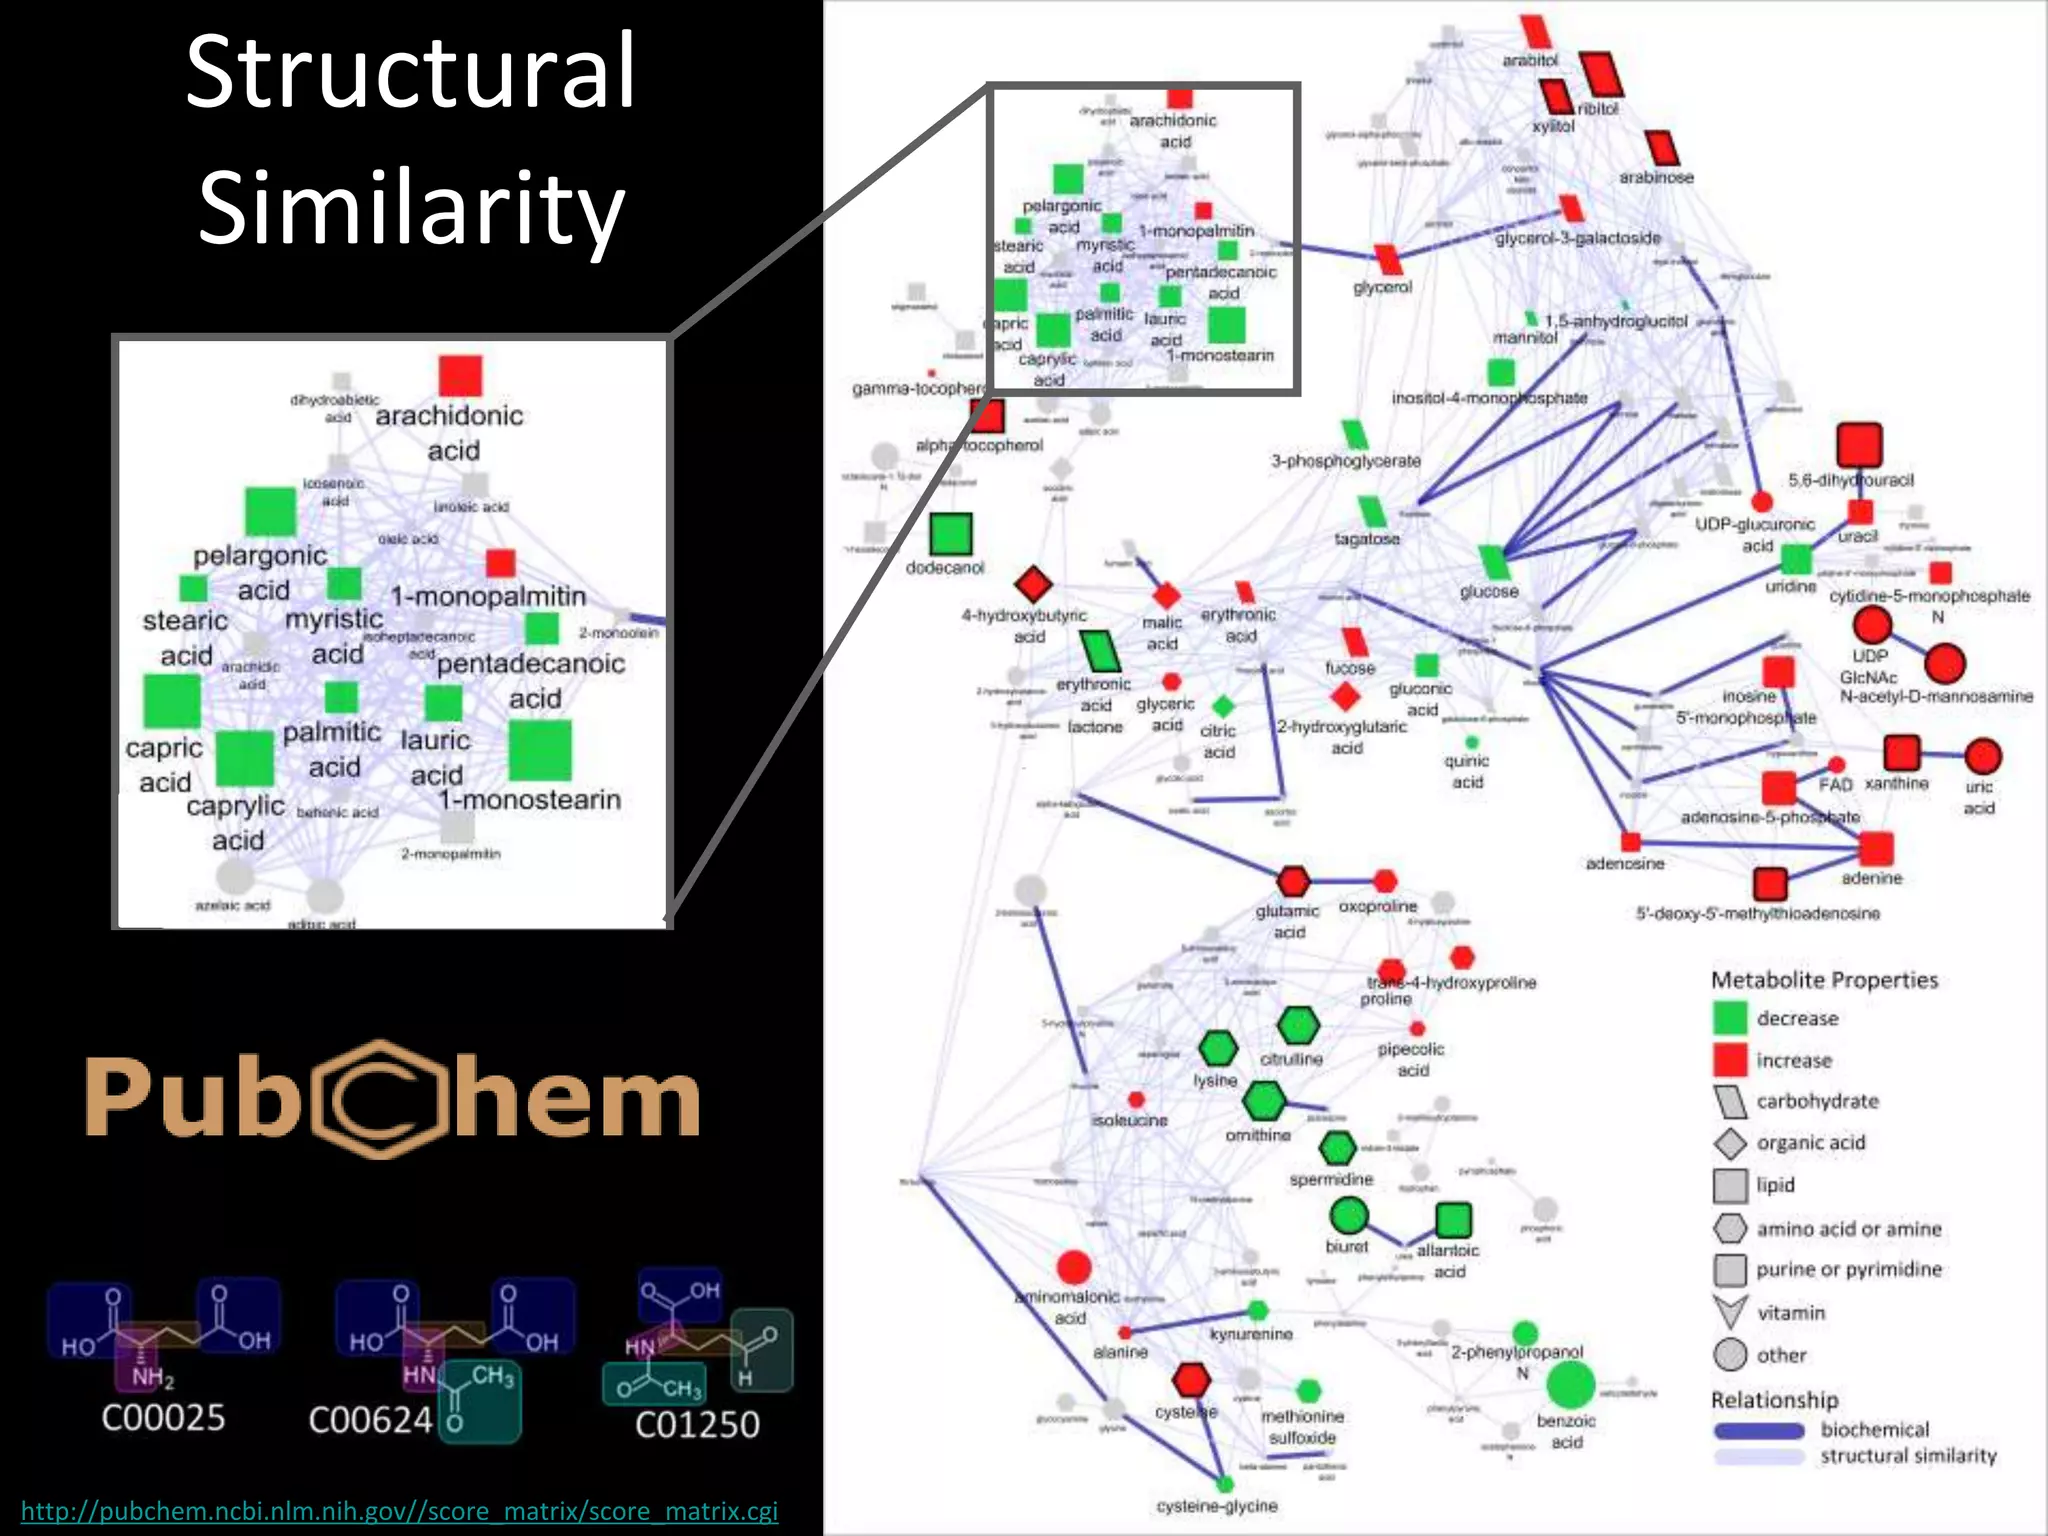
This document provides an introduction and overview of tutorials for metabolomic data analysis. It discusses downloading required files and software. The goals of the analysis include using statistical and multivariate analyses to identify differences between sample groups and impacted biochemical domains. It also discusses various data analysis techniques including data quality assessment, univariate and multivariate statistical analyses, clustering, principal component analysis, partial least squares modeling, functional enrichment analysis, and network mapping.
Part of a lectures series for the international summer course in metabolomics 2013 (http://metabolomics.ucdavis.edu/courses-and-seminars/courses). Get more material and information here (http://imdevsoftware.wordpress.com/2013/09/08/sessions-in-metabolomics-2013/).
Advanced strategies for Metabolomics Data AnalysisDmitry Grapov
Part of a lectures series for the international summer course in metabolomics 2013 (http://metabolomics.ucdavis.edu/courses-and-seminars/courses). Get more material and information here (http://imdevsoftware.wordpress.com/2013/09/08/sessions-in-metabolomics-2013/).
Strategies for Metabolomics Data AnalysisDmitry Grapov
Part of a lectures series for the international summer course in metabolomics 2013 (http://metabolomics.ucdavis.edu/courses-and-seminars/courses). Get more material and information here (http://imdevsoftware.wordpress.com/2013/09/08/sessions-in-metabolomics-2013/).
Data Normalization Approaches for Large-scale Biological StudiesDmitry Grapov
Overview of how to estimate data quality and validate normalization approaches to remove analytical variance.
See here for animations used in the presentation:
http://imdevsoftware.wordpress.com/2014/06/04/using-repeated-measures-to-remove-artifacts-from-longitudinal-data/
Automation of (Biological) Data Analysis and Report GenerationDmitry Grapov
I've been experimenting with automating simple and complex data analysis and report generation tasks for biological data and mostly using R and LATEX. You can see some of my progress and challenges encountered.
Case Study: Overview of Metabolomic Data Normalization StrategiesDmitry Grapov
Five normalization methods were compared, of which the combination of qc-LOESS and cubic splines showed the best performance based on within-batch and between-batch variable relative standard deviations for QCs. This approach was used to normalize sample measurements the results of which were analyzed using principal components analysis.
Metabolomic data analysis and visualization toolsDmitry Grapov
A description of data analysis and visualization tools for metabolomic and other high dimensional data sets, developed at the NIH West Coast Metabolomics Center.
3 data normalization (2014 lab tutorial)Dmitry Grapov
Get more information:
http://imdevsoftware.wordpress.com/2014/10/11/2014-metabolomic-data-analysis-and-visualization-workshop-and-tutorials/
Recently I had the pleasure of teaching statistical and multivariate data analysis and visualization at the annual Summer Sessions in Metabolomics 2014, organized by the NIH West Coast Metabolomics Center.
The International Journal of Engineering and Science (The IJES)theijes
The International Journal of Engineering & Science is aimed at providing a platform for researchers, engineers, scientists, or educators to publish their original research results, to exchange new ideas, to disseminate information in innovative designs, engineering experiences and technological skills. It is also the Journal's objective to promote engineering and technology education. All papers submitted to the Journal will be blind peer-reviewed. Only original articles will be published.
Prote-OMIC Data Analysis and VisualizationDmitry Grapov
Introductory lecture to multivariate analysis of proteomic data.
Material from the UC Davis 2014 Proteomics Workshop.
See more at: http://sourceforge.net/projects/teachingdemos/files/2014%20UC%20Davis%20Proteomics%20Workshop/
Using open bioactivity data for developing machine-learning prediction models...Sunghwan Kim
Presented at the 256th American Chemical Society (ACS) National Meeting in Boston, MA (August 22, 2018).
==== Abstract ====
The retinoid X receptor (RXR) is a nuclear hormone receptor that functions as a transcription factor with roles in development, cell differentiation, metabolism, and cell death. Chemicals that interfere the RXR signaling pathway may cause adverse effects on human health. In this study, open bioactivity data available at PubChem (https://pubchem.ncbi.nlm.nih.gov) were used to develop prediction models for chemical modulators of RXR-alpha, which is a subtype of RXR that plays a role in metabolic signaling pathways, dermal cysts, cardiac development, insulin sensitization, etc. The models were constructed from quantitative high-throughput screening (qHTS) data from the Tox21 project, using various supervised machine learning methods (including support vector machine, random forest, neural network, k-nearest neighbors, decision tree, and naïve Bayes). The performance of the models was evaluated with an external data set containing bioactivity data submitted by ChEMBL and the NCATS Chemical Genomics Center (NCGC). This study showcases how open data in the public domain can be used to develop prediction models for chemical toxicity.
Workflows, provenance and reporting: a lifecycle perspective at BIH 2013, RomeCarole Goble
Workflow systems support the design, configuration and execution of repetitive, multi-step pipelines and analytics, well established in many disciplines, notably biology and chemistry, but less so in biodiversity and ecology. From an experimental perspective workflows are a means to handle the work of accessing an ecosystem of software and platforms, manage data and security, and handle errors. From a reporting perspective they are a means to accurately document methodology for reproducibility, comparison, exchange and reuse, and to trace the provenance of results for review, credit, workflow interoperability and impact analysis. Workflows operate in an evolving ecosystem and are assemblages of components in that ecosystem; their provenance trails are snapshots of intermediate and final results. Taking a lifecycle perspective, what are the challenges in workflow design and use with different stakeholders? What needs to be tackled in evolution, resilience, and preservation? And what are the “mitigate or adapt” strategies adopted by workflow systems in the face of changes in the ecosystem/environment, for example when tools are depreciated or datasets become inaccessible in the face of funding shortfalls?
Review of "Survey Research Methods & Design in Psychology"James Neill
Reviews the 150 hour, third year psychology unit which examined survey research methods, with an emphasis on the second-half of the unit on MLR, ANOVA, power, and effect size.
Ijricit 01-002 enhanced replica detection in short time for large data setsIjripublishers Ijri
Similarity check of real world entities is a necessary factor in these days which is named as Data Replica Detection.
Time is an critical factor today in tracking Data Replica Detection for large data sets, without having impact over quality
of Dataset. In this we primarily introduce two Data Replica Detection algorithms , where in these contribute enhanced
procedural standards in finding Data Replication at limited execution periods.This contribute better improvised state
of time than conventional techniques . We propose two Data Replica Detection algorithms namely progressive sorted
neighborhood method (PSNM), which performs best on small and almost clean datasets, and progressive blocking (PB),
which performs best on large and very grimy datasets. Both enhance the efficiency of duplicate detection even on very
large datasets.
An introduction to variable and feature selectionMarco Meoni
Presentation of a great paper from Isabelle Guyon (Clopinet) and André Elisseeff (Max Planck Institute) back in 2003, which outlines the main techniques for feature selection and model validation in machine learning systems
RAMSES: Robust Analytic Models for Science at Extreme ScalesIan Foster
RAMSES: A new project in data-driven analytical modeling of distributed systems
RAMSES is a new DOE-funded project on the end-to-end analytical performance modeling of science workflows in extreme-scale science environments. It aims to link multiple threads of inquiry that have not, until now, been adequately connected: namely, first-principles performance modeling within individual sub-disciplines (e.g., networks, storage systems, applications), and data-driven methods for evaluating, calibrating, and synthesizing models of complex phenomena. What makes this fusion necessary is the drive to explain, predict, and optimize not just individual system components but complex end-to-end workflows. In this talk, I will introduce the goals of the project and some aspects of our technical approach.
Researchers at EPA’s National Center for Computational Toxicology integrate advances in biology, chemistry, and computer science to examine the toxicity of chemicals and help prioritize chemicals for further research based on potential human health risks. The goal of this research program is to quickly evaluate thousands of chemicals, but at a much reduced cost and shorter time frame relative to traditional approaches. The data generated by the Center includes characterization of thousands of chemicals across hundreds of high-throughput screening assays, consumer use and production information, pharmacokinetic properties, literature data, physical-chemical properties as well as the predictive computational modeling of toxicity and exposure. We have developed a number of databases and applications to deliver the data to the public, academic community, industry stakeholders, and regulators. This presentation will provide an overview of our work to develop an architecture that integrates diverse large-scale data from the chemical and biological domains, our approaches to disseminate these data, and the delivery of models supporting predictive computational toxicology. In particular, this presentation will review our new publicly-accessible CompTox Dashboard as the first application built on our newly developed architecture. This abstract does not reflect U.S. EPA policy.
Full course: https://creativedatasolutions.github.io/CDS.courses/courses/network_mapping_101/docs/
The course covered all of the steps required to go from `raw data` to a rich `mapped biochemical network` incorporating statistical, multivariate and machine learning results. This included [examples](https://creativedatasolutions.github.io/CDS.courses/courses/network_mapping_101/docs/#topics) and tutorials for:
* Preparing raw data for analysis
* Multivariate data exploration
* Supervised clustering
* Machine learning – classification model validation and feature selection
* Network analysis - biochemical, structural similarity and correlation networks
* Network mapping – putting it all together to create a publication quality network
url:
https://github.com/CreativeDataSolutions/CDS.courses/blob/gh-pages/courses/network_mapping_101/materials/lectures/tutorial.pdf
Rise of Deep Learning for Genomic, Proteomic, and Metabolomic Data Integratio...Dmitry Grapov
Machine learning (ML) is being ubiquitously incorporated into everyday products such as Internet search, email spam filters, product recommendations, image classification, and speech recognition. New approaches for highly integrated manufacturing and automation such as the Industry 4.0 and the Internet of things are also converging with ML methodologies. Many approaches incorporate complex artificial neural network architectures and are collectively referred to as deep learning (DL) applications. These methods have been shown capable of representing and learning predictable relationships in many diverse forms of data and hold promise for transforming the future of omics research and applications in precision medicine. Omics and electronic health record data pose considerable challenges for DL. This is due to many factors such as low signal to noise, analytical variance, and complex data integration requirements. However, DL models have already been shown capable of both improving the ease of data encoding and predictive model performance over alternative approaches. It may not be surprising that concepts encountered in DL share similarities with those observed in biological message relay systems such as gene, protein, and metabolite networks. This expert review examines the challenges and opportunities for DL at a systems and biological scale for a precision medicine readership.
current: https://drive.google.com/open?id=0B51AEMfo-fh9M3FmWXVlb05pdm8
I am always looking for the next data science, machine learning and visualization challenge.
Here is a link to my up to date
resume:
https://drive.google.com/open?id=0B51AEMfo-fh9M3FmWXVlb05pdm8
cv:
https://drive.google.com/open?id=0B51AEMfo-fh9Z05aM2p6XzFIOFE
https://www.youtube.com/watch?v=Y_-o-4rKxUk
Machine learning powered metabolomic network analysis
Dmitry Grapov PhD,
Director of Data Science and Bioinformatics,
CDS- Creative Data Solutions
www.createdatasol.com
Metabolomic network analysis can be used to interpret experimental results within a variety of contexts including: biochemical relationships, structural and spectral similarity and empirical correlation. Machine learning is useful for modeling relationships in the context of pattern recognition, clustering, classification and regression based predictive modeling. The combination of developed metabolomic networks and machine learning based predictive models offer a unique method to visualize empirical relationships while testing key experimental hypotheses. The following presentation focuses on data analysis, visualization, machine learning and network mapping approaches used to create richly mapped metabolomic networks. Learn more at www.createdatasol.com
Step by step tutorial for conducting GO enrichment analysis and then creating a network from the results.
Material from the UC Davis 2014 Proteomics Workshop.
See more at: http://sourceforge.net/projects/teachingdemos/files/2014%20UC%20Davis%20Proteomics%20Workshop/
The Roman Empire A Historical Colossus.pdfkaushalkr1407
The Roman Empire, a vast and enduring power, stands as one of history's most remarkable civilizations, leaving an indelible imprint on the world. It emerged from the Roman Republic, transitioning into an imperial powerhouse under the leadership of Augustus Caesar in 27 BCE. This transformation marked the beginning of an era defined by unprecedented territorial expansion, architectural marvels, and profound cultural influence.
The empire's roots lie in the city of Rome, founded, according to legend, by Romulus in 753 BCE. Over centuries, Rome evolved from a small settlement to a formidable republic, characterized by a complex political system with elected officials and checks on power. However, internal strife, class conflicts, and military ambitions paved the way for the end of the Republic. Julius Caesar’s dictatorship and subsequent assassination in 44 BCE created a power vacuum, leading to a civil war. Octavian, later Augustus, emerged victorious, heralding the Roman Empire’s birth.
Under Augustus, the empire experienced the Pax Romana, a 200-year period of relative peace and stability. Augustus reformed the military, established efficient administrative systems, and initiated grand construction projects. The empire's borders expanded, encompassing territories from Britain to Egypt and from Spain to the Euphrates. Roman legions, renowned for their discipline and engineering prowess, secured and maintained these vast territories, building roads, fortifications, and cities that facilitated control and integration.
The Roman Empire’s society was hierarchical, with a rigid class system. At the top were the patricians, wealthy elites who held significant political power. Below them were the plebeians, free citizens with limited political influence, and the vast numbers of slaves who formed the backbone of the economy. The family unit was central, governed by the paterfamilias, the male head who held absolute authority.
Culturally, the Romans were eclectic, absorbing and adapting elements from the civilizations they encountered, particularly the Greeks. Roman art, literature, and philosophy reflected this synthesis, creating a rich cultural tapestry. Latin, the Roman language, became the lingua franca of the Western world, influencing numerous modern languages.
Roman architecture and engineering achievements were monumental. They perfected the arch, vault, and dome, constructing enduring structures like the Colosseum, Pantheon, and aqueducts. These engineering marvels not only showcased Roman ingenuity but also served practical purposes, from public entertainment to water supply.
Unit 8 - Information and Communication Technology (Paper I).pdfThiyagu K
This slides describes the basic concepts of ICT, basics of Email, Emerging Technology and Digital Initiatives in Education. This presentations aligns with the UGC Paper I syllabus.
The French Revolution, which began in 1789, was a period of radical social and political upheaval in France. It marked the decline of absolute monarchies, the rise of secular and democratic republics, and the eventual rise of Napoleon Bonaparte. This revolutionary period is crucial in understanding the transition from feudalism to modernity in Europe.
For more information, visit-www.vavaclasses.com
How to Create Map Views in the Odoo 17 ERPCeline George
The map views are useful for providing a geographical representation of data. They allow users to visualize and analyze the data in a more intuitive manner.
The Indian economy is classified into different sectors to simplify the analysis and understanding of economic activities. For Class 10, it's essential to grasp the sectors of the Indian economy, understand their characteristics, and recognize their importance. This guide will provide detailed notes on the Sectors of the Indian Economy Class 10, using specific long-tail keywords to enhance comprehension.
For more information, visit-www.vavaclasses.com
Instructions for Submissions thorugh G- Classroom.pptxJheel Barad
This presentation provides a briefing on how to upload submissions and documents in Google Classroom. It was prepared as part of an orientation for new Sainik School in-service teacher trainees. As a training officer, my goal is to ensure that you are comfortable and proficient with this essential tool for managing assignments and fostering student engagement.
Welcome to TechSoup New Member Orientation and Q&A (May 2024).pdfTechSoup
In this webinar you will learn how your organization can access TechSoup's wide variety of product discount and donation programs. From hardware to software, we'll give you a tour of the tools available to help your nonprofit with productivity, collaboration, financial management, donor tracking, security, and more.
This is a presentation by Dada Robert in a Your Skill Boost masterclass organised by the Excellence Foundation for South Sudan (EFSS) on Saturday, the 25th and Sunday, the 26th of May 2024.
He discussed the concept of quality improvement, emphasizing its applicability to various aspects of life, including personal, project, and program improvements. He defined quality as doing the right thing at the right time in the right way to achieve the best possible results and discussed the concept of the "gap" between what we know and what we do, and how this gap represents the areas we need to improve. He explained the scientific approach to quality improvement, which involves systematic performance analysis, testing and learning, and implementing change ideas. He also highlighted the importance of client focus and a team approach to quality improvement.
Metabolomic Data Analysis Workshop and Tutorials (2014)
1. 2014 Workshop in
Metabolomic Data Analysis
Dmitry Grapov, PhD
Introduction
2. Important
Introduction
This is an introduction to a series of tutorials for
metabolomic data analysis
1. Download all the required files and software at:
https://sourceforge.net/projects/teachingdemos/files/WCMC%202014%20Summer%20Workshop/
2. Make sure you have installed R (v3.1.1, http://cran.us.r-project.org/ ), shiny (v0.10.1,
http://shiny.rstudio.com/ ) and a modern browser (e.g., Chrome).
3. Run the code in the folder software the file startup.R to launch all
accompanying software; or download most current versions at the links
below
• DeviumWeb (https://github.com/dgrapov/DeviumWeb)
• MetaMapR (https://github.com/dgrapov/MetaMapR)
4. Have a great time!
5. Statistical and Multivariate Analyses
Group 1
Statistics
+
+
=
Multivariate
Context
Network Mapping
Ranked statistically
significant differences
within a a biochemical
context
Group 2
What analytes are
different between the
two groups of samples?
Statistical
t-Test
significant differences
lacking rank and
context
Multivariate
O-PLS-DA
ranked differences
lacking significance
and context
6. Statistical and Multivariate Analyses
Group 1
Statistics
+
+
=
Multivariate
Context
Network Mapping
Group 2
What analytes are
different between the
two groups of samples?
Statistical
t-Test
Multivariate
O-PLS-DA
To see the big picture it is necessary too view the data from multiple
different angles
7. Cycle of Scientific Discovery
Hypothesis Data Acquisition
Data Processing
Hypothesis Generation Data Analysis Data
8. Sample
Data Analysis and Visualization
Variable
Quality Assessment
• use replicated mesurements
and/or internal standards to
estimate analytical variance
Statistical and Multivariate
• use the experimental design
to test hypotheses and/or
identify trends in analytes
Functional
• use statistical and multivariate
results to identify impacted
biochemical domains
Network
• integrate statistical and
multivariate results with the
experimental design and
analyte metadata
Sample Variable
experimental design
- organism, sex, age etc.
analyte description and
metadata
- biochemical class, mass
spectra, etc.
9. Sample
Data Analysis and Visualization
Variable
Quality Assessment
• use replicated mesurements
and/or internal standards to
estimate analytical variance
Statistical and Multivariate
• use the experimental design
to test hypotheses and/or
identify trends in analytes
Functional
• use statistical and multivariate
results to identify impacted
biochemical domains
Network
• integrate statistical and
multivariate results with the
experimental design and
analyte metadata
Network Mapping
Sample Variable
experimental design
- organism, sex, age etc.
analyte description and
metadata
- biochemical class, mass
spectra, etc.
11. Univariate Qualities
•length (sample size)
•center (mean, median,
geometric mean)
•dispersion (variance,
standard deviation)
•range (min / max),
•quantiles
•shape (skewness, kurtosis,
normality, etc.)
standard deviation
mean
12. Univariate Analyses
•Identify differences in sample population
means
•sensitive to distribution shape
•parametric = assumes normality
•error in Y, not in X (Y = mX + error)
•optimal for long data
•assumed independence
•false discovery rate (FDR)
long
wide
n-of-one
13. False Discovery Rate (FDR)
Type I Error: False Positives
•Type II Error: False Negatives
•Type I risk =
•1-(1-p.value)m
m = number of variables tested
FDR correction
• p-value adjustment or estimate of FDR (Fdr, q-value)
Bioinformatics (2008) 24 (12):1461-1462
14. Statistical Analysis: achieving ‘significance’
significance level (α) and power (1-β )
effect size (standardized difference in means)
sample size (n)
Power analyses can be used to
optimize future experiments
given preliminary data
Example: use experimentally
derived (or literature estimated)
effect sizes, desired p-value
(alpha) and power (beta) to
calculate the optimal number of
samples per group
*finish lab
2-statistical
analysis
16. bivariate vs.
multivariate
(scatter plot)
outliers?
mixed up samples
(PCA scores plot)
Outlier Detection
17. Batch Effects
Drift in >400 replicated measurements across >100 analytical batches for a single analyte
Principal Component
Analysis (PCA) of all
analytes, showing QC
sample scores
Acquisition batch
Abundance
QCs embedded
among >5,5000
samples (1:10)
collected over
1.5 yrs
If the biological effect
size is less than the
analytical variance
then the experiment
will incorrectly yield
insignificant results
18. Analyte specific data quality
overview
Sample specific normalization can be used
to estimate and remove analytical variance
Raw Data Normalized Data
low precision
log mean
%RSD
high precision
Samples
QCs
Batch Effects
*finish lab 3-Data Normalization
20. Cluster Analysis
Use the concept similarity/dissimilarity
to group a collection of samples or
variables
Approaches
•hierarchical (HCA)
•non-hierarchical (k-NN, k-means)
•distribution (mixtures models)
•density (DBSCAN)
•self organizing maps (SOM)
Linkage k-means
Distribution Density
21. Hierarchical Cluster Analysis
• similarity/dissimilarity
defines “nearness” or
distance
euclidean
X
Y
manhattan Mahalanobis
X
Y
X
Y
*
non-euclidean
22. Hierarchical Cluster Analysis
Agglomerative/linkage algorithm
defines how points are grouped
single complete centroid average
24. Hierarchical Cluster Analysis
How does my metadata
match my data structure?
Exploration Confirmation
*finish lab 4-Cluster Analysis
25. Projection of Data
The algorithm defines the position of the light source
Principal Components Analysis (PCA)
• unsupervised
• maximize variance (X)
Partial Least Squares Projection to
Latent Structures (PLS)
• supervised
• maximize covariance (Y ~ X)
James X. Li, 2009, VisuMap Tech.
29. Use PLS to test a hypothesis on a
multivariate level
Partial Least Squares (PLS) is used to identify maximum modes of
covariance between X measurements and Y (hypotheses)
PCA PLS
time = 0 120 min.
31. PLS Related Objects
Model
•dimensions, latent variables (LV)
•performance metrics (Q2, RMSEP, etc)
•validation (training/testing, permutation, cross-validation)
•orthogonal correction
Samples
•scores
•predicted values
•residuals
Variables
•Loadings
•Coefficients: summary of loadings based on all LVs
•VIP: variable importance in projection
•Feature selection
32. “goodness” of the model is all about the
perspective
Determine in-sample (Q2) and out-of-
sample error (RMSEP) and
compare to a random model
•permutation tests
•training/testing
*finish lab 6-Partial Least Squares and lab 7-Data Analysis Case Study
41. Correlation Networks
•can be difficult to interpret
•poorly discriminate between direct and indirect
associations
Complex lipids correlation network in mouse heart tissue
42. Partial correlations can
help simplify networks
and preference direct
over indirect
associations.
10.1007/978-1-4614-1689-0_17
Complex lipids partial correlation
network in human plasma
43. Mass Spectral Connections
Watrous J et al. PNAS 2012;109:E1743-E1752 *finish lab 10-Network Mapping II
44. Software and Resources
•DeviumWeb- Dynamic multivariate data analysis and
visualization platform
url: https://github.com/dgrapov/DeviumWeb
•imDEV- Microsoft Excel add-in for multivariate analysis
url: http://sourceforge.net/projects/imdev/
•MetaMapR- Network analysis tools for metabolomics
url: https://github.com/dgrapov/MetaMapR
•TeachingDemos- Tutorials and demonstrations
•url: http://sourceforge.net/projects/teachingdemos/?source=directory
•url: https://github.com/dgrapov/TeachingDemos
•Data analysis case studies and Examples
url: http://imdevsoftware.wordpress.com/