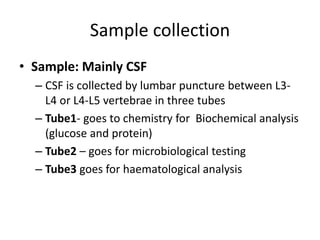
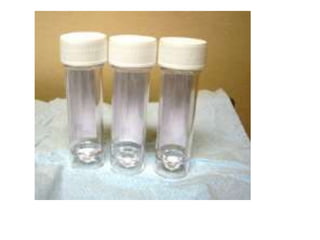
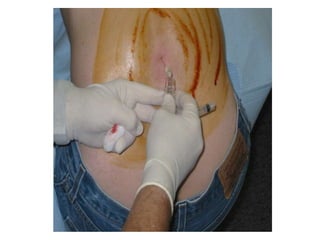
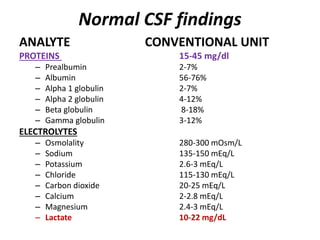
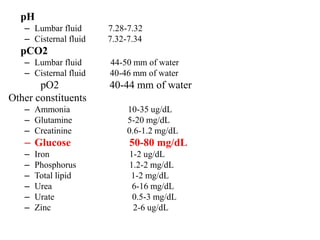
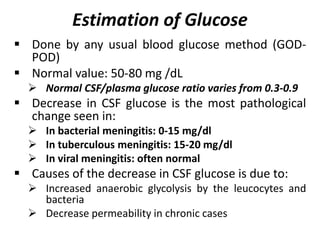
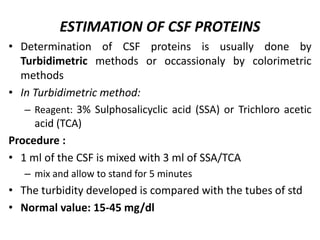
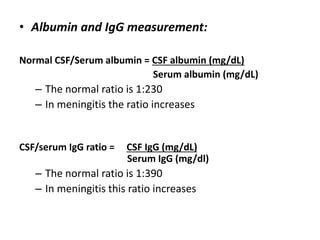
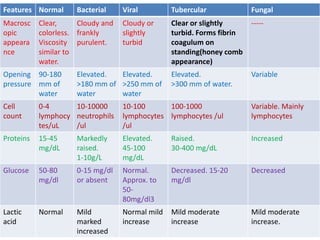
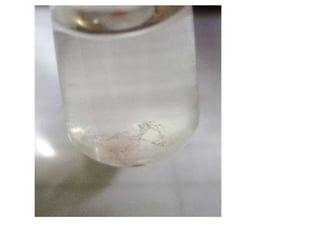
MENINGITIS
Group F, Dept. of Biochemistry
Resource faculty: Raju Kumar Dubey
Presenter: - Mr. Shiv K. Chaudhary
Group members
• Mr. Surendra Mahato
• Mr. Umesh Shah
• Mrs. Shivani Bhandhari
• Mr. Anish Sah
• Mr. Suman Pudasaini
• Mr. Rajkumar Shrestha
• Mr. Shiv K. Chaudhary
• Mr. Raju Kumar Sah
• Mrs. Pabitra Thapaliya
• Mr. Nagendra Shris
Introduction
• Infectious disease involving mainly the
inflammation of leptomeninges (aracnoid-
piamater)
• If infection spread to brain parenchyma it is
meningoencephalitis
• It may be caused by bacteria, virus, fungi,
parasites
• It is characterised by
– Pyrexia
– Headache
– Meningism
– Photophobia
– Kernig’s sign
– Brudunski’s sign
Etiological Classification
 Bacterial or pyogenic
 Viral
 Tubercular
 Fungal
 Syphilitic
Sample collection
• Sample: Mainly CSF
– CSF is collected by lumbar puncture between L3-
L4 or L4-L5 vertebrae in three tubes
– Tube1- goes to chemistry for Biochemical analysis
(glucose and protein)
– Tube2 – goes for microbiological testing
– Tube3 goes for haematological analysis
Normal CSF findings
ANALYTE CONVENTIONAL UNIT
PROTEINS 15-45 mg/dl
– Prealbumin 2-7%
– Albumin 56-76%
– Alpha 1 globulin 2-7%
– Alpha 2 globulin 4-12%
– Beta globulin 8-18%
– Gamma globulin 3-12%
ELECTROLYTES
– Osmolality 280-300 mOsm/L
– Sodium 135-150 mEq/L
– Potassium 2.6-3 mEq/L
– Chloride 115-130 mEq/L
– Carbon dioxide 20-25 mEq/L
– Calcium 2-2.8 mEq/L
– Magnesium 2.4-3 mEq/L
– Lactate 10-22 mg/dL
pH
– Lumbar fluid 7.28-7.32
– Cisternal fluid 7.32-7.34
pCO2
– Lumbar fluid 44-50 mm of water
– Cisternal fluid 40-46 mm of water
pO2 40-44 mm of water
Other constituents
– Ammonia 10-35 ug/dL
– Glutamine 5-20 mg/dL
– Creatinine 0.6-1.2 mg/dL
– Glucose 50-80 mg/dL
– Iron 1-2 ug/dL
– Phosphorus 1.2-2 mg/dL
– Total lipid 1-2 mg/dL
– Urea 6-16 mg/dL
– Urate 0.5-3 mg/dL
– Zinc 2-6 ug/dL
Estimation of Glucose
 Done by any usual blood glucose method (GOD-
POD)
 Normal value: 50-80 mg /dL
 Normal CSF/plasma glucose ratio varies from 0.3-0.9
 Decrease in CSF glucose is the most pathological
change seen in:
 In bacterial meningitis: 0-15 mg/dl
 In tuberculous meningitis: 15-20 mg/dl
 In viral meningitis: often normal
 Causes of the decrease in CSF glucose is due to:
 Increased anaerobic glycolysis by the leucocytes and
bacteria
 Decrease permeability in chronic cases
ESTIMATION OF CSF PROTEINS
• Determination of CSF proteins is usually done by
Turbidimetric methods or occassionaly by colorimetric
methods
• In Turbidimetric method:
– Reagent: 3% Sulphosalicyclic acid (SSA) or Trichloro acetic
acid (TCA)
Procedure :
• 1 ml of the CSF is mixed with 3 ml of SSA/TCA
– mix and allow to stand for 5 minutes
• The turbidity developed is compared with the tubes of std
• Normal value: 15-45 mg/dl
• Albumin and IgG measurement:
Normal CSF/Serum albumin = CSF albumin (mg/dL)
Serum albumin (mg/dL)
– The normal ratio is 1:230
– In meningitis the ratio increases
CSF/serum IgG ratio = CSF IgG (mg/dL)
Serum IgG (mg/dl)
– The normal ratio is 1:390
– In meningitis this ratio increases
CSF IgG index = CSF IgG (mg/dL) x serum albumin(g/dL)
serum IgG(g/dL) x CSF albumin(mg/dL)
The reference range for the index is 0.25 to 0.80
The index is elevated when there is increased CNS IgG
production such as in MS
The IgG index is decreased when the integrity of the BBB
is compromised, as in meningitis and tumors
Causes of the increase in the protein level
• Either due to Increased permeability of blood CSF barrier and brain CSF
barrier
• Or, Increase in intrathecal immunoglobulins synthesis
 Other CSF proteins:
 Alpha 2 macroglobulins
– significant elevation occurs in bacterial meningitis. So it helps in the rapid
differentiation between bacterial and aseptic meningitis
 C reactive protein (CRP)
 CSF CRP is useful in differentiating the viral meningitis from bacterial
meningitis
 CSF CRP is is more useful screening test for viral vs. bacterial meningitis in
children
 It is increased in bacterial meningitis; more in gram negative than in gram
positive
 Fibronectin
– elevation reported in bacterial meningitis while decreased level is observed
in viral meningitis
• Electrophoresis of CSF protein:
– It shows the presence of many different globulins
– When done in cellulose acetate/ or agar gel the
proteins are separated into different fractions
– When expressed as % of total proteins of CSF the
typical findings are
Prealbumin 2-7%
Albumin 56-76%
Alpha 1 globulin 2-7%
Alpha 2 globulin 4-12%
Beta globulin 8-18%
Gamma globulin 3-12%
• Electrophoretic patterns of CSF show
oligoclonal bands, in the globulin zone
representing antibodies directed against a
variety of antigenic targets
Lactate estimation
Normal range= 10-22 mg/dL
• Lactate measurement have been used as the
adjunctive test for differentiating viral from
bacterial meningitis
• In patients with the viral meningitis lactate level is
usually below the 25 mg/dL whereas in bacterial
meningitis its level is above 35 mg/dL
• The sensitivity and specificity are 80 and 90 %
respectively
Enzymes
• Adenosine deaminase (ADA):
– Its measurement has been recommended in tuberculous
meningitis
– ADA level >15 U/L is found to be a strong indication of
tuberculous meningitis
– In non tuberculous meningitis < 15U/L
• Creatine kinase (CK):
– Present in high concentration in brain tissues.
– Increase in CK has been observed in meningitis
– A dividing line of 30 U/L has been suggested
• >30 is suggested for tubercular meningitis and
• <30 pyogenic meningitis
• Lactate dehydrogenase:
– the sensitivity and specificity 70-85% depending
on the cutoff value. As with lactate LD activity is
also significantly higher in bacterial meningitis
than in aseptic meningitis.
• CSF lysozyme activity is significantly increased
in patients with both bacterial and
tuberculous meningitis.
Summary
Features Normal Bacterial Viral Tubercular Fungal
Macrosc
opic
appeara
nce
Clear,
colorless.
Viscosity
similar to
water.
Cloudy and
frankly
purulent.
Cloudy or
slightly
turbid
Clear or slightly
turbid. Forms fibrin
coagulum on
standing(honey comb
appearance)
-----
Opening
pressure
90-180
mm of
water
Elevated.
>180 mm of
water
Elevated.
>250 mm of
water
Elevated.
>300 mm of water.
Variable
Cell
count
0-4
lymphocy
tes/uL
10-10000
neutrophils
/ul
10-100
lymphocytes
/ul
100-1000
lymphocytes /ul
Variable. Mainly
lymphocytes
Proteins 15-45
mg/dL
Markedly
raised.
1-10g/L
Elevated.
45-100
mg/dL
Raised.
30-400 mg/dL
Increased
Glucose 50-80
mg/dl
0-15 mg/dl
or absent
Normal.
Approx. to
50-
80mg/dl3
Decreased. 15-20
mg/dl
Decreased
Lactic
acid
Normal Mild
marked
increased
Normal mild
increase
Mild moderate
increase
Mild moderate
increase.
THANK YOU FOR YOUR ATTENTION!!!

Meningitis

  • 1.
    MENINGITIS Group F, Dept.of Biochemistry Resource faculty: Raju Kumar Dubey Presenter: - Mr. Shiv K. Chaudhary
  • 2.
    Group members • Mr.Surendra Mahato • Mr. Umesh Shah • Mrs. Shivani Bhandhari • Mr. Anish Sah • Mr. Suman Pudasaini • Mr. Rajkumar Shrestha • Mr. Shiv K. Chaudhary • Mr. Raju Kumar Sah • Mrs. Pabitra Thapaliya • Mr. Nagendra Shris
  • 3.
    Introduction • Infectious diseaseinvolving mainly the inflammation of leptomeninges (aracnoid- piamater) • If infection spread to brain parenchyma it is meningoencephalitis • It may be caused by bacteria, virus, fungi, parasites
  • 4.
    • It ischaracterised by – Pyrexia – Headache – Meningism – Photophobia – Kernig’s sign – Brudunski’s sign
  • 5.
    Etiological Classification  Bacterialor pyogenic  Viral  Tubercular  Fungal  Syphilitic
  • 6.
    Sample collection • Sample:Mainly CSF – CSF is collected by lumbar puncture between L3- L4 or L4-L5 vertebrae in three tubes – Tube1- goes to chemistry for Biochemical analysis (glucose and protein) – Tube2 – goes for microbiological testing – Tube3 goes for haematological analysis
  • 9.
    Normal CSF findings ANALYTECONVENTIONAL UNIT PROTEINS 15-45 mg/dl – Prealbumin 2-7% – Albumin 56-76% – Alpha 1 globulin 2-7% – Alpha 2 globulin 4-12% – Beta globulin 8-18% – Gamma globulin 3-12% ELECTROLYTES – Osmolality 280-300 mOsm/L – Sodium 135-150 mEq/L – Potassium 2.6-3 mEq/L – Chloride 115-130 mEq/L – Carbon dioxide 20-25 mEq/L – Calcium 2-2.8 mEq/L – Magnesium 2.4-3 mEq/L – Lactate 10-22 mg/dL
  • 10.
    pH – Lumbar fluid7.28-7.32 – Cisternal fluid 7.32-7.34 pCO2 – Lumbar fluid 44-50 mm of water – Cisternal fluid 40-46 mm of water pO2 40-44 mm of water Other constituents – Ammonia 10-35 ug/dL – Glutamine 5-20 mg/dL – Creatinine 0.6-1.2 mg/dL – Glucose 50-80 mg/dL – Iron 1-2 ug/dL – Phosphorus 1.2-2 mg/dL – Total lipid 1-2 mg/dL – Urea 6-16 mg/dL – Urate 0.5-3 mg/dL – Zinc 2-6 ug/dL
  • 11.
    Estimation of Glucose Done by any usual blood glucose method (GOD- POD)  Normal value: 50-80 mg /dL  Normal CSF/plasma glucose ratio varies from 0.3-0.9  Decrease in CSF glucose is the most pathological change seen in:  In bacterial meningitis: 0-15 mg/dl  In tuberculous meningitis: 15-20 mg/dl  In viral meningitis: often normal  Causes of the decrease in CSF glucose is due to:  Increased anaerobic glycolysis by the leucocytes and bacteria  Decrease permeability in chronic cases
  • 12.
    ESTIMATION OF CSFPROTEINS • Determination of CSF proteins is usually done by Turbidimetric methods or occassionaly by colorimetric methods • In Turbidimetric method: – Reagent: 3% Sulphosalicyclic acid (SSA) or Trichloro acetic acid (TCA) Procedure : • 1 ml of the CSF is mixed with 3 ml of SSA/TCA – mix and allow to stand for 5 minutes • The turbidity developed is compared with the tubes of std • Normal value: 15-45 mg/dl
  • 13.
    • Albumin andIgG measurement: Normal CSF/Serum albumin = CSF albumin (mg/dL) Serum albumin (mg/dL) – The normal ratio is 1:230 – In meningitis the ratio increases CSF/serum IgG ratio = CSF IgG (mg/dL) Serum IgG (mg/dl) – The normal ratio is 1:390 – In meningitis this ratio increases
  • 14.
    CSF IgG index= CSF IgG (mg/dL) x serum albumin(g/dL) serum IgG(g/dL) x CSF albumin(mg/dL) The reference range for the index is 0.25 to 0.80 The index is elevated when there is increased CNS IgG production such as in MS The IgG index is decreased when the integrity of the BBB is compromised, as in meningitis and tumors
  • 15.
    Causes of theincrease in the protein level • Either due to Increased permeability of blood CSF barrier and brain CSF barrier • Or, Increase in intrathecal immunoglobulins synthesis  Other CSF proteins:  Alpha 2 macroglobulins – significant elevation occurs in bacterial meningitis. So it helps in the rapid differentiation between bacterial and aseptic meningitis  C reactive protein (CRP)  CSF CRP is useful in differentiating the viral meningitis from bacterial meningitis  CSF CRP is is more useful screening test for viral vs. bacterial meningitis in children  It is increased in bacterial meningitis; more in gram negative than in gram positive  Fibronectin – elevation reported in bacterial meningitis while decreased level is observed in viral meningitis
  • 16.
    • Electrophoresis ofCSF protein: – It shows the presence of many different globulins – When done in cellulose acetate/ or agar gel the proteins are separated into different fractions – When expressed as % of total proteins of CSF the typical findings are
  • 17.
    Prealbumin 2-7% Albumin 56-76% Alpha1 globulin 2-7% Alpha 2 globulin 4-12% Beta globulin 8-18% Gamma globulin 3-12%
  • 18.
    • Electrophoretic patternsof CSF show oligoclonal bands, in the globulin zone representing antibodies directed against a variety of antigenic targets
  • 19.
    Lactate estimation Normal range=10-22 mg/dL • Lactate measurement have been used as the adjunctive test for differentiating viral from bacterial meningitis • In patients with the viral meningitis lactate level is usually below the 25 mg/dL whereas in bacterial meningitis its level is above 35 mg/dL • The sensitivity and specificity are 80 and 90 % respectively
  • 20.
    Enzymes • Adenosine deaminase(ADA): – Its measurement has been recommended in tuberculous meningitis – ADA level >15 U/L is found to be a strong indication of tuberculous meningitis – In non tuberculous meningitis < 15U/L • Creatine kinase (CK): – Present in high concentration in brain tissues. – Increase in CK has been observed in meningitis – A dividing line of 30 U/L has been suggested • >30 is suggested for tubercular meningitis and • <30 pyogenic meningitis
  • 21.
    • Lactate dehydrogenase: –the sensitivity and specificity 70-85% depending on the cutoff value. As with lactate LD activity is also significantly higher in bacterial meningitis than in aseptic meningitis. • CSF lysozyme activity is significantly increased in patients with both bacterial and tuberculous meningitis.
  • 22.
    Summary Features Normal BacterialViral Tubercular Fungal Macrosc opic appeara nce Clear, colorless. Viscosity similar to water. Cloudy and frankly purulent. Cloudy or slightly turbid Clear or slightly turbid. Forms fibrin coagulum on standing(honey comb appearance) ----- Opening pressure 90-180 mm of water Elevated. >180 mm of water Elevated. >250 mm of water Elevated. >300 mm of water. Variable Cell count 0-4 lymphocy tes/uL 10-10000 neutrophils /ul 10-100 lymphocytes /ul 100-1000 lymphocytes /ul Variable. Mainly lymphocytes Proteins 15-45 mg/dL Markedly raised. 1-10g/L Elevated. 45-100 mg/dL Raised. 30-400 mg/dL Increased Glucose 50-80 mg/dl 0-15 mg/dl or absent Normal. Approx. to 50- 80mg/dl3 Decreased. 15-20 mg/dl Decreased Lactic acid Normal Mild marked increased Normal mild increase Mild moderate increase Mild moderate increase.
  • 24.
    THANK YOU FORYOUR ATTENTION!!!

Editor's Notes