Downloaded 193 times


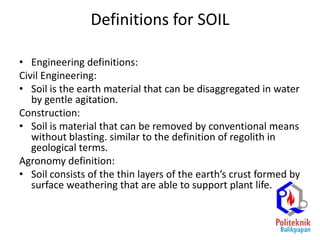
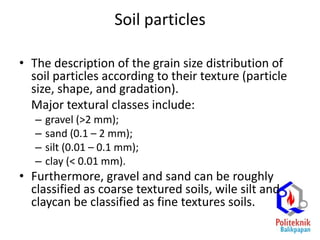
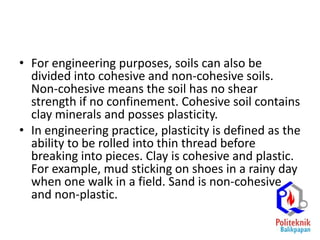
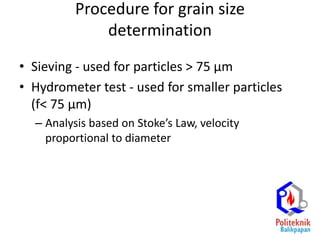
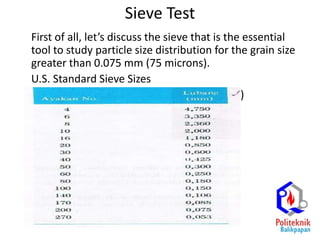
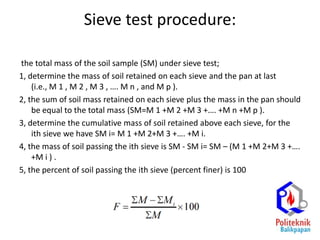
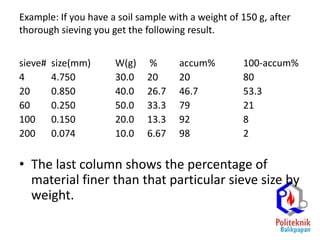
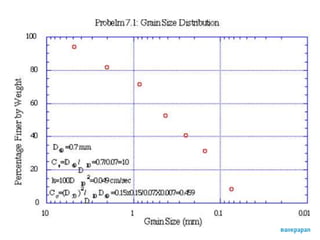
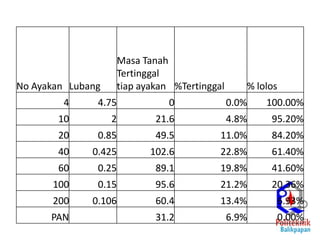
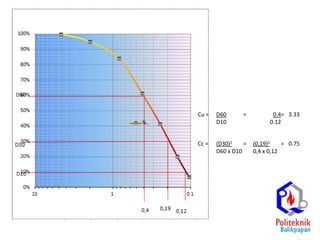
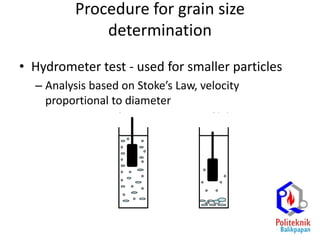
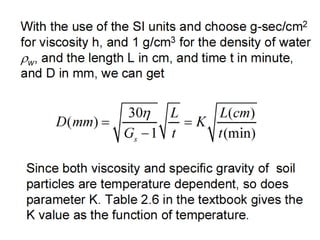
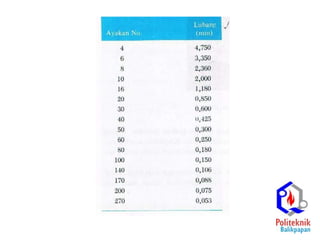
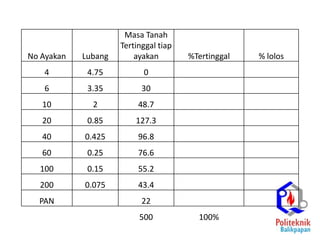

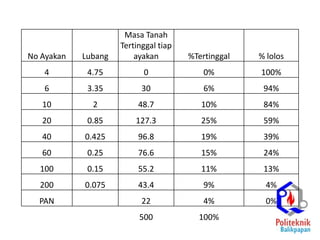
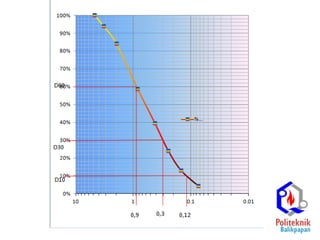
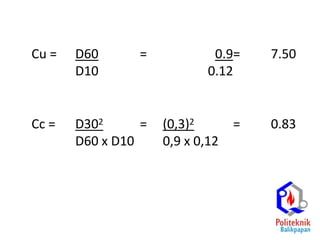
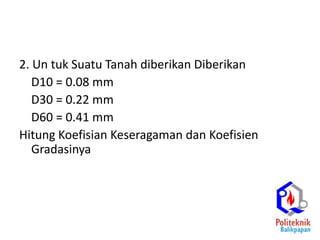
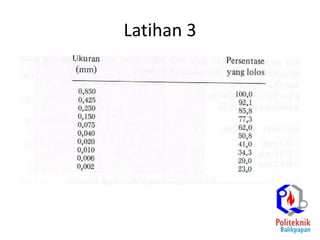

The document discusses procedures for determining soil particle size distribution through sieve and hydrometer tests. It provides definitions of soil, outlines sieve and hydrometer test procedures, and discusses relevant concepts like soil texture classes and particle shape. Sample calculations are shown for a sieve test involving determining particle sizes retained on various sieves, calculating percentages, and deriving distribution and uniformity coefficients. Practice problems are also provided to calculate coefficients based on given particle size data.


![Aliran Melalui Lubang [Hidraulika]](https://cdn.slidesharecdn.com/ss_thumbnails/aliranmelaluilubang-150623165952-lva1-app6891-thumbnail.jpg?width=640&height=640&fit=bounds)


![Geotechnical Engineering-I [Lec #7: Sieve Analysis-2]](https://cdn.slidesharecdn.com/ss_thumbnails/7-180923180808-thumbnail.jpg?width=640&height=640&fit=bounds)


