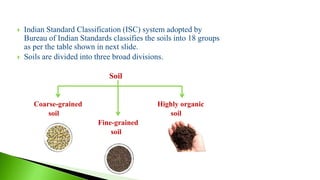
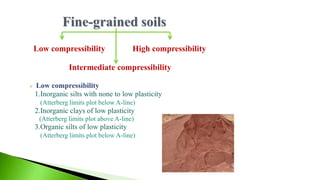
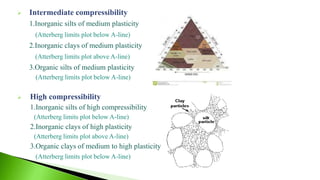
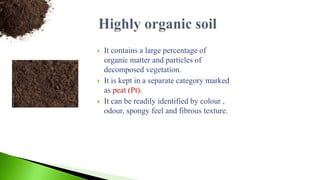
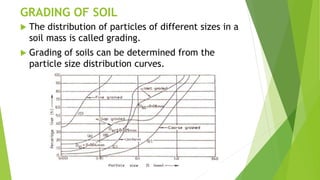
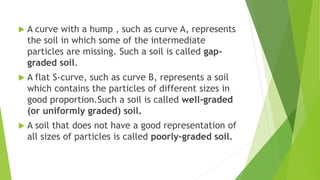
This document lists the names of students enrolled in Module 2 and the topics they will cover, which include various soil classification and testing methods like sieve analysis, hydrometer analysis, permeability tests, and consistency limits. Sieve analysis and hydrometer analysis are described in detail, explaining how to determine the particle size distribution of soils. The concepts of well graded, gap graded and poorly graded soils and relative density of soils are also introduced.

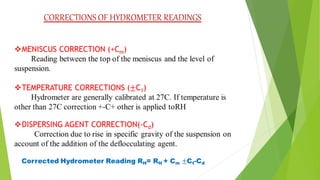
![According to stoke’s law
Where,
• V = Terminal velocity of soil grain with diameter D(cm/sec)
• VS = Unit weight of soil grains (gm/cc) = G
• Vs = Unit weight of liquid (gm/cc)
• N = viscosity of liquid (gm-sec/cm2)
• U = Viscosity in poise (dyne sec/cm2)
• G = acceleration due to gravity (cm/sec2)
• D = Diameter of grain (cm)
• [ 1 Dyne = 10-5 N = 1/981 gm]](https://image.slidesharecdn.com/geotechnicalengineering1-module2-221210015609-92e6fd7b/85/Geotechnical-engineering-1-Module-2-pptx-14-320.jpg)