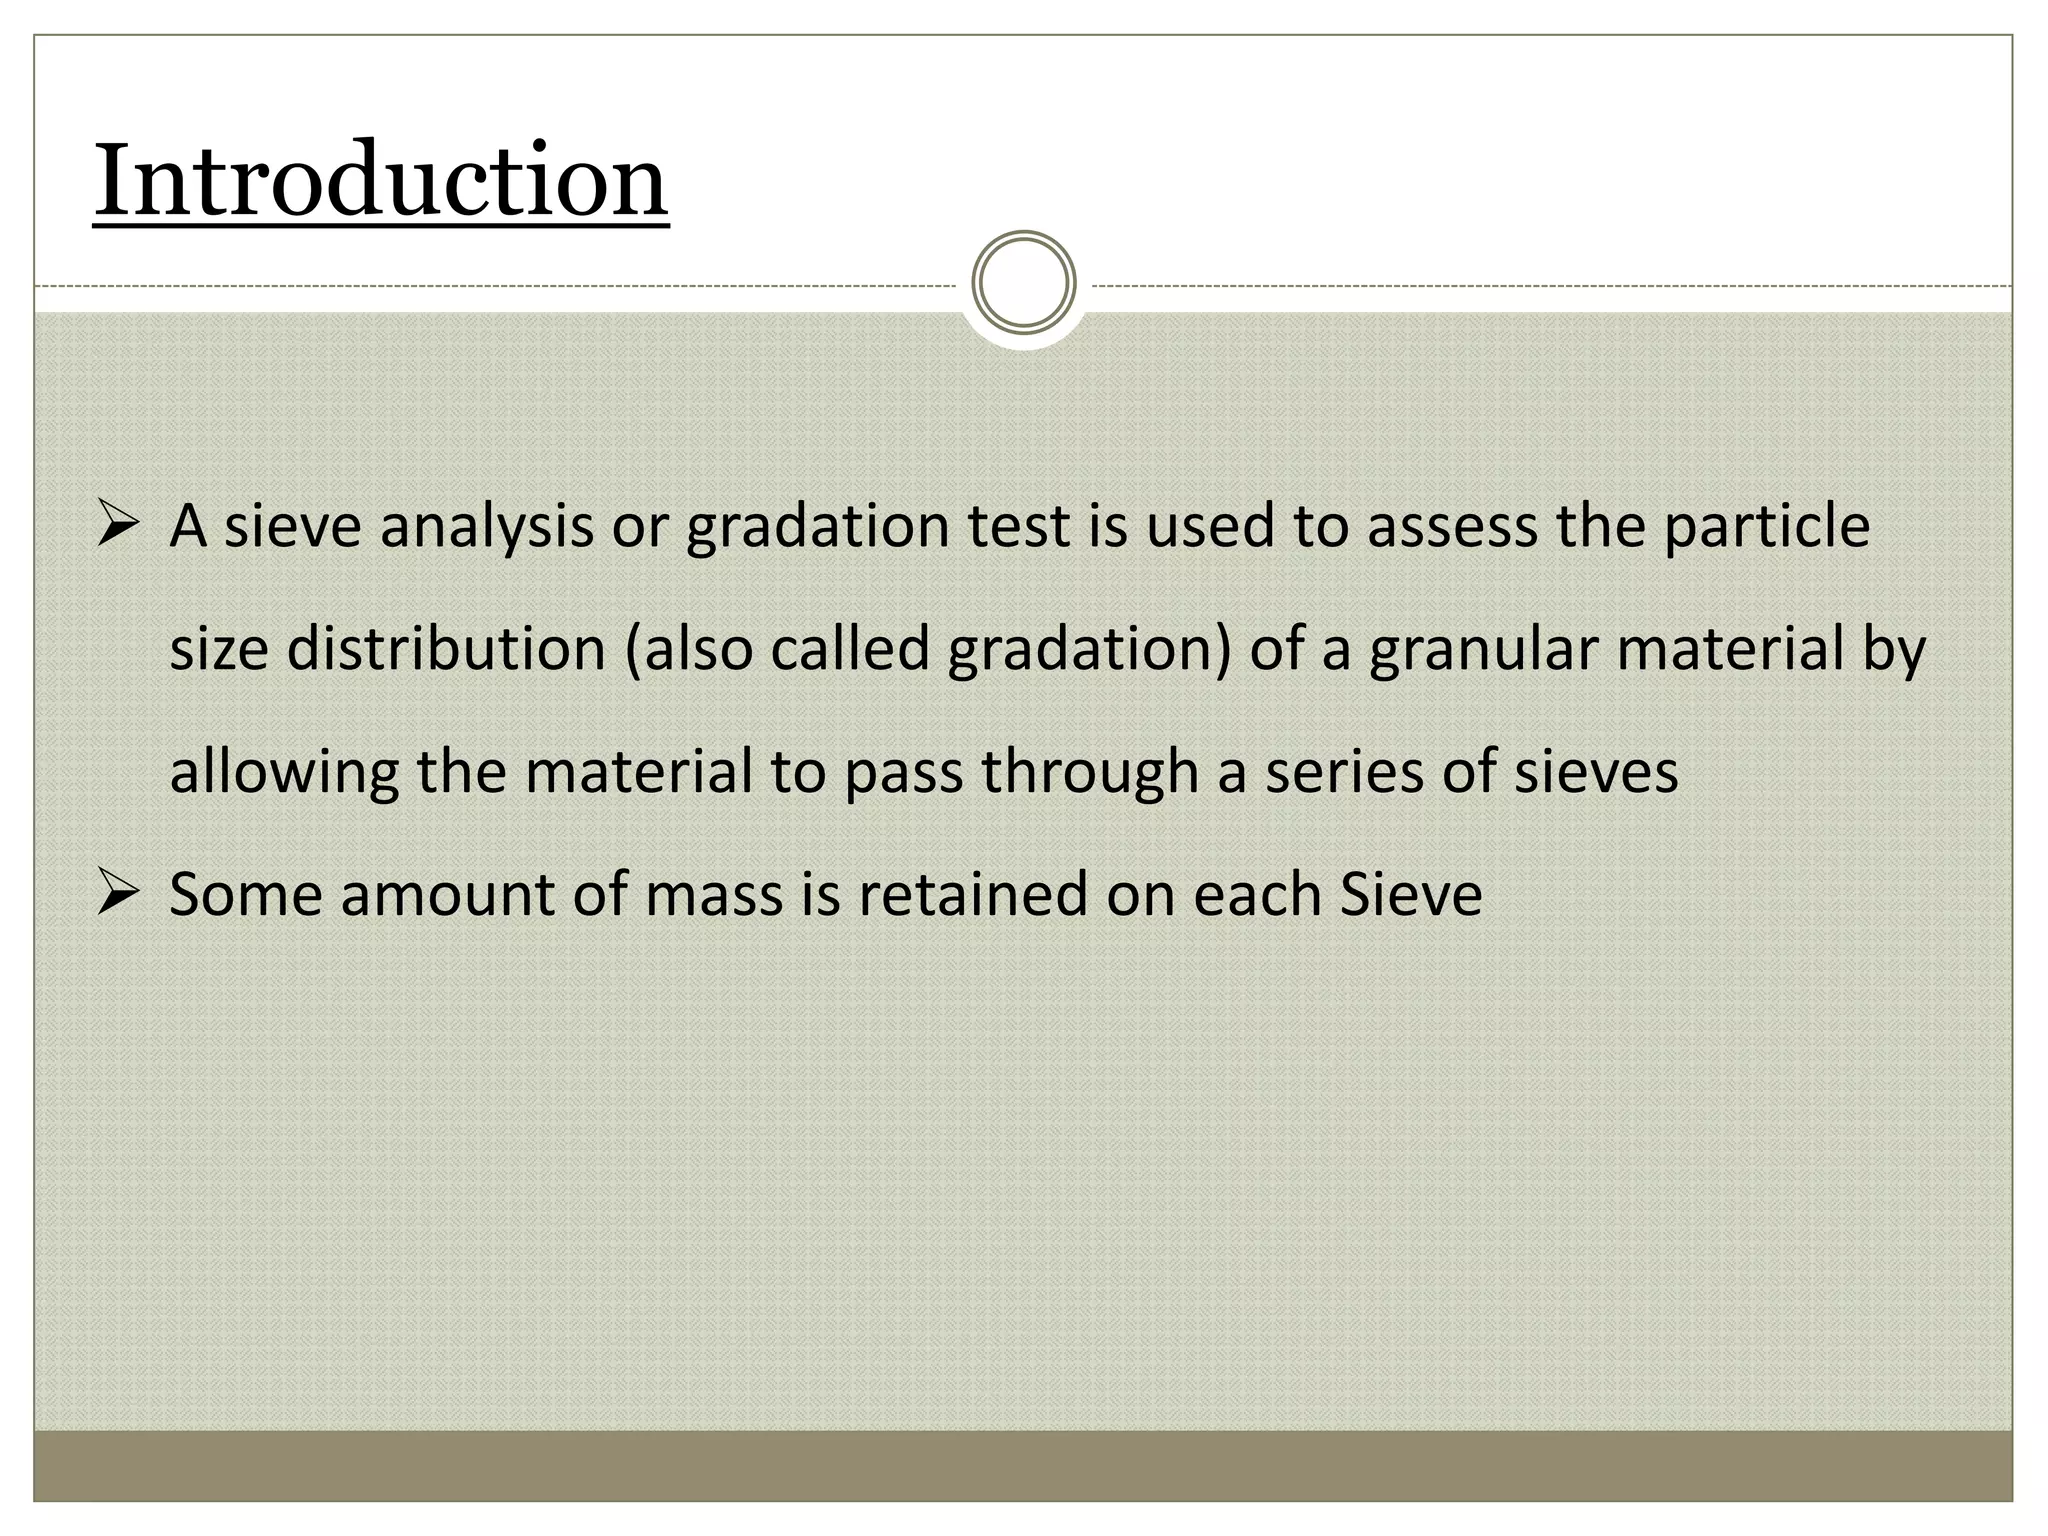
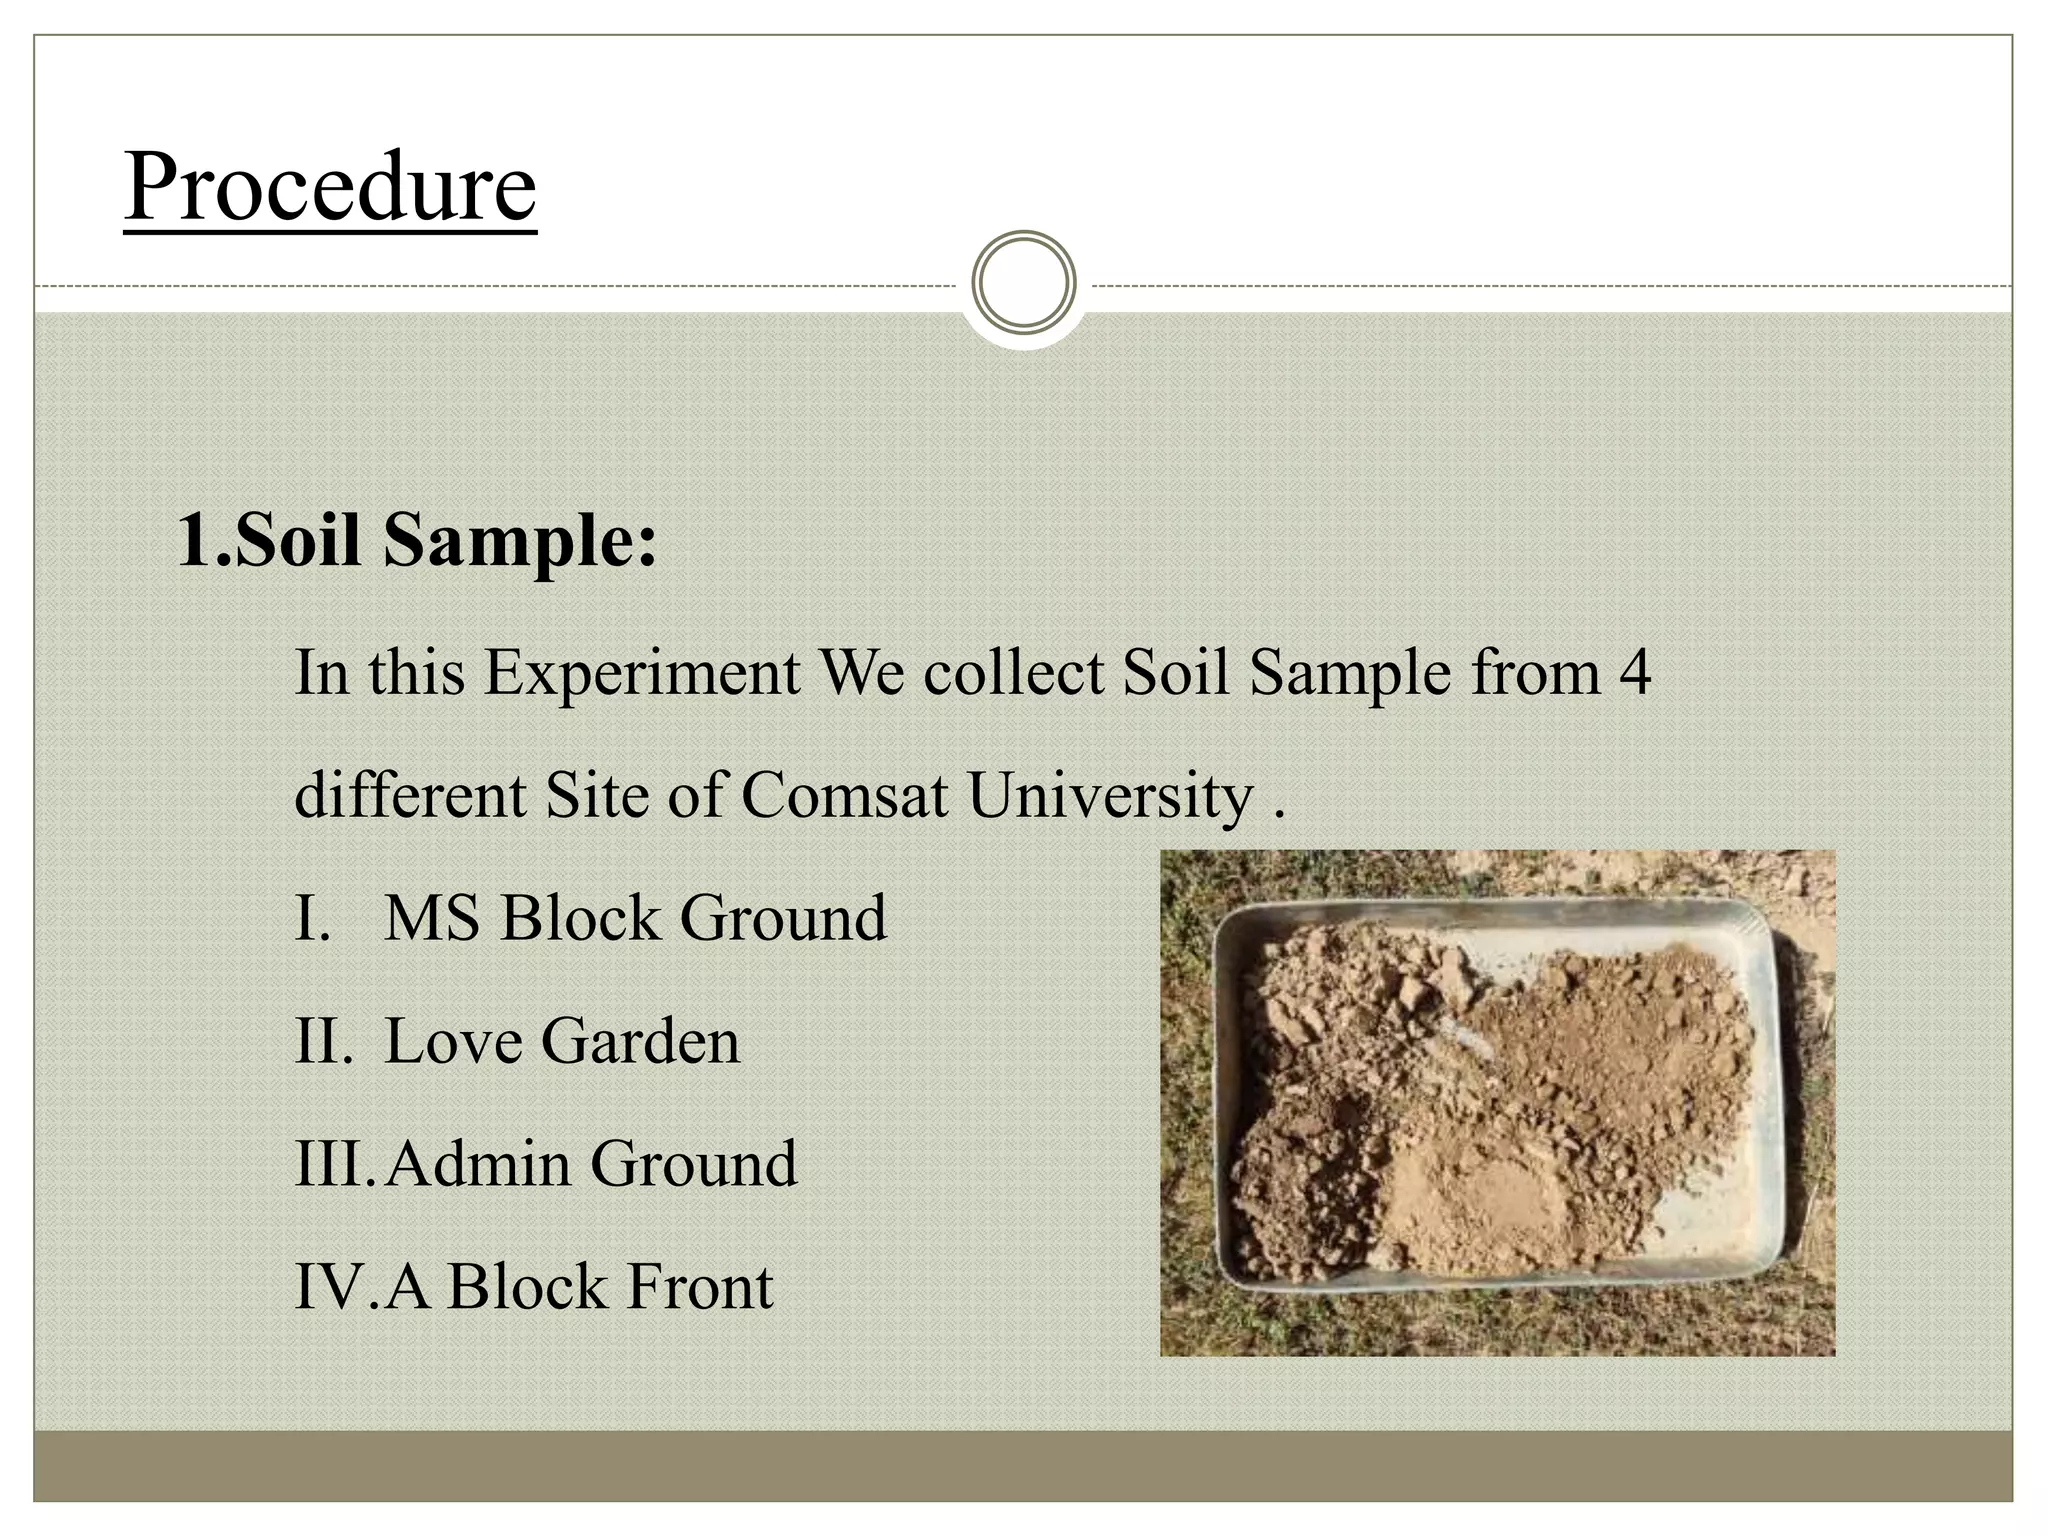
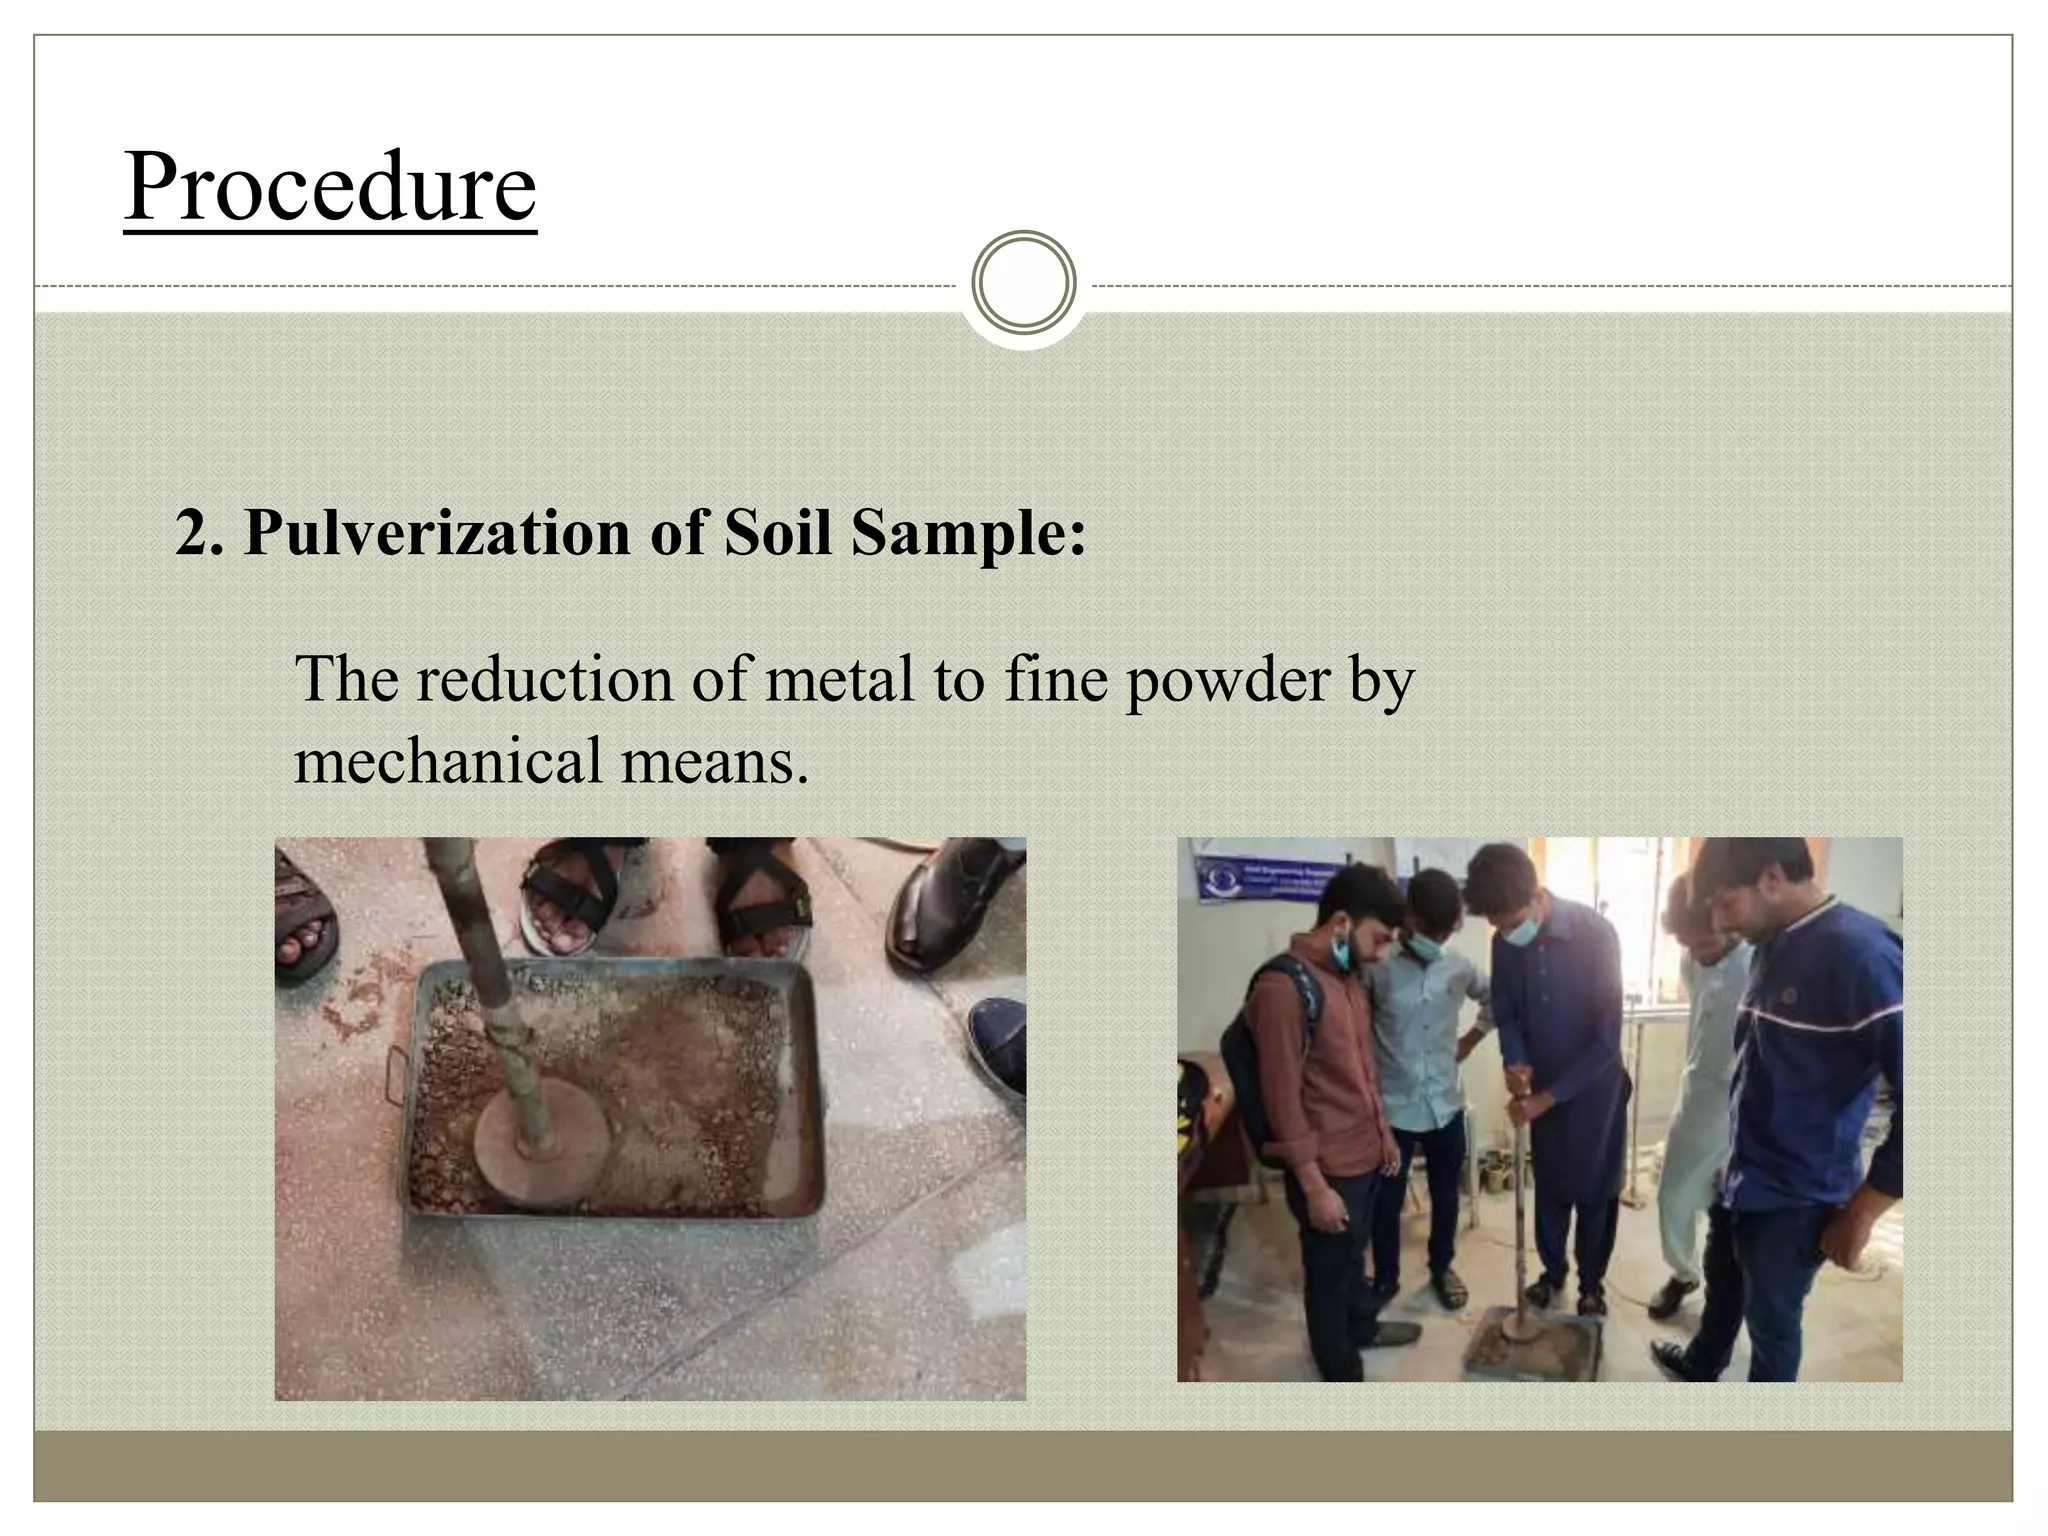
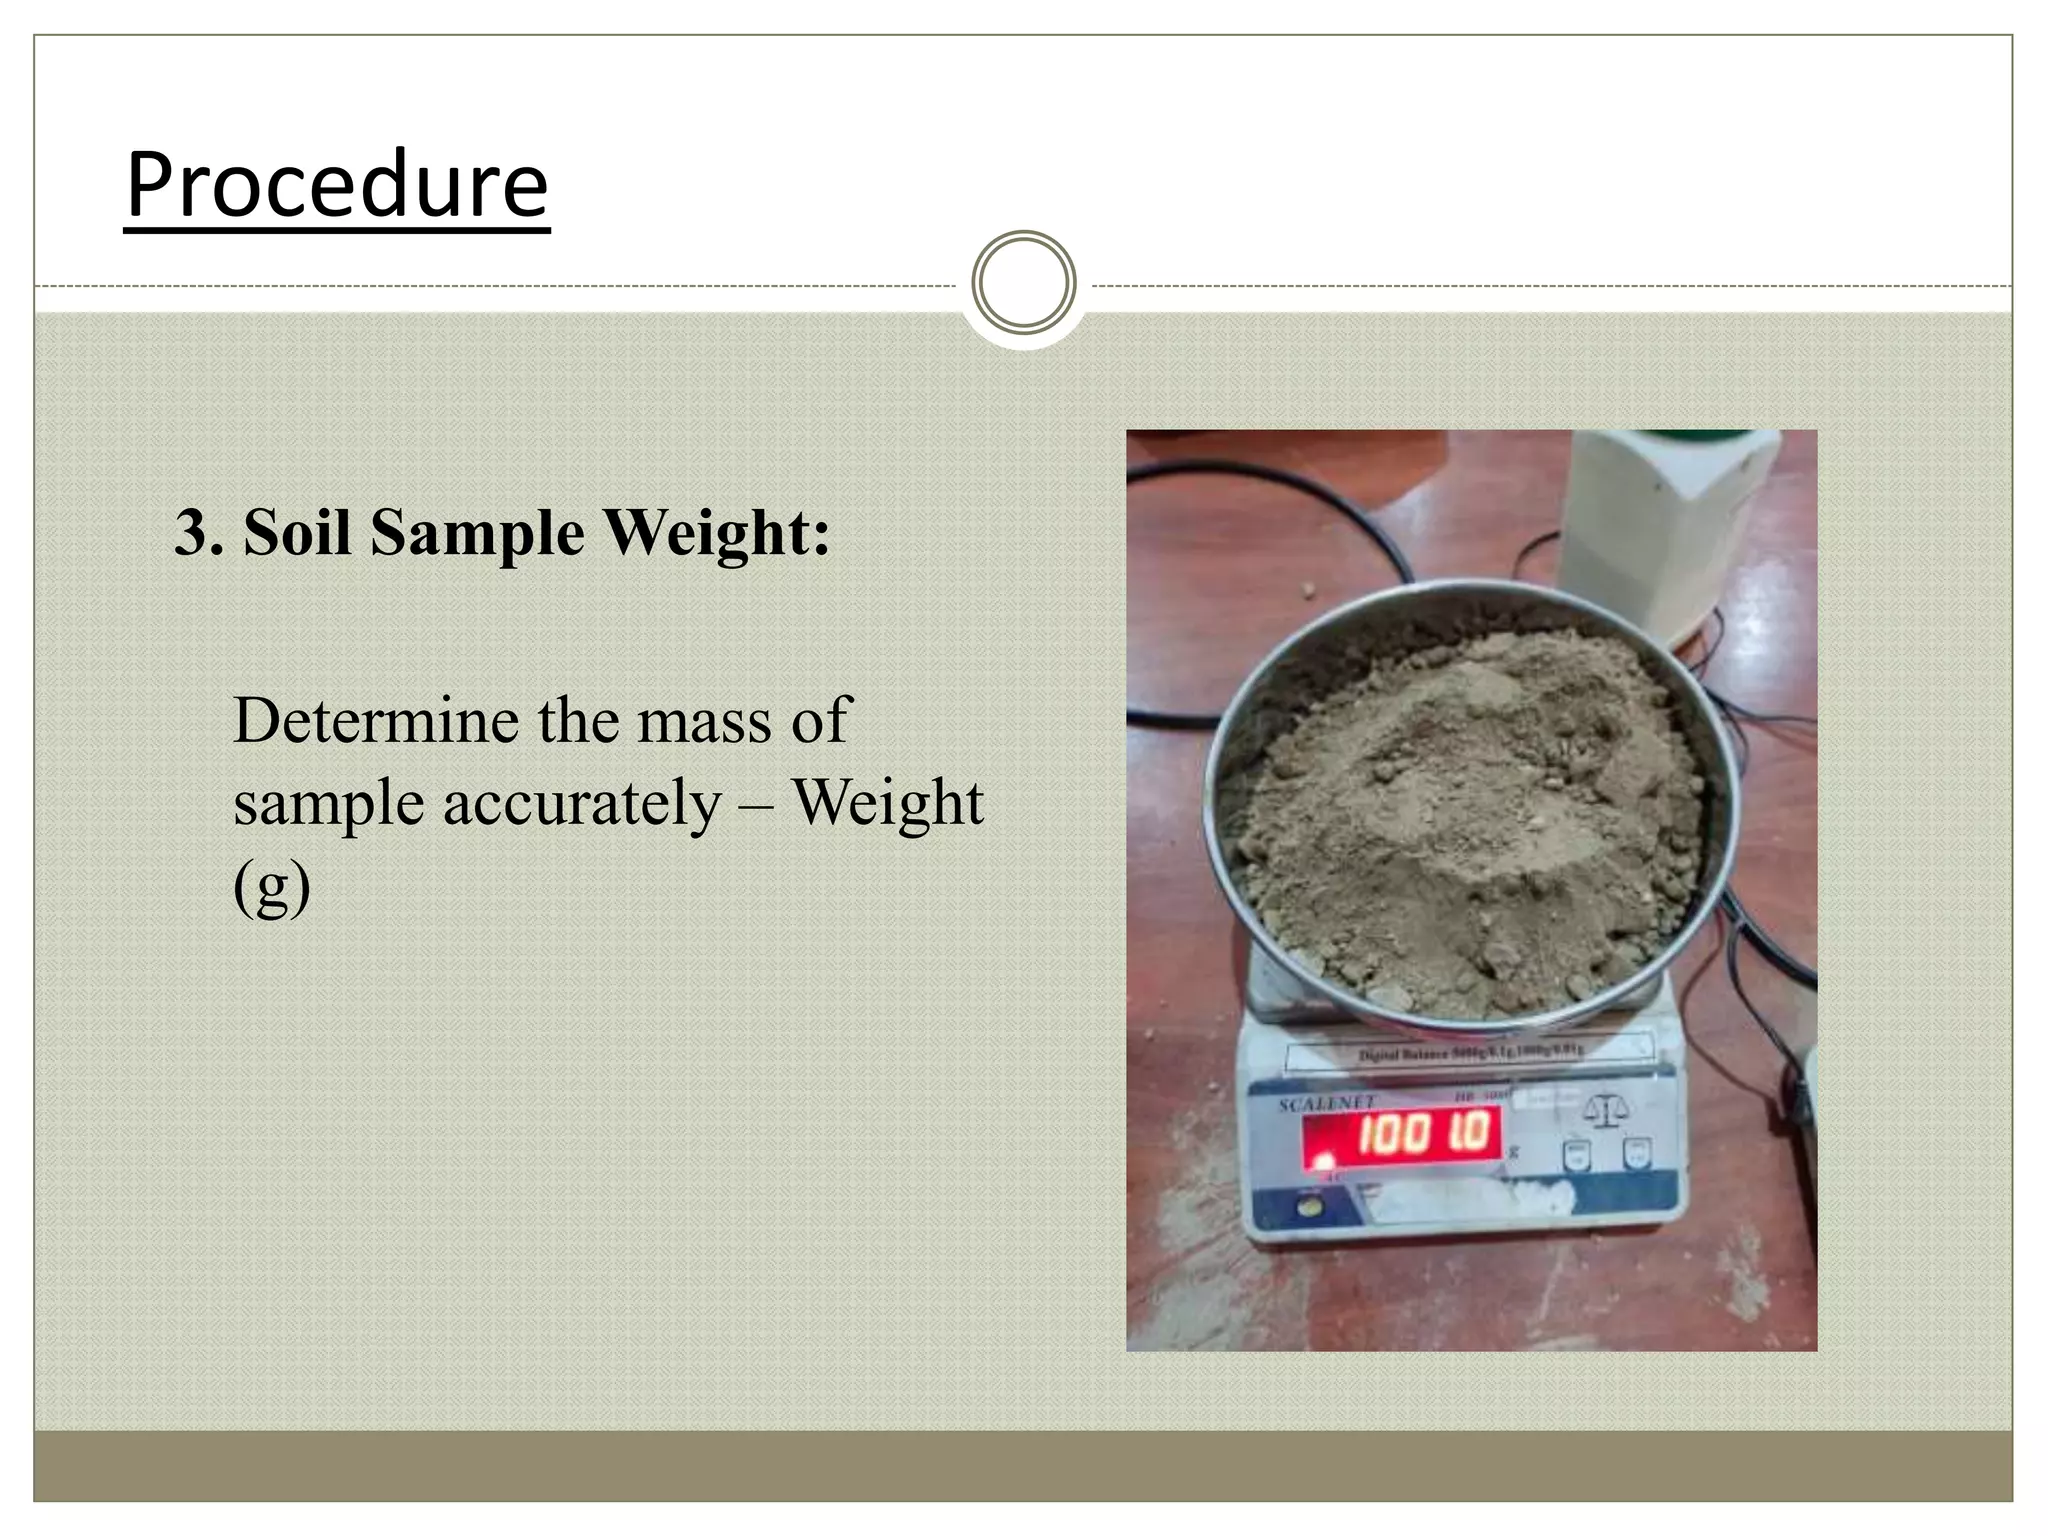
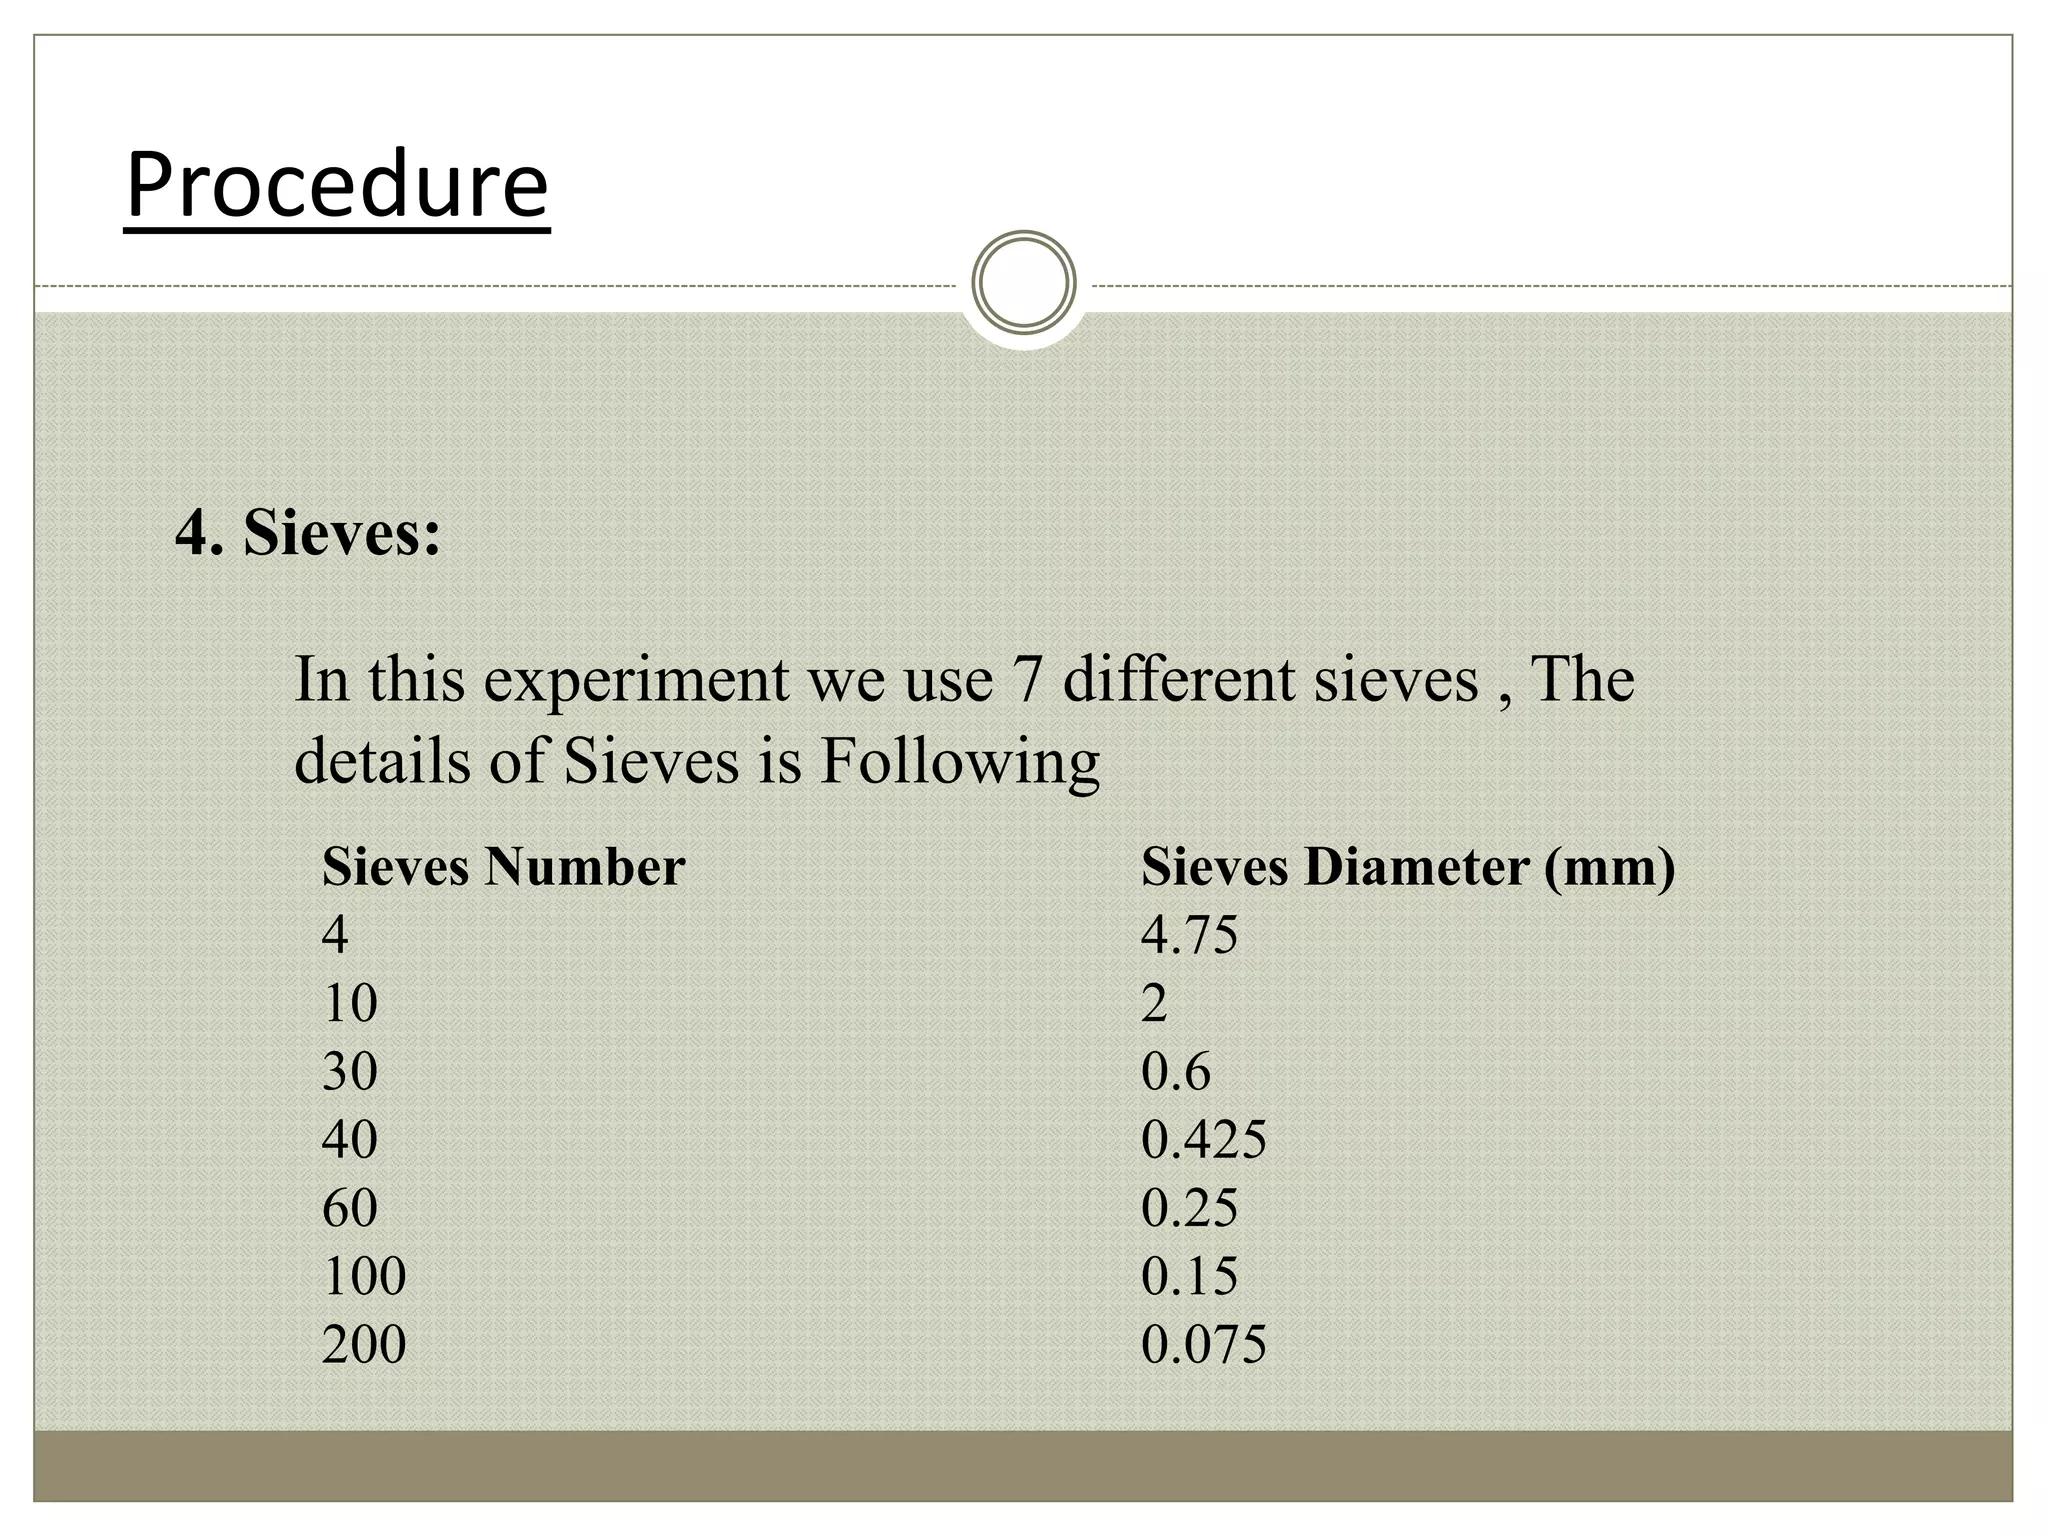
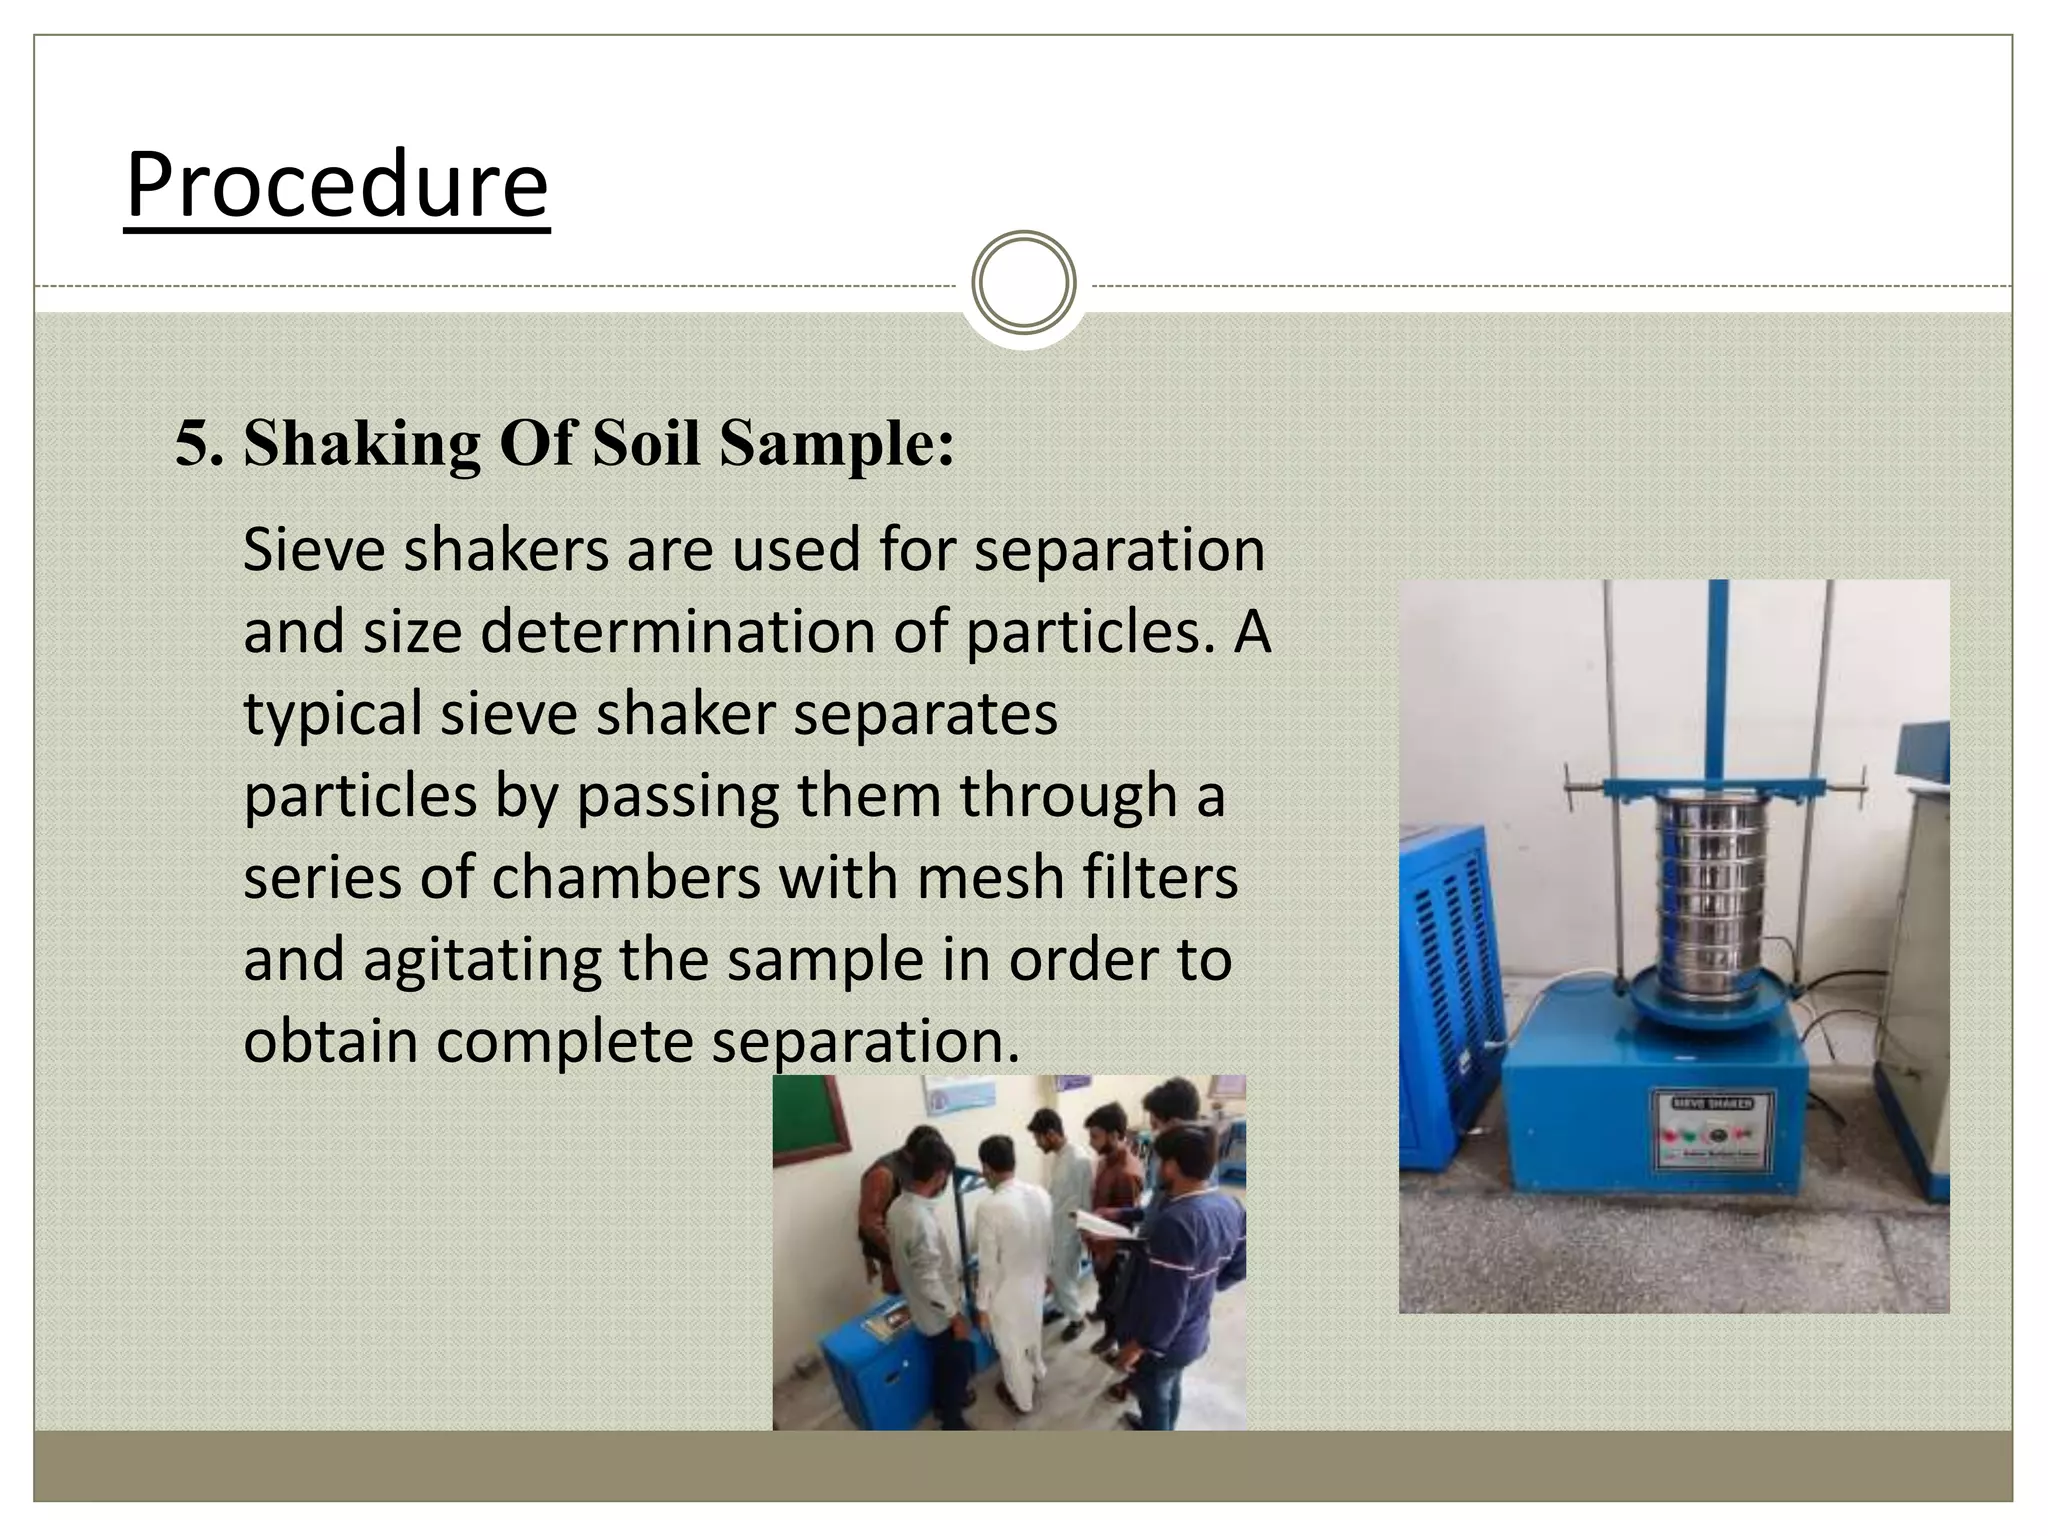
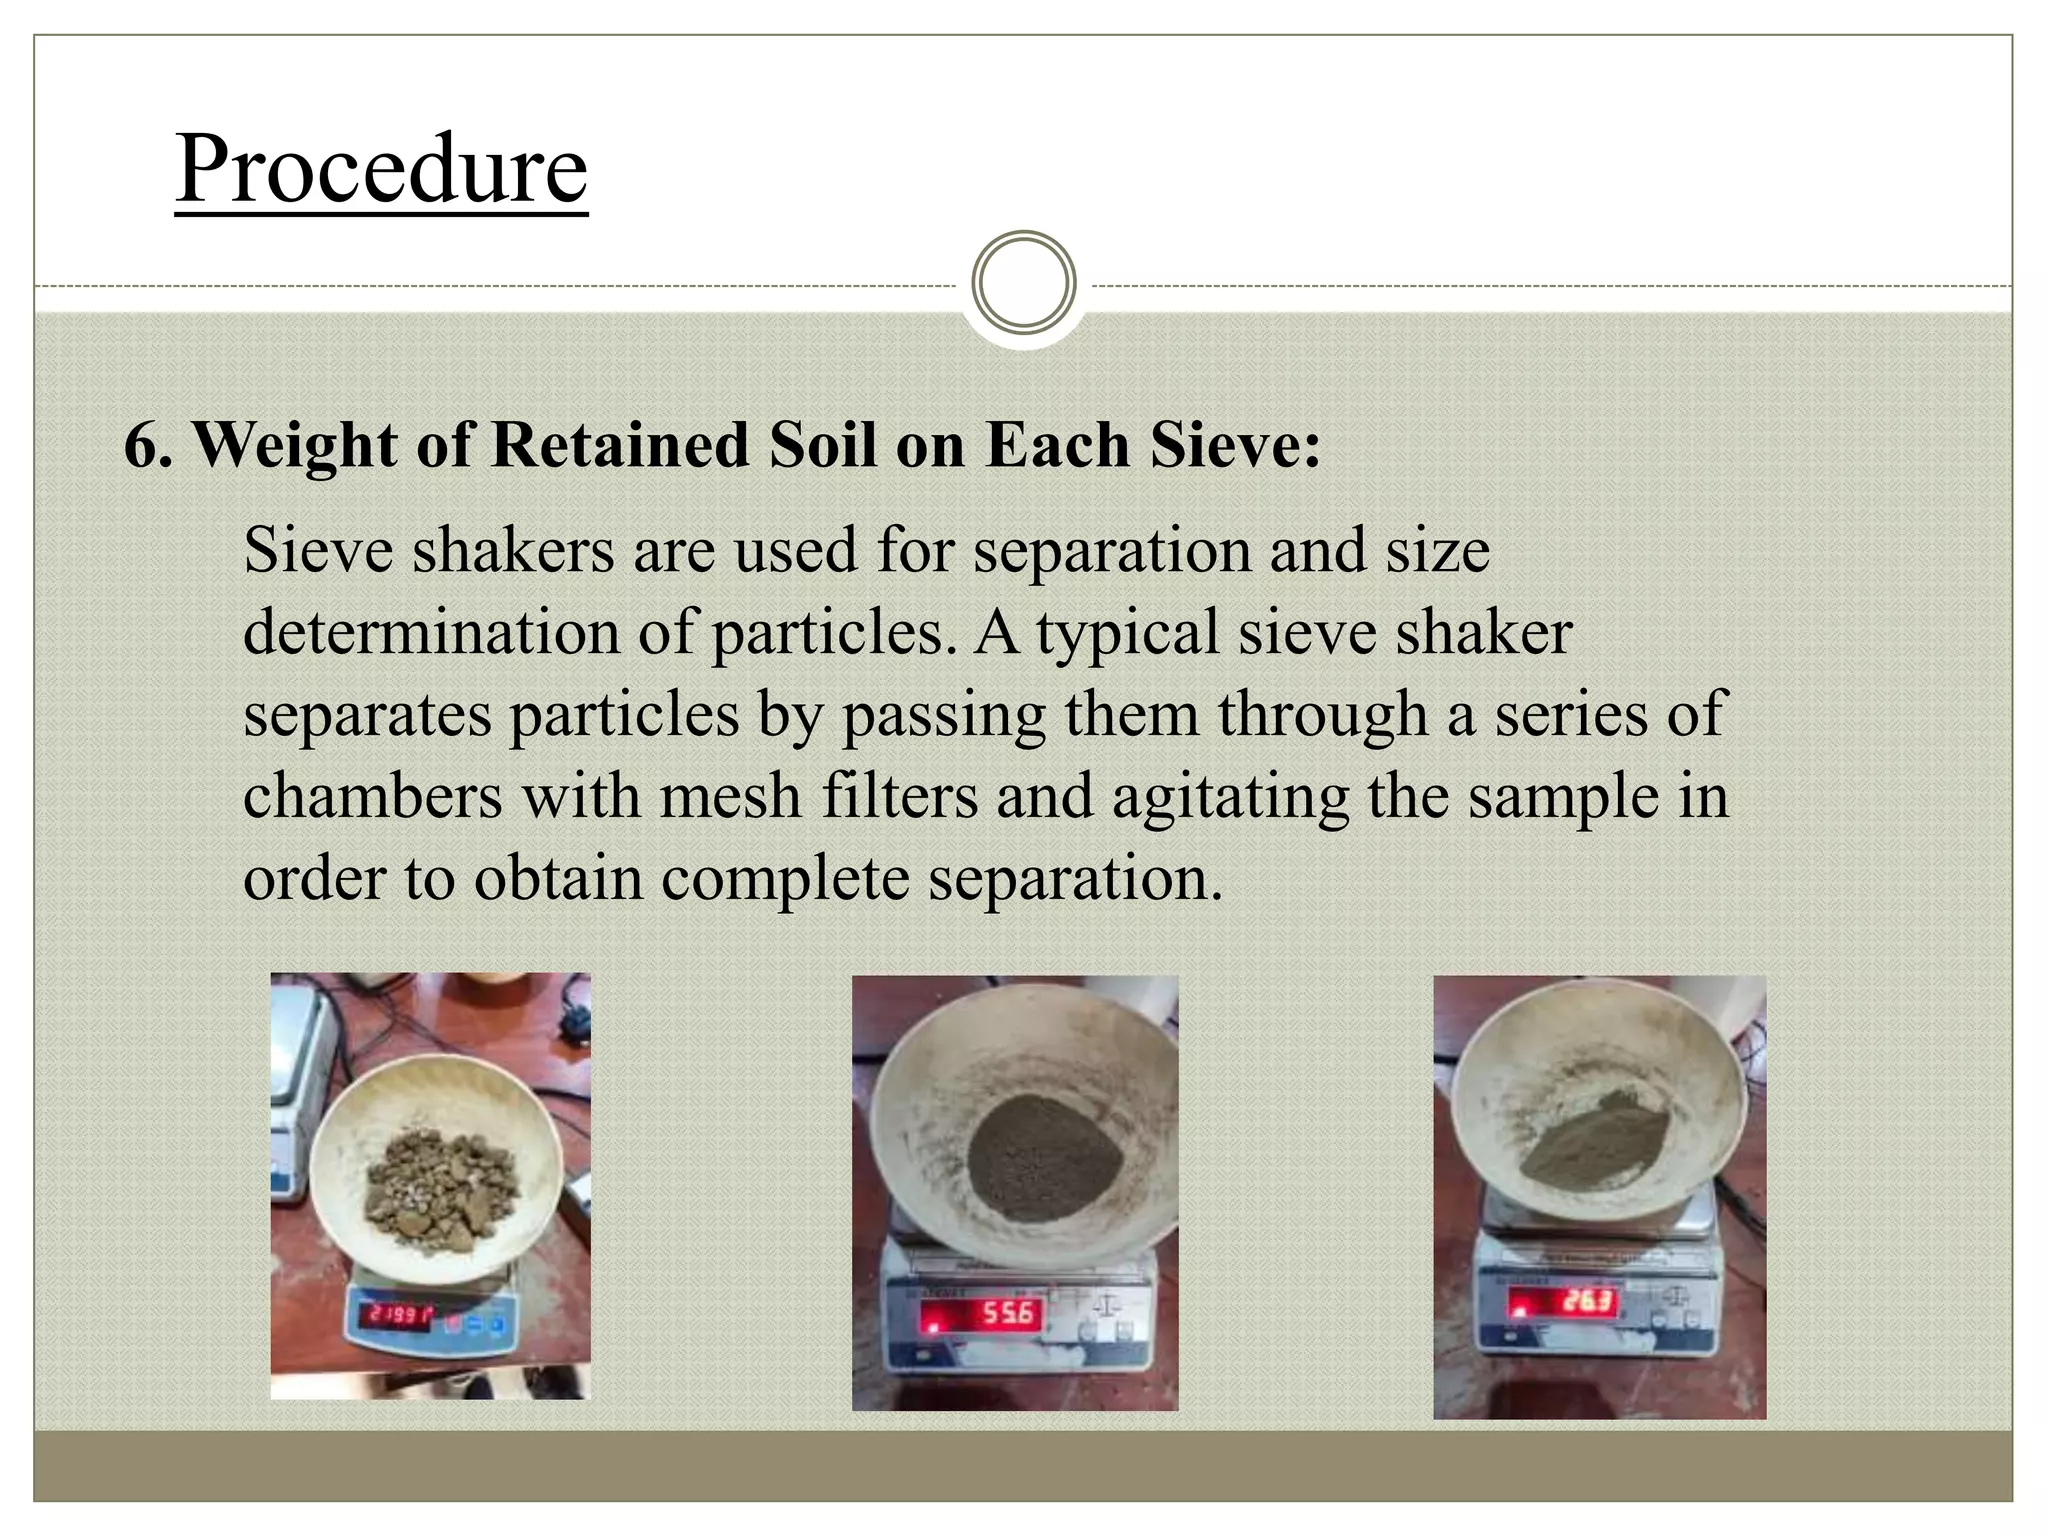
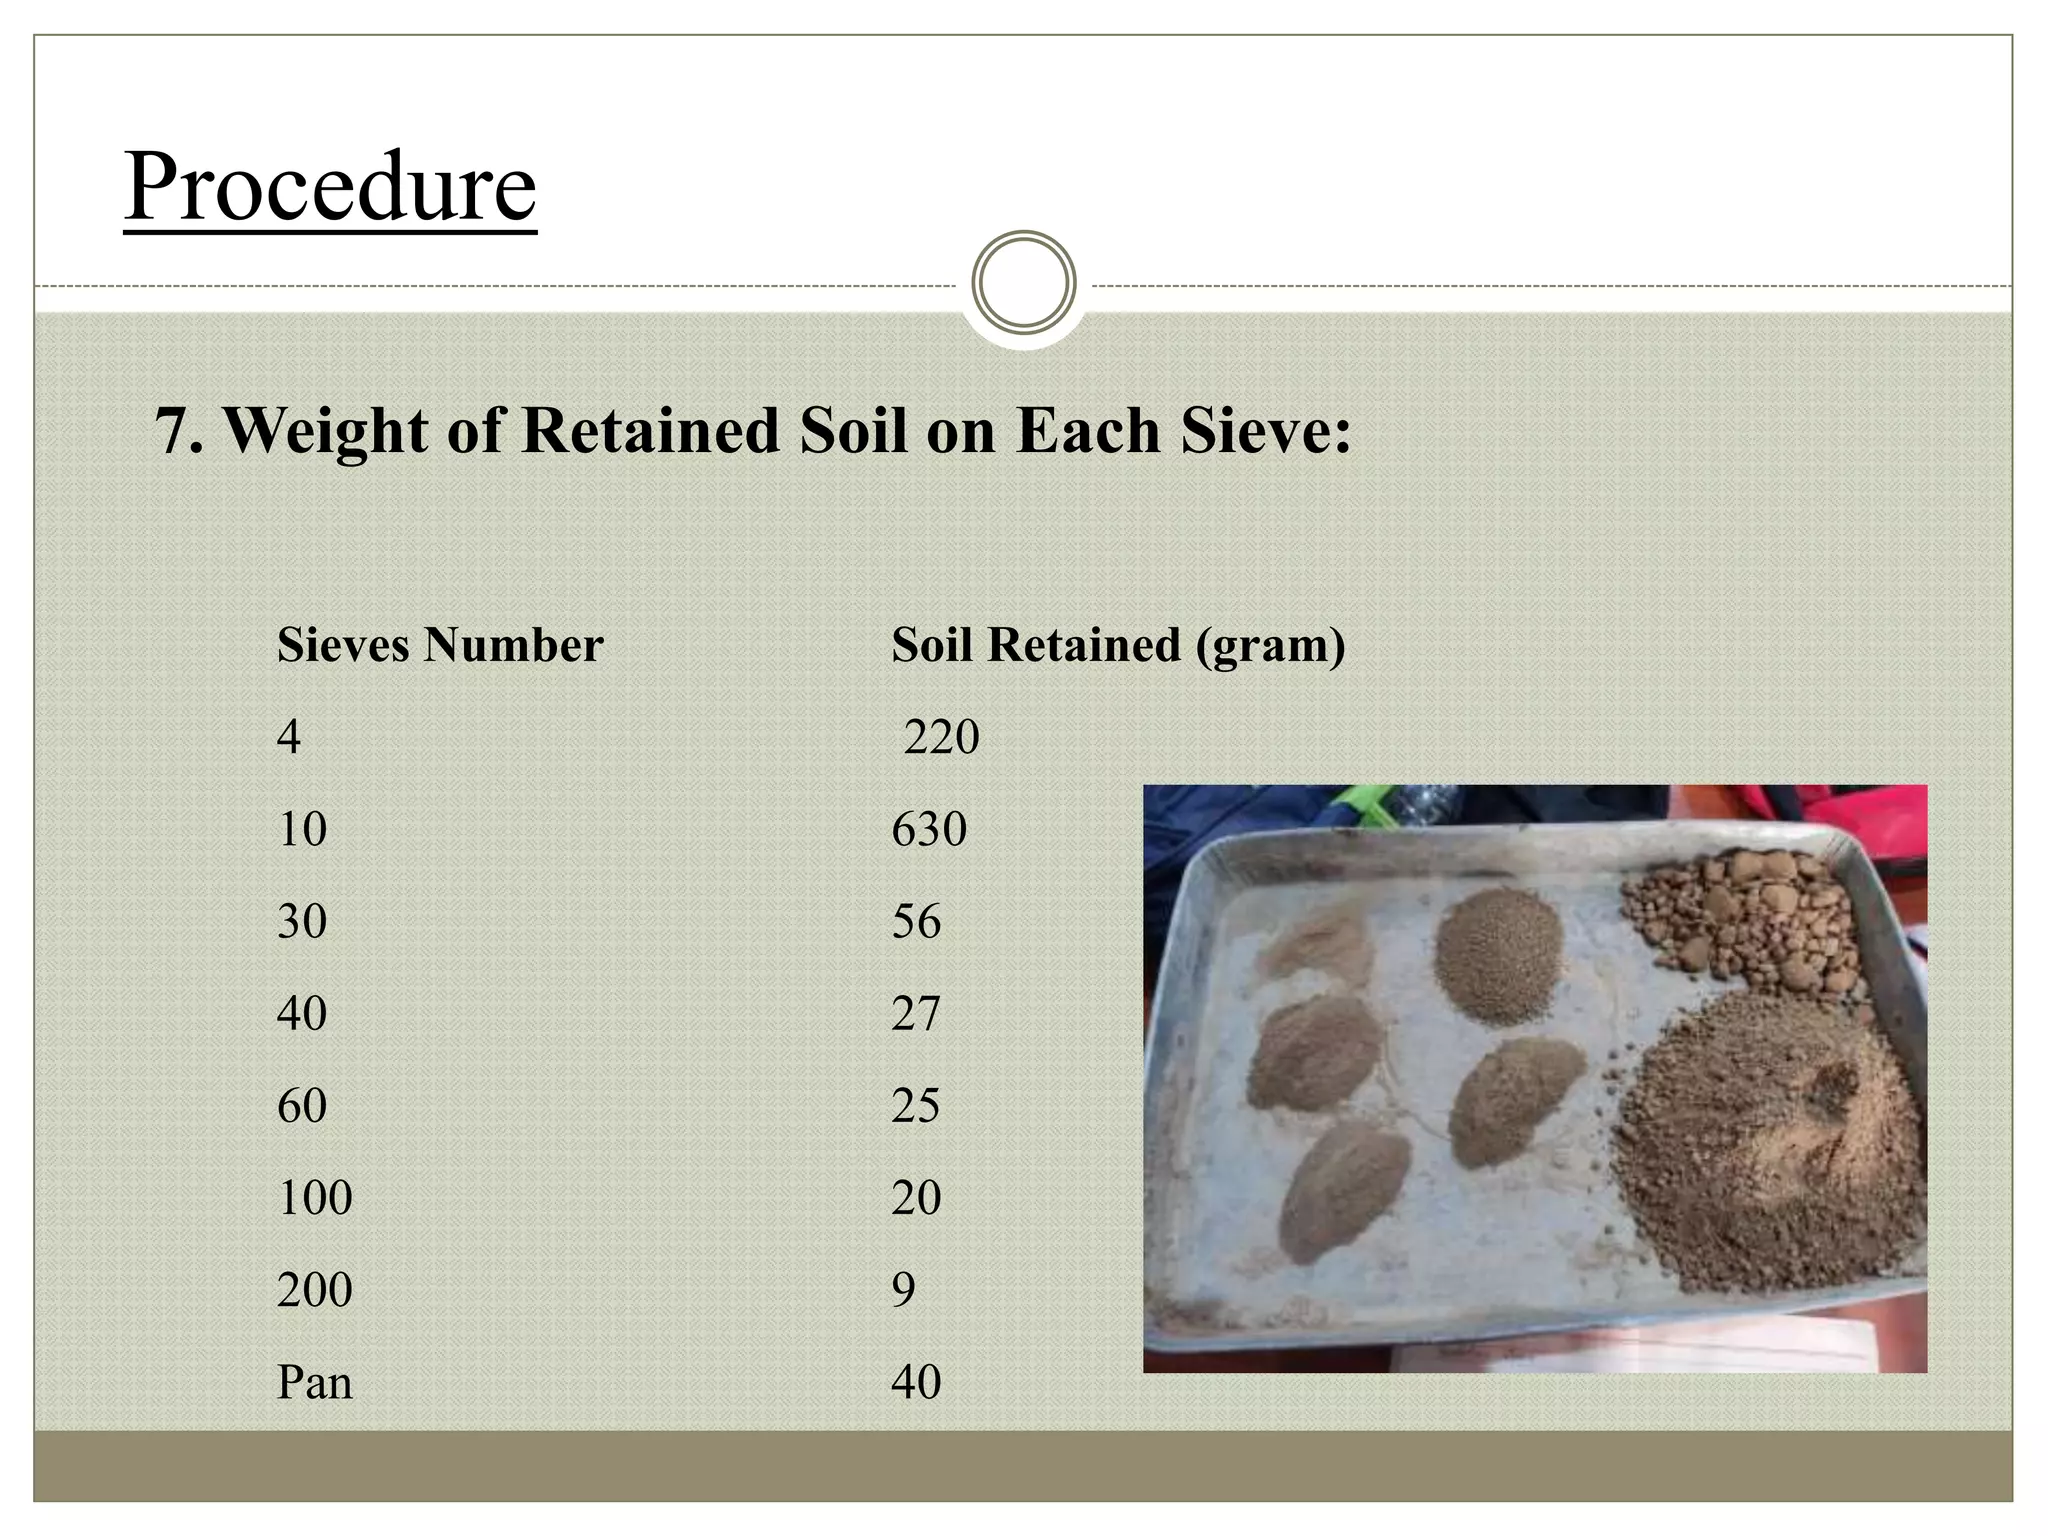
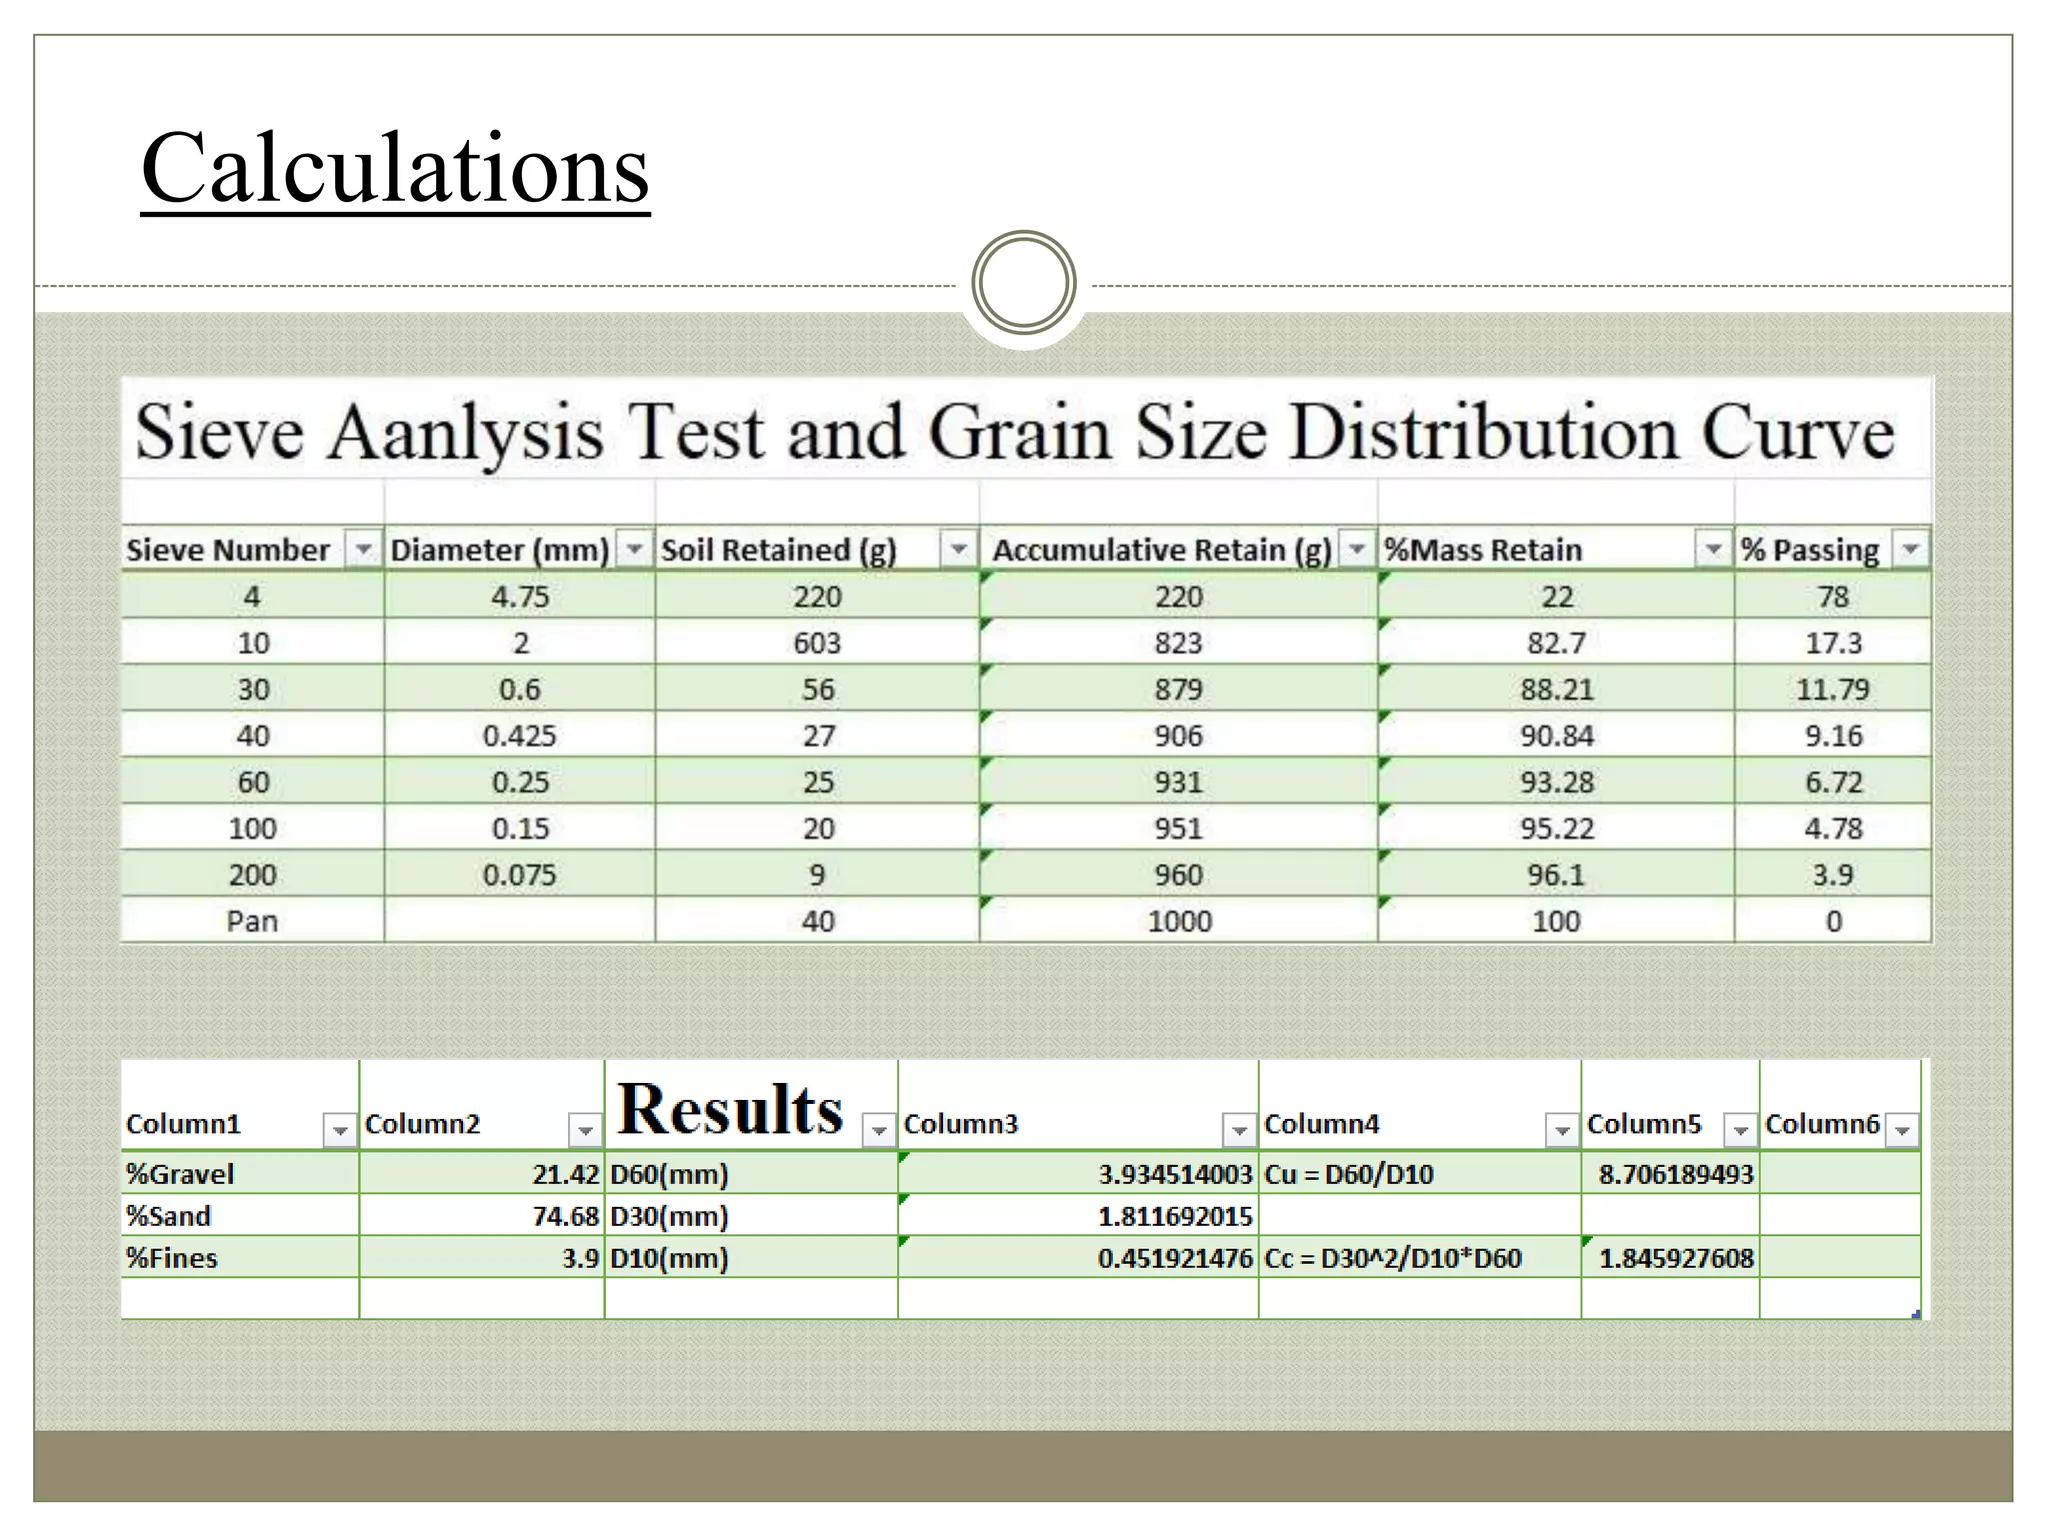
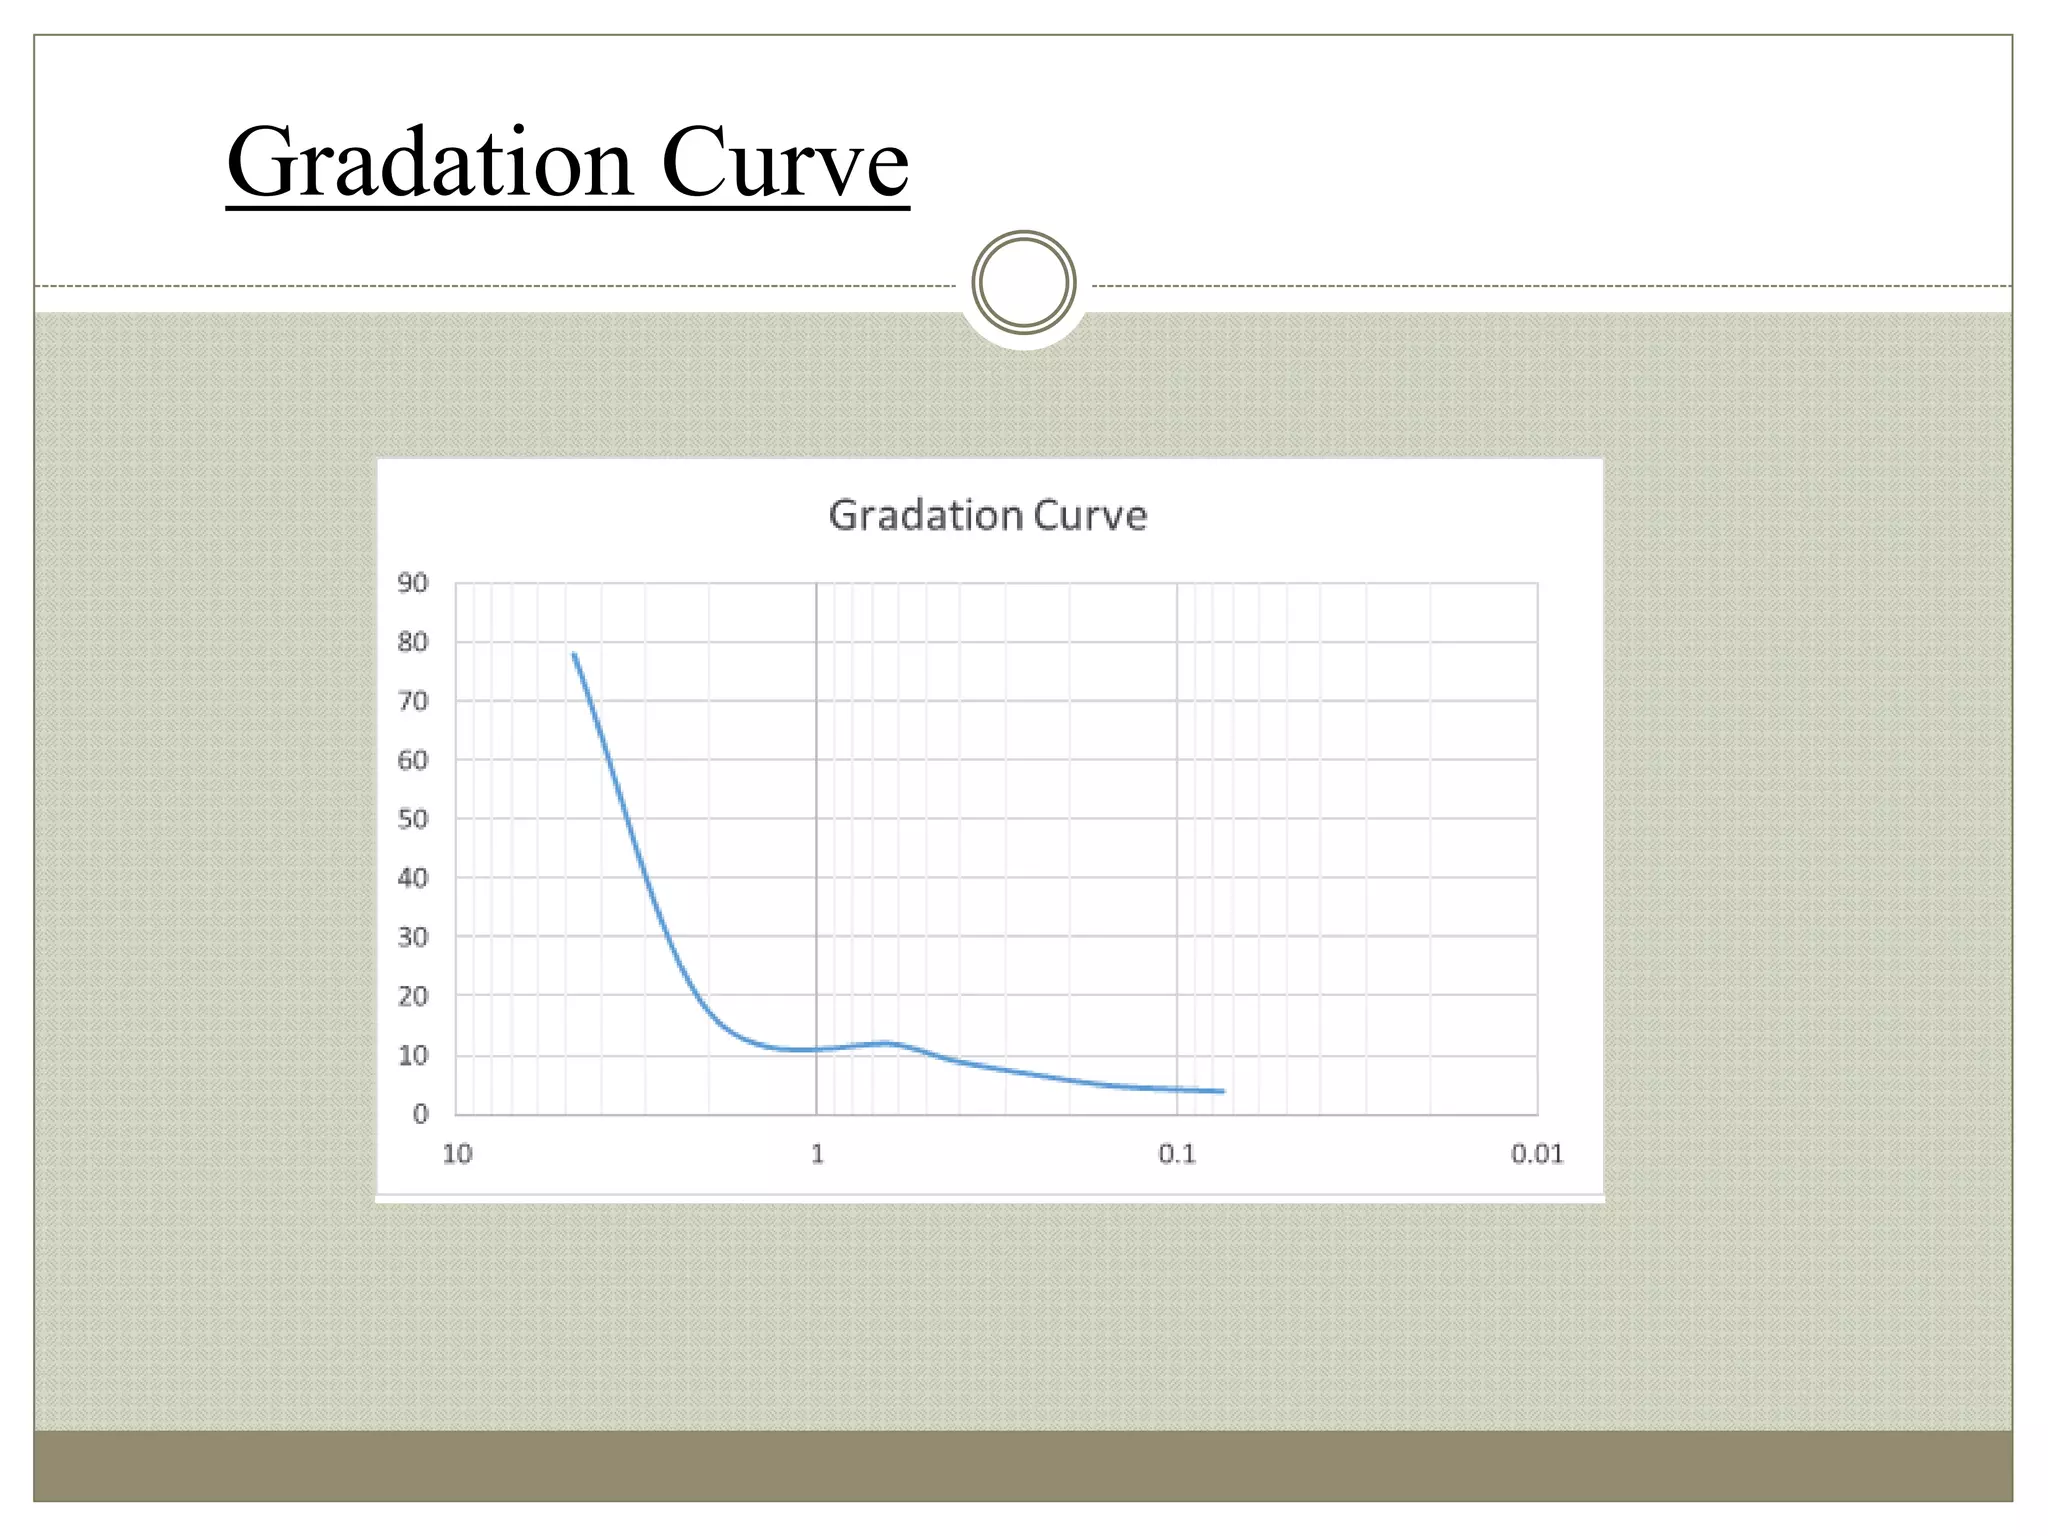
Presentation
Presented to:
Engr. Yousaf Mushtaq Shb
Presented by:
Group 4
FA20-CVE-025 FA20-CVE-039
FA20-CVE-040 FA20-CVE-041
FA20-CVE-042 FA20-CVE-043
FA20-CVE-044 FA20-CVE-045
FA20-CVE-046 FA20-CVE-047
FA20-CVE-048
Soil Mechanics
Grain Size Distribution Curve Attained by Sieve Analysis
Topic: Sieve Analysis
Outlines:
1. Introduction
2. Objective
3. Significance
4. Related Theory
5. Standards for Sieve Analysis
6. Procedure
7. Calculations
8. Gradation Curve
9. Nature Of Soil
Introduction
 A sieve analysis or gradation test is used to assess the particle
size distribution (also called gradation) of a granular material by
allowing the material to pass through a series of sieves
 Some amount of mass is retained on each Sieve
Objectives
 This test is performed to determine the percentage of
different grain sizes contained within a soil.
 The sieve analysis is performed to determine the
distribution of the coarser, larger-sized particles
Significance
 The distribution of different grain sizes affects the
engineering properties of soil.
 Grain size analysis provides the grain size distribution,
and it is required in classifying the soil.
Related Theory
Nest of Sieves:
 The stack sieves are called a nest of sieves
 With largest on top and finest at the bottom
Number of Sieves:
The number or sizes of sieves used in the nest
depends on the type of soil and the distribution of the
particles sizes. (Generally sieve no: 4, 10, 40, 100,
200 are used for classifying the soil.
Related Theory
Particle Size Distribution Curve:
 Information obtained from the grain size analysis is
presented in the form of a curve, on a semi
logarithmic plot.
 Percentage finer is plotted on Ordinate using an
arithmetic scale.
 while the size of soil particles, in millimeters, is
plotted on the abscissa which uses a logarithmic
scale.
Related Theory
D10, D30, D60:
D10 = Grain diameter at 10 % passing (also called effective
size).
D30 = Grain diameter at 30 % passing
D60 = Grain diameter at 60 % passing.
Related Theory
Coefficient of Uniformity Cu:
 Cu = D60 / D10
Coefficient of Curvature Cc:
 Cc = (D30)² / (D10) (D60)
 Standards are set up by USCS(Unified Soil Classification System
)& AASHTO (American Association of State Highway and
Transportation Officials), MIT(Massachusetts Institute of
Technology) and USDA ( U.S Department of Agriculture)
Standards for Sieve Analysis
OBJECTIVE:
To obtain the grain size distribution curve for a
given soil sample.
EQUIPMENT:
 Stack of sieves with a cover,
 Mortar and pestle or a mechanical soil pulverized
 Balance, sensitive to 0.1 g
 Mechanical sieve shaker
 Brush
1.Soil Sample:
In this Experiment We collect Soil Sample from 4
different Site of Comsat University .
I. MS Block Ground
II. Love Garden
III.Admin Ground
IV.A Block Front
Procedure
1.Soil Sampling:
1. MS Block Ground
2. Love Garden
3. Admin. Ground
4. A Block Front
Procedure
2. Pulverization of Soil Sample:
The reduction of metal to fine powder by
mechanical means.
Procedure
3. Soil Sample Weight:
Determine the mass of
sample accurately – Weight
(g)
Procedure
4. Sieves:
In this experiment we use 7 different sieves , The
details of Sieves is Following
Sieves Number Sieves Diameter (mm)
4 4.75
10 2
30 0.6
40 0.425
60 0.25
100 0.15
200 0.075
Procedure
5. Shaking Of Soil Sample:
Sieve shakers are used for separation
and size determination of particles. A
typical sieve shaker separates
particles by passing them through a
series of chambers with mesh filters
and agitating the sample in order to
obtain complete separation.
Procedure
Procedure
6. Weight of Retained Soil on Each Sieve:
Sieve shakers are used for separation and size
determination of particles. A typical sieve shaker
separates particles by passing them through a series of
chambers with mesh filters and agitating the sample in
order to obtain complete separation.
7. Weight of Retained Soil on Each Sieve:
Sieves Number Soil Retained (gram)
4 220
10 630
30 56
40 27
60 25
100 20
200 9
Pan 40
Procedure
Calculations
Gradation Curve
Nature of Soil
Our Soil Sample is Well Graded Sandy Loam Soil .
Sandy loam is a type of soil used for gardening. This soil type is
normally made up of sand along with varying amounts of silt
and clay.
Sandy loam soils are broken down into four categories, including
coarse sandy loam, fine sandy loam, sandy loam and very fine
sandy loam. The size of the sand particles is measured in
millimeters and their concentration in the soil is used to determine
which category a soil falls under. Sandy loam soils are made of
approximately 60 percent sand, 10 percent clay and 30 percent silt
particles.
Sieve analysis class task presentation By Engr. Syed Abdullah

Sieve analysis class task presentation By Engr. Syed Abdullah

  • 2.
    Presentation Presented to: Engr. YousafMushtaq Shb Presented by: Group 4 FA20-CVE-025 FA20-CVE-039 FA20-CVE-040 FA20-CVE-041 FA20-CVE-042 FA20-CVE-043 FA20-CVE-044 FA20-CVE-045 FA20-CVE-046 FA20-CVE-047 FA20-CVE-048 Soil Mechanics Grain Size Distribution Curve Attained by Sieve Analysis
  • 3.
    Topic: Sieve Analysis Outlines: 1.Introduction 2. Objective 3. Significance 4. Related Theory 5. Standards for Sieve Analysis 6. Procedure 7. Calculations 8. Gradation Curve 9. Nature Of Soil
  • 4.
    Introduction  A sieveanalysis or gradation test is used to assess the particle size distribution (also called gradation) of a granular material by allowing the material to pass through a series of sieves  Some amount of mass is retained on each Sieve
  • 5.
    Objectives  This testis performed to determine the percentage of different grain sizes contained within a soil.  The sieve analysis is performed to determine the distribution of the coarser, larger-sized particles
  • 6.
    Significance  The distributionof different grain sizes affects the engineering properties of soil.  Grain size analysis provides the grain size distribution, and it is required in classifying the soil.
  • 7.
    Related Theory Nest ofSieves:  The stack sieves are called a nest of sieves  With largest on top and finest at the bottom Number of Sieves: The number or sizes of sieves used in the nest depends on the type of soil and the distribution of the particles sizes. (Generally sieve no: 4, 10, 40, 100, 200 are used for classifying the soil.
  • 8.
    Related Theory Particle SizeDistribution Curve:  Information obtained from the grain size analysis is presented in the form of a curve, on a semi logarithmic plot.  Percentage finer is plotted on Ordinate using an arithmetic scale.  while the size of soil particles, in millimeters, is plotted on the abscissa which uses a logarithmic scale.
  • 9.
    Related Theory D10, D30,D60: D10 = Grain diameter at 10 % passing (also called effective size). D30 = Grain diameter at 30 % passing D60 = Grain diameter at 60 % passing.
  • 10.
    Related Theory Coefficient ofUniformity Cu:  Cu = D60 / D10 Coefficient of Curvature Cc:  Cc = (D30)² / (D10) (D60)
  • 11.
     Standards areset up by USCS(Unified Soil Classification System )& AASHTO (American Association of State Highway and Transportation Officials), MIT(Massachusetts Institute of Technology) and USDA ( U.S Department of Agriculture) Standards for Sieve Analysis
  • 12.
    OBJECTIVE: To obtain thegrain size distribution curve for a given soil sample. EQUIPMENT:  Stack of sieves with a cover,  Mortar and pestle or a mechanical soil pulverized  Balance, sensitive to 0.1 g  Mechanical sieve shaker  Brush
  • 13.
    1.Soil Sample: In thisExperiment We collect Soil Sample from 4 different Site of Comsat University . I. MS Block Ground II. Love Garden III.Admin Ground IV.A Block Front Procedure
  • 14.
    1.Soil Sampling: 1. MSBlock Ground 2. Love Garden 3. Admin. Ground 4. A Block Front Procedure
  • 15.
    2. Pulverization ofSoil Sample: The reduction of metal to fine powder by mechanical means. Procedure
  • 16.
    3. Soil SampleWeight: Determine the mass of sample accurately – Weight (g) Procedure
  • 17.
    4. Sieves: In thisexperiment we use 7 different sieves , The details of Sieves is Following Sieves Number Sieves Diameter (mm) 4 4.75 10 2 30 0.6 40 0.425 60 0.25 100 0.15 200 0.075 Procedure
  • 18.
    5. Shaking OfSoil Sample: Sieve shakers are used for separation and size determination of particles. A typical sieve shaker separates particles by passing them through a series of chambers with mesh filters and agitating the sample in order to obtain complete separation. Procedure
  • 19.
    Procedure 6. Weight ofRetained Soil on Each Sieve: Sieve shakers are used for separation and size determination of particles. A typical sieve shaker separates particles by passing them through a series of chambers with mesh filters and agitating the sample in order to obtain complete separation.
  • 20.
    7. Weight ofRetained Soil on Each Sieve: Sieves Number Soil Retained (gram) 4 220 10 630 30 56 40 27 60 25 100 20 200 9 Pan 40 Procedure
  • 21.
  • 22.
  • 23.
    Nature of Soil OurSoil Sample is Well Graded Sandy Loam Soil . Sandy loam is a type of soil used for gardening. This soil type is normally made up of sand along with varying amounts of silt and clay. Sandy loam soils are broken down into four categories, including coarse sandy loam, fine sandy loam, sandy loam and very fine sandy loam. The size of the sand particles is measured in millimeters and their concentration in the soil is used to determine which category a soil falls under. Sandy loam soils are made of approximately 60 percent sand, 10 percent clay and 30 percent silt particles.

Editor's Notes

  • #23 What is the use of gradation curve? A sieve analysis (or gradation test) is a practice or procedure used in civil engineering and to assess the particle size distribution (also called gradation) of a granular material by allowing them to pass through series of Sieve , later the result of this test is shown in the form of a graph which is called Gradation curve .