Downloaded 191 times

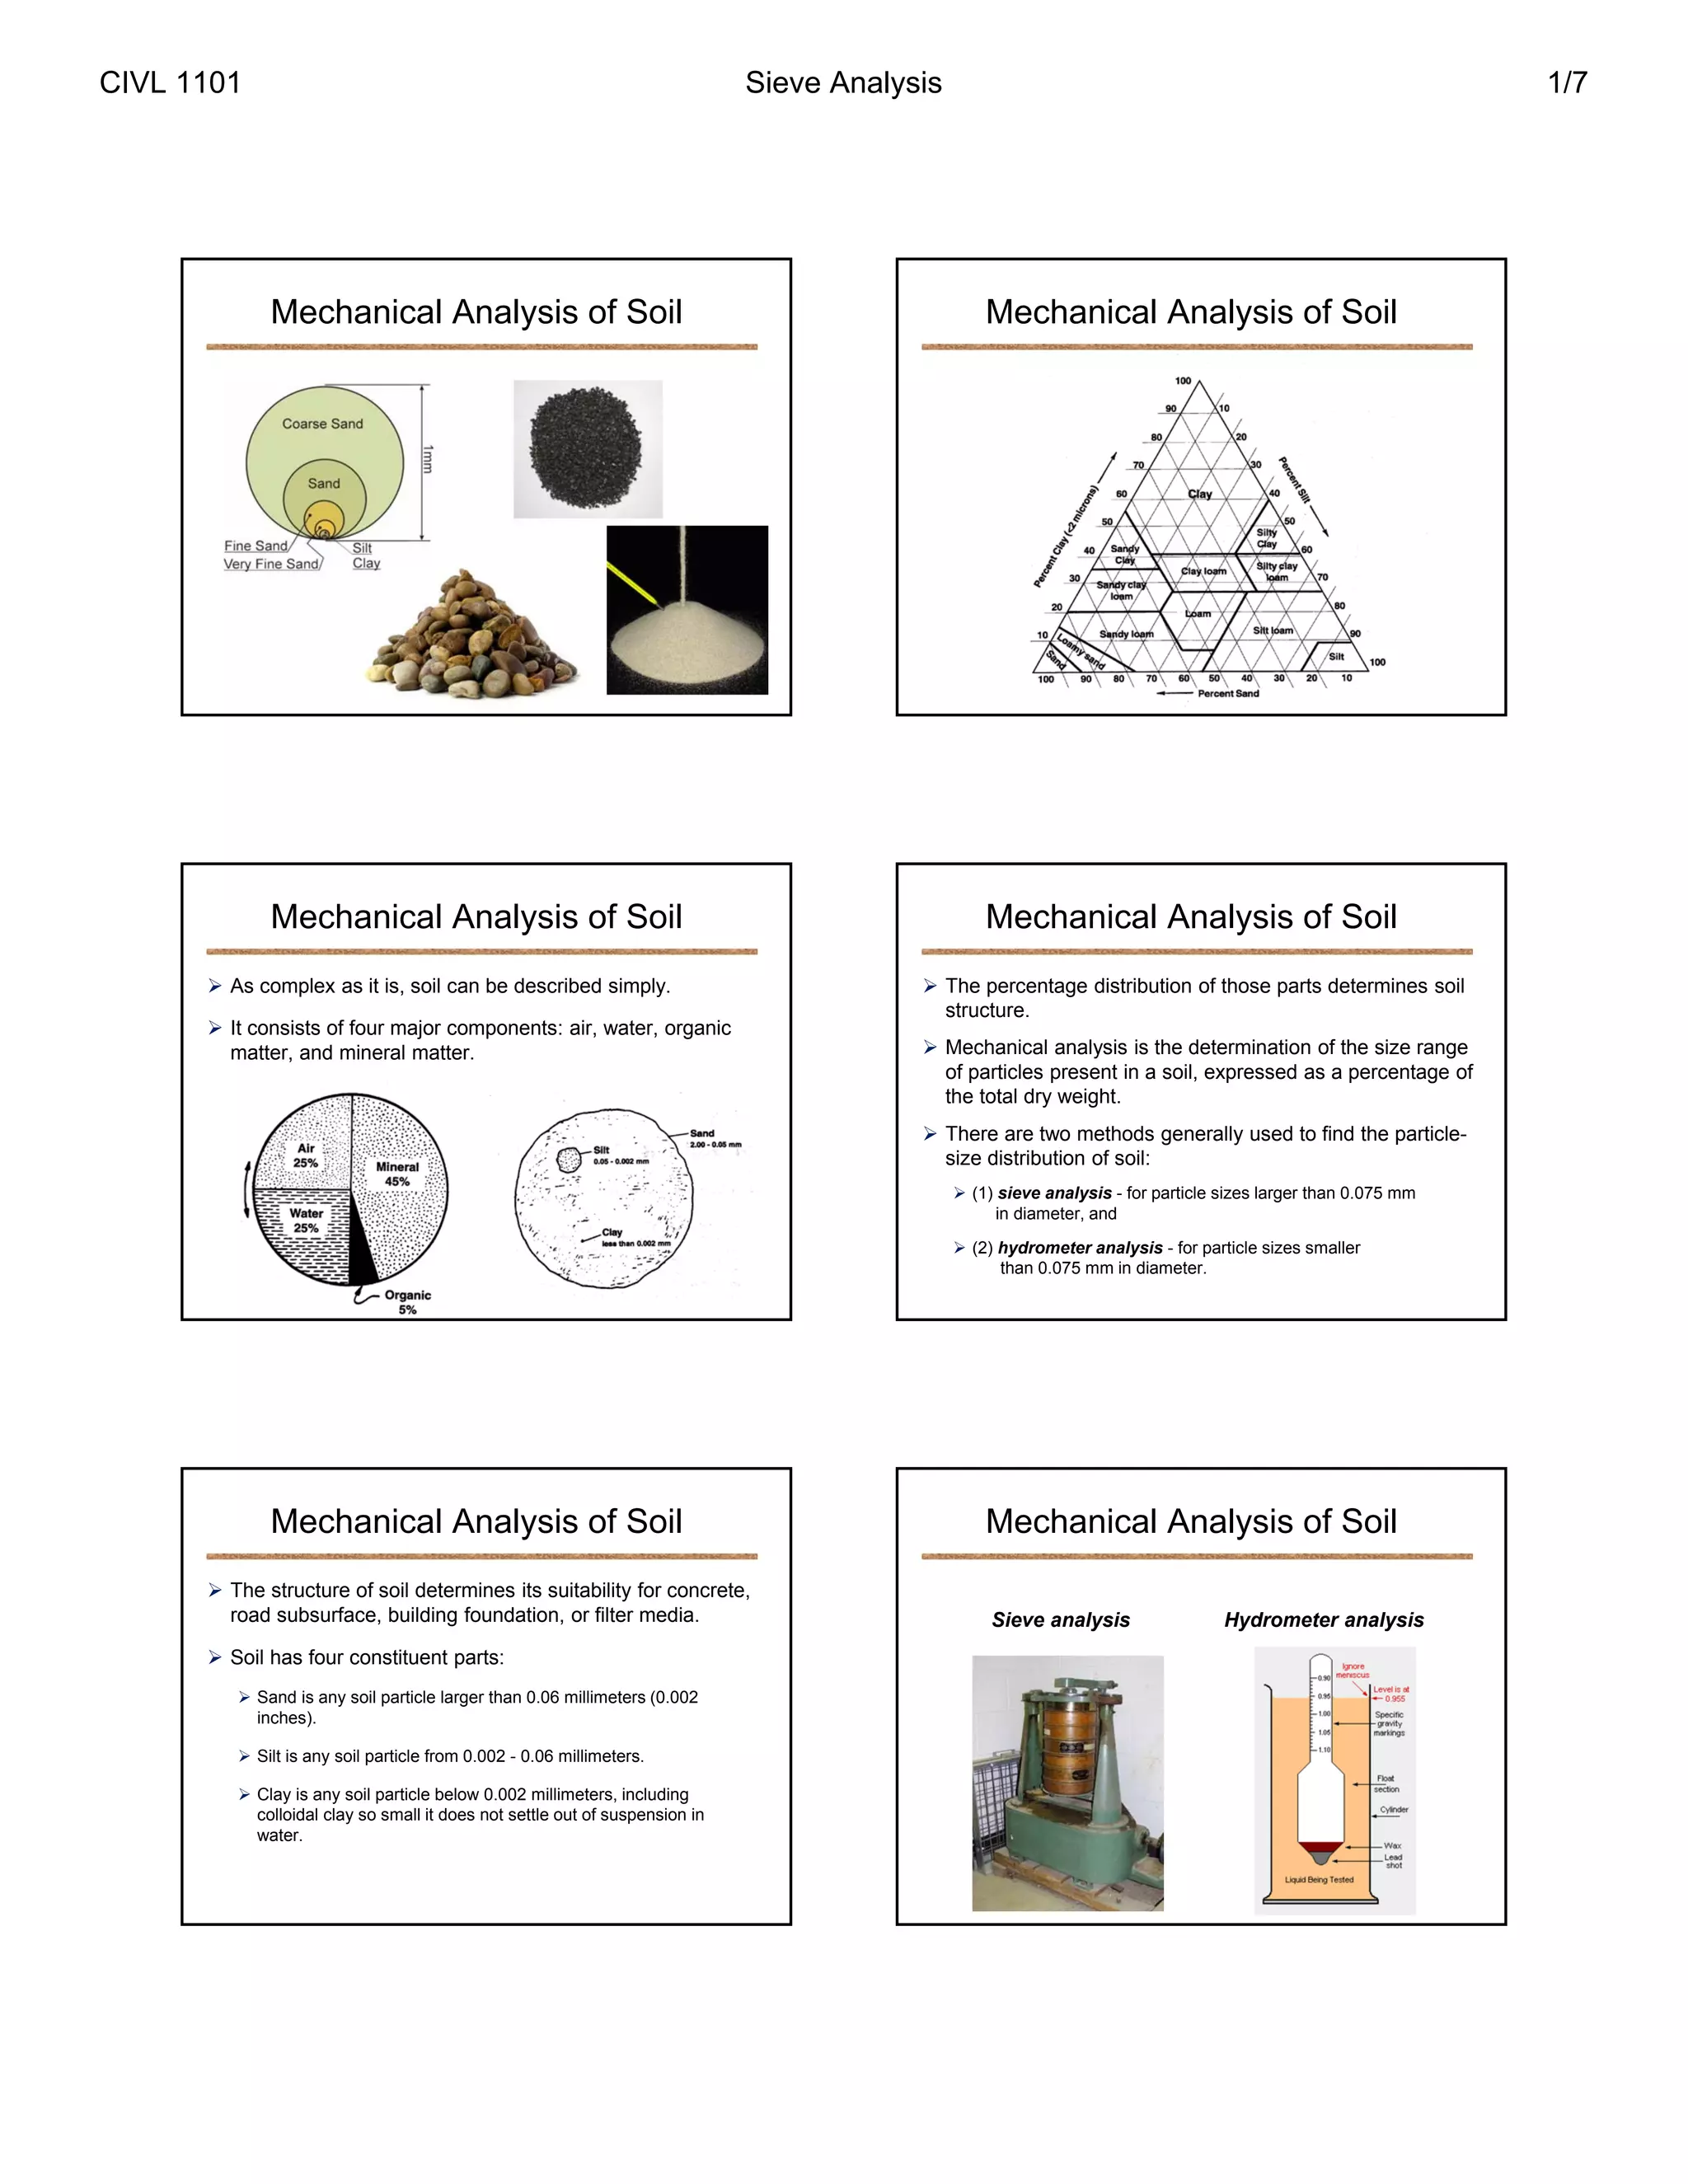
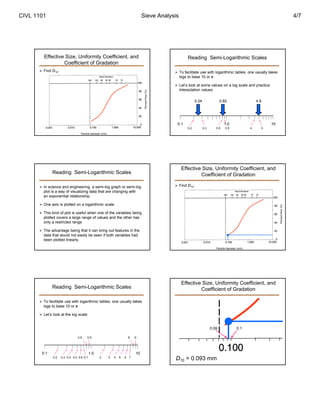
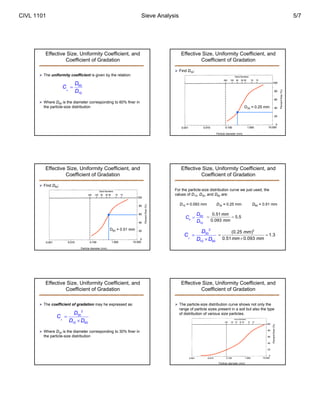
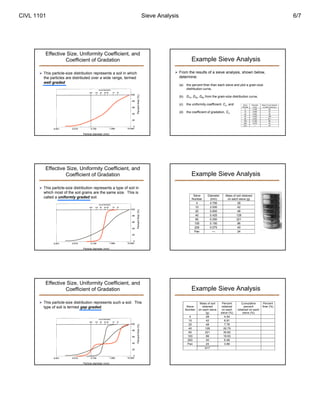
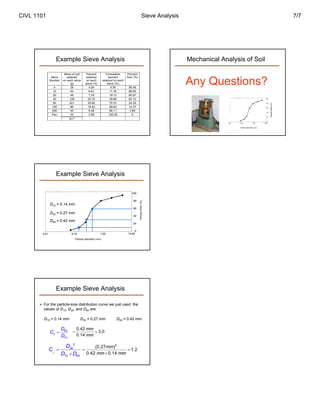

This document provides information on mechanical analysis of soil, which involves determining the particle size distribution of soil through sieve analysis and hydrometer analysis. Sieve analysis involves shaking a soil sample through a nested set of sieves with progressively smaller openings to separate particles. Hydrometer analysis is used to determine the portion of soils smaller than 0.075mm. The document defines various soil particle sizes and provides an example of calculating particle size distribution, effective size, uniformity coefficient, and coefficient of gradation from sieve analysis results.


![Geotechnical Engineering-I [Lec #8: Hydrometer Analysis]](https://cdn.slidesharecdn.com/ss_thumbnails/8-180923180849-thumbnail.jpg?width=640&height=640&fit=bounds)


![Geotechnical Engineering-I [Lec #7: Sieve Analysis-2]](https://cdn.slidesharecdn.com/ss_thumbnails/7-180923180808-thumbnail.jpg?width=640&height=640&fit=bounds)


