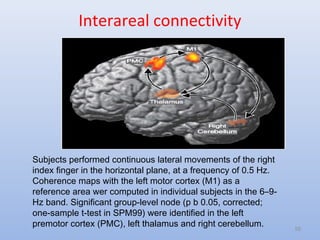
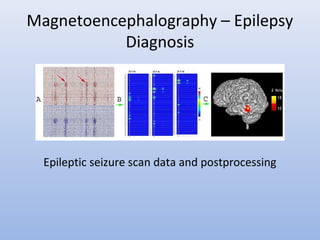
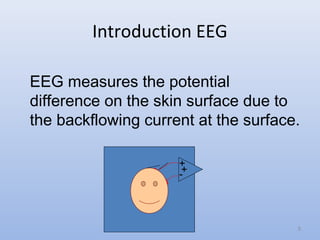
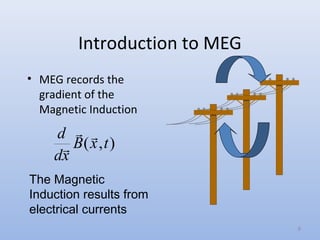
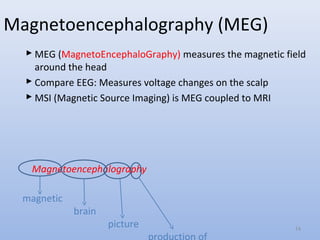
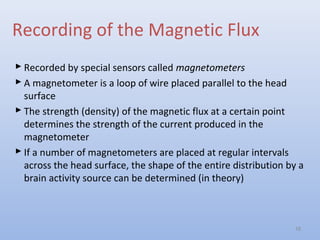
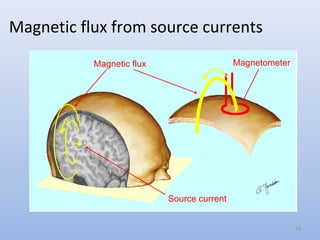
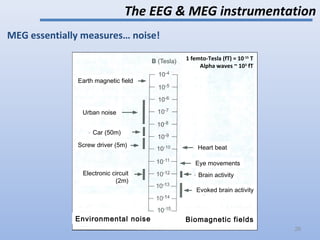
MEG measures magnetic fields produced by electrical activity in the brain. It provides high spatial resolution to localize brain regions activated during specific cognitive tasks and can help localize epileptic seizures. While MEG was first developed in the 1970s, advances over decades now allow it to map brain rhythms, language processing, connectivity between regions, and development from prenatal periods to learning. Key applications include epilepsy evaluation, mapping functional areas near brain tumors to guide surgery, and monitoring stroke recovery and chronic pain.
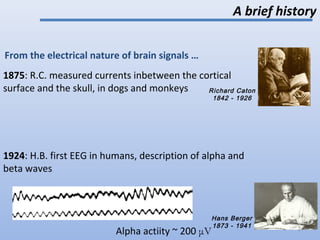
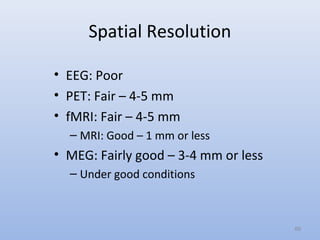
![A brief history
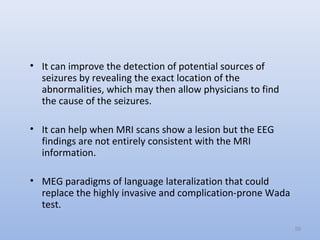
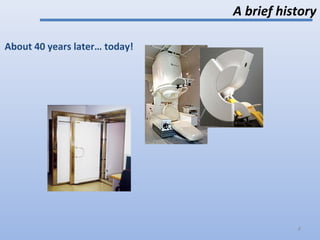
About 50 years later …
David
Cohen
1968: first (noisy) measure of a magnetic brain signal [Cohen, Science 68]
1970: James Zimmerman invents the
‘Superconducting quantum interference device’ (SQUID)
1972: first (1 sensor) MEG recording based on SQUID
Brian-
David
Josephson
3](https://image.slidesharecdn.com/megfinal-151023070424-lva1-app6891/85/Meg-final-3-320.jpg)
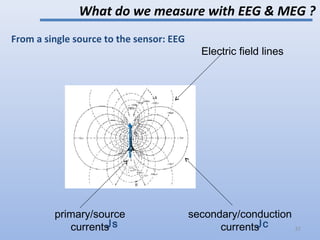
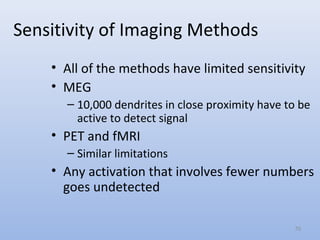
![From a single source to the sensor: EEG
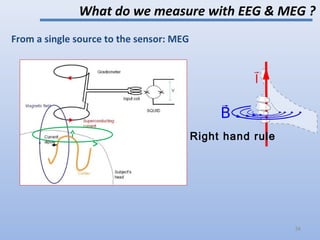
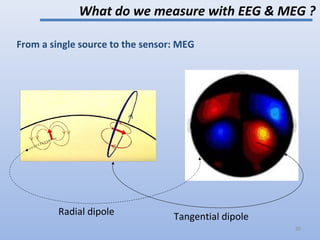
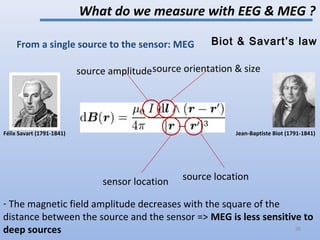
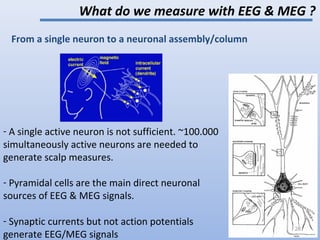
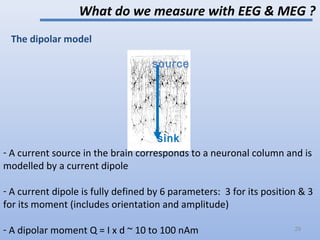
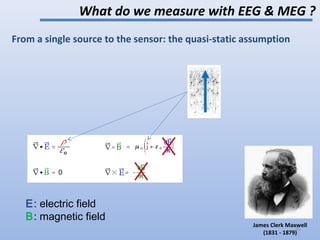
What do we measure with EEG & MEG ?
Georg Simon
Ohm
1789 - 1841
Ohm’s law
Jc = σ E = - σ grad(V) σ : tissue conductivities
Conservation law
∇.Js + ∇. Jc = 0 => ∇. Js = ∇.[σ grad(V)]
33](https://image.slidesharecdn.com/megfinal-151023070424-lva1-app6891/85/Meg-final-33-320.jpg)