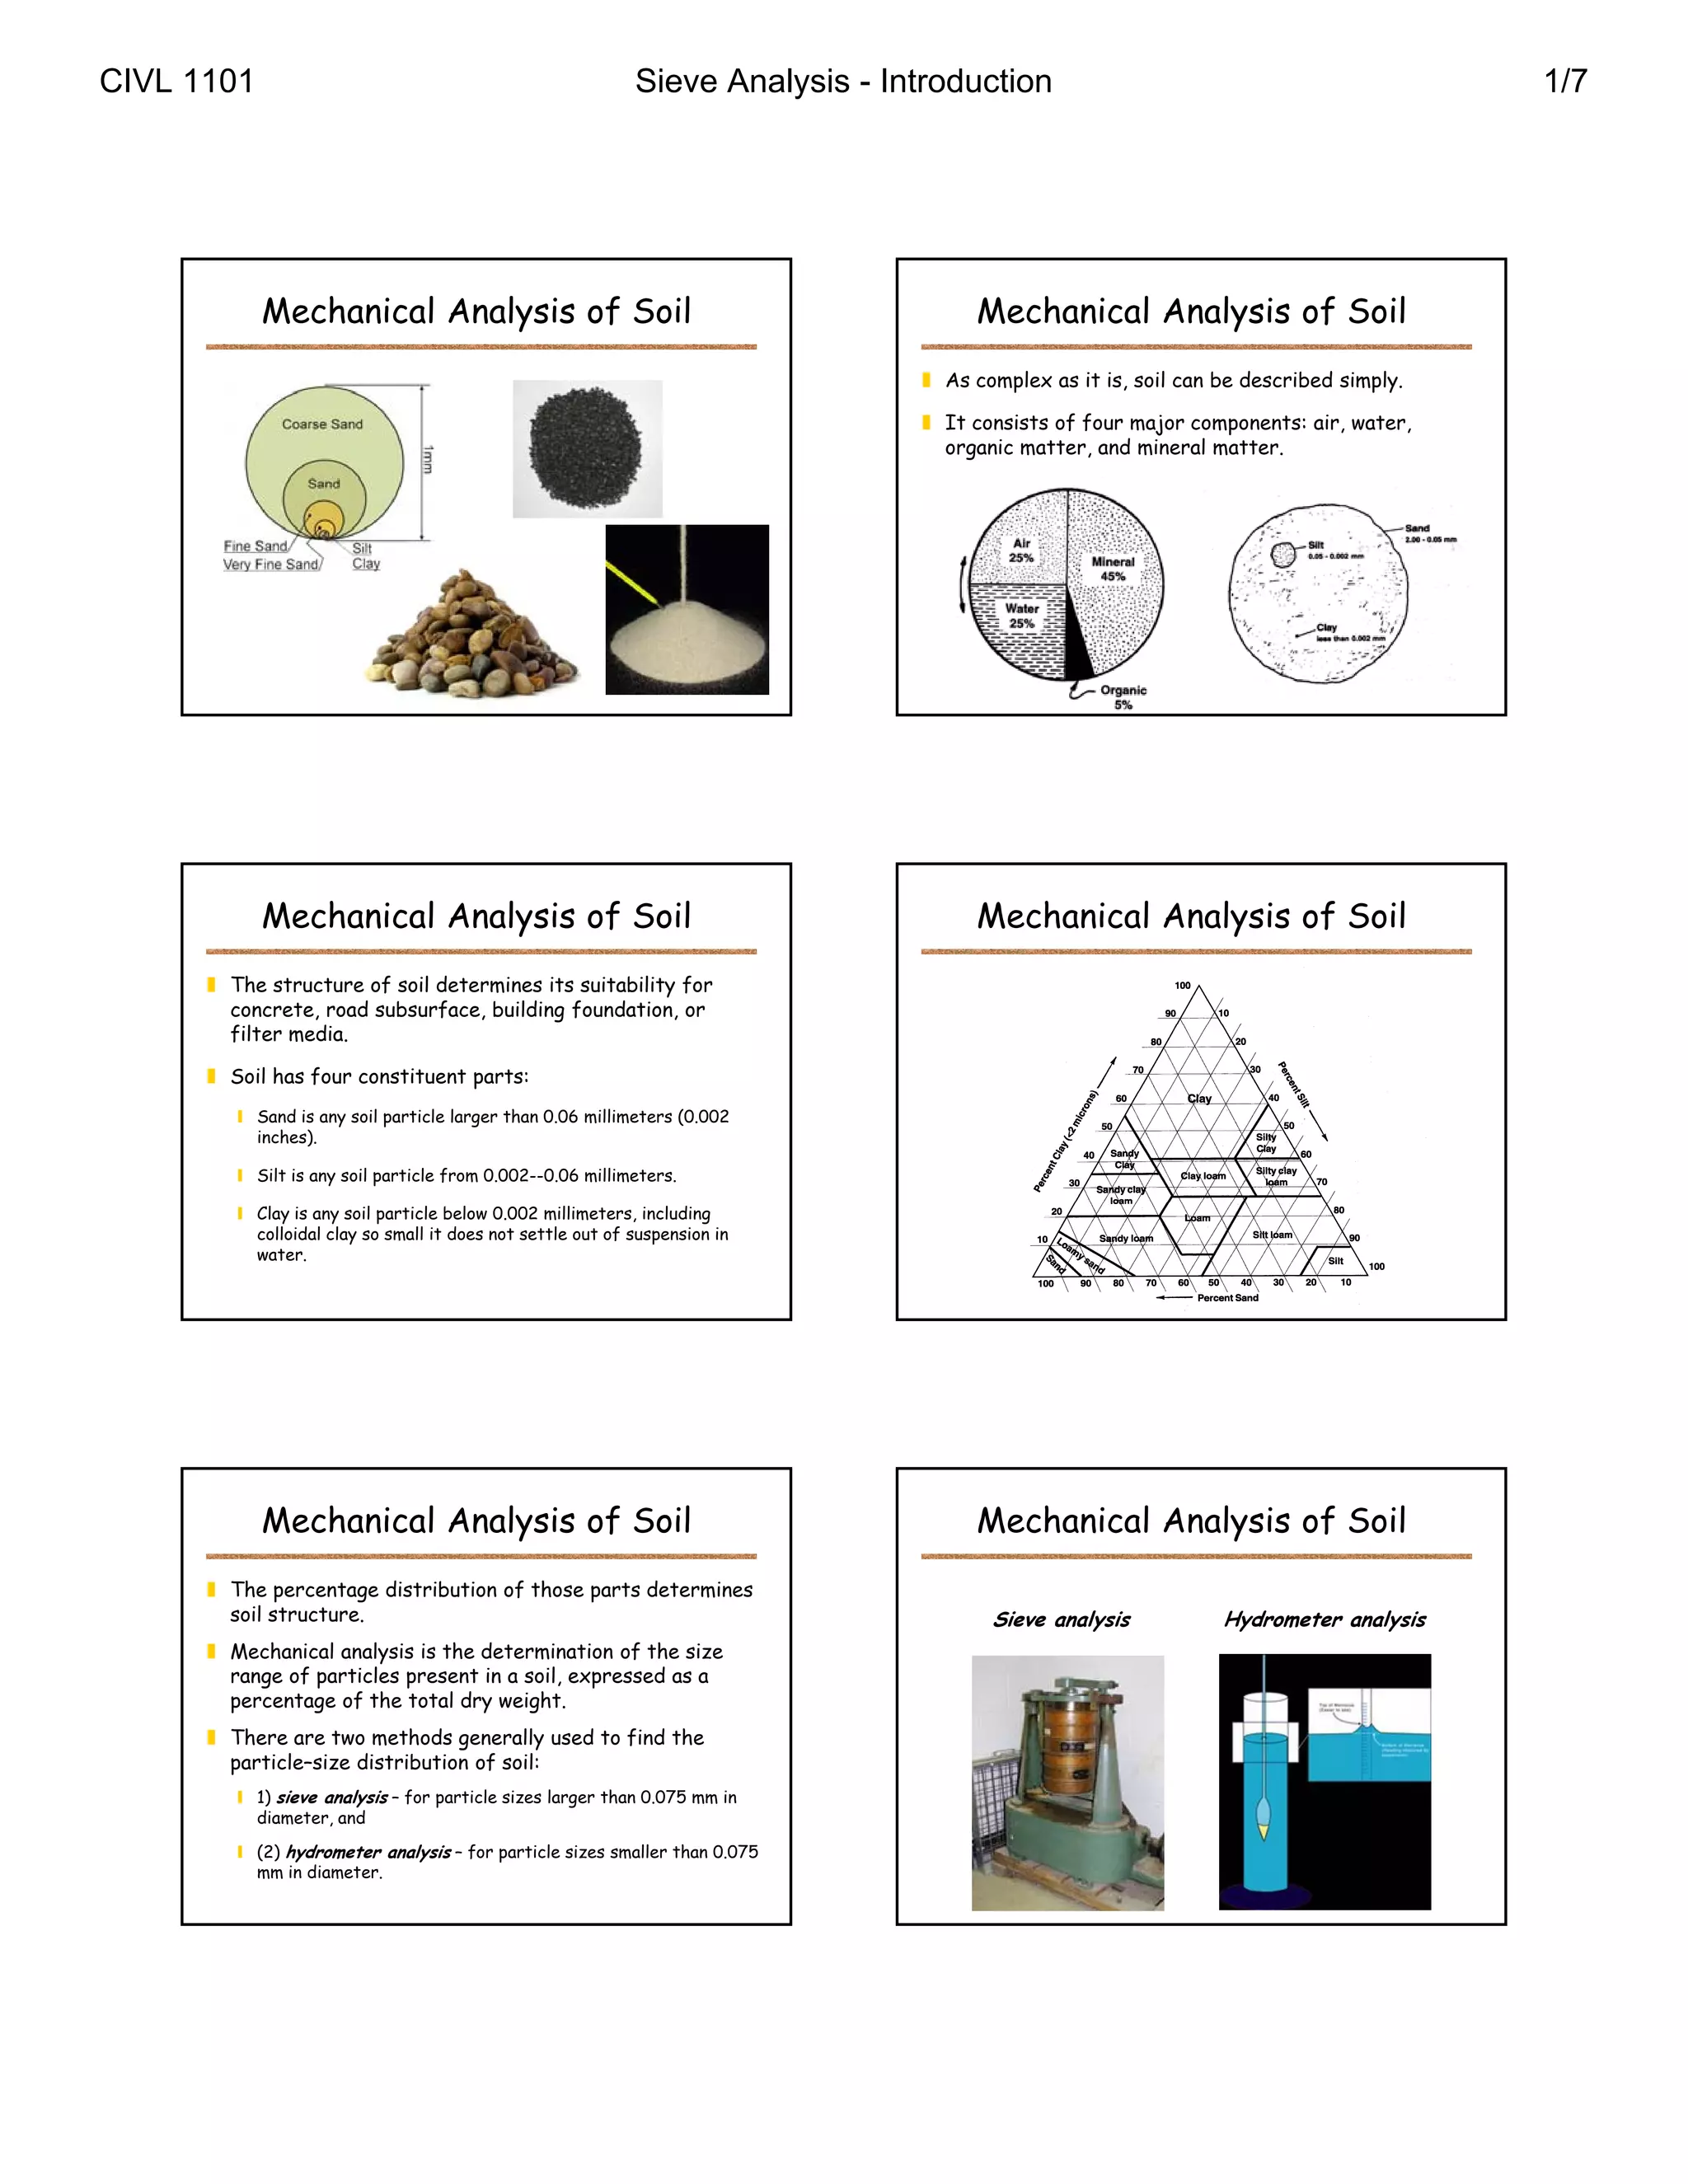
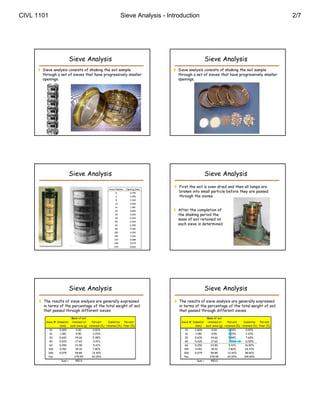
1. The document discusses sieve analysis, which is a method used to determine the particle size distribution of soils. It involves shaking a soil sample through a nested set of sieves with progressively smaller openings to separate particles by size.
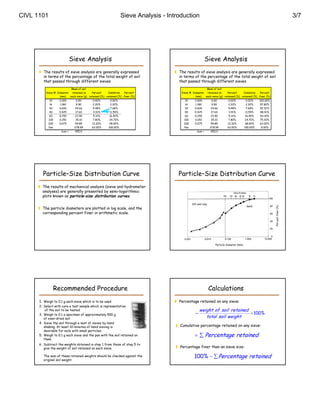
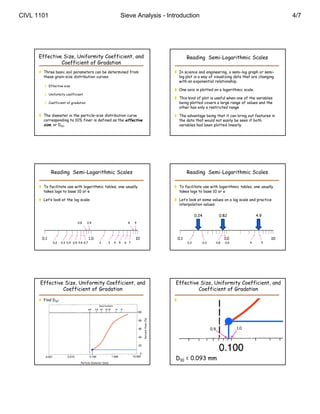
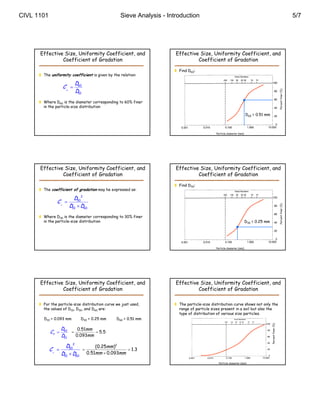
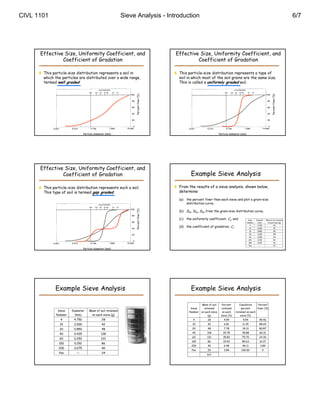
2. The results are expressed as the percentage of the total soil weight retained on each sieve. From these results, parameters like effective size (D10), uniformity coefficient, and coefficient of gradation can be determined from the particle size distribution curve.
3. These parameters provide information about the range of particle sizes present in the soil and how evenly the particles are distributed. Well graded soils have a wide range of particle sizes while gap and uniformly graded soils have gaps or a uniform size distribution.

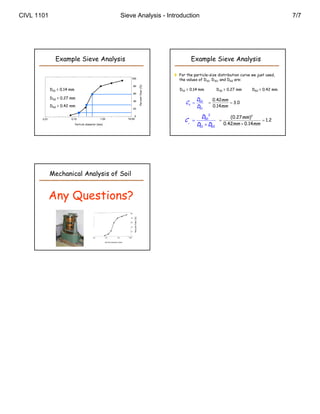


![Geotechnical Engineering-I [Lec #2: Introduction-2]](https://cdn.slidesharecdn.com/ss_thumbnails/2-180923175525-thumbnail.jpg?width=640&height=640&fit=bounds)


![Geotechnical Engineering-I [Lec #7: Sieve Analysis-2]](https://cdn.slidesharecdn.com/ss_thumbnails/7-180923180808-thumbnail.jpg?width=640&height=640&fit=bounds)


