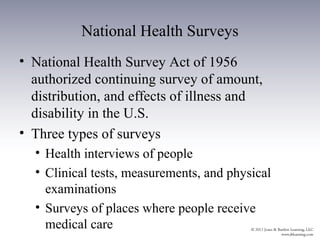
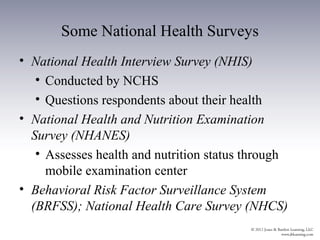
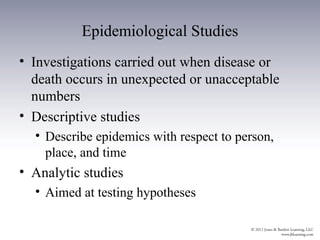
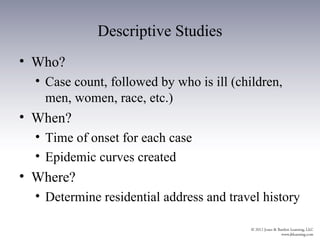
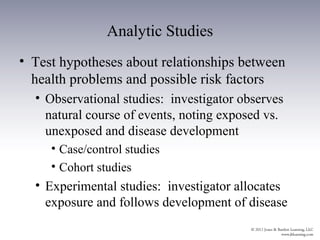
Epidemiology: The
   Study of Disease,
Injury, and Death in the
      Community

      Chapter 3
Introduction
• Epidemiology = population medicine
• Epidemiologists concerned with course of
  disease in a population
• Collect information about disease status of a
  community
  • How many people are sick? Who is sick?
    When did they become sick? Where do they
    live?
• Data can be used to prevent disease outbreaks
  or determine effectiveness of prevention effort
Definitions
• Epidemiology: study of distribution and
  determinants of health-related states or events in
  specified populations
• Epidemic: unexpectedly large number of cases of
  an illness, specific health-related behavior or
  event, in a particular population
• Endemic: disease that occurs regularly in a
  population as a matter of course
• Pandemic: outbreak over wide geographic area
The Importance of Rates
• Rates allow for comparison of outbreaks at
  different times or in different places
• Cases: people afflicted (those who are sick)
• Rates: number of events in a given population
  over a given period of time or given point in time
   • Natality (birth), morbidity (sickness), mortality or
     fatality (death) rates
• Population at Risk: those susceptible to particular
  disease or condition
Morbidity Rates
• Incidence rate: number of new health-related
  events or cases of a disease in a population
  exposed to that risk during a particular period of
  time, divided by total # in same population
• Prevalence rate: number of new and old cases in
  a given period of time, divided by total # in that
  population
• Attack rate: incidence rate calculated for a
  particular population for a single disease
  outbreak; expressed as a percentage
Incidence, Prevalence, and Attack Rates
• Incidence rates important to study of acute
  diseases
  • Acute disease: lasts three months or less
• Prevalence rates useful for study of chronic
  diseases
  • Chronic disease: last longer than three months
• Incidence and prevalence rates expressed as
  crude or specific
Incidence, Prevalence, and Attack Rates
Crude and Age-Adjusted Rates
• Crude rates: denominator includes the total
  population
  • Crude birth rate: # of live births in given year,
    divided by midyear population
  • Crude death rate: # of deaths in given year
    from all causes, divided by midyear population
• Age-adjusted rates: used to make comparisons
  of relative risks across groups and over time
  when groups differ in age structure
Crude Rates
Crude and Age-Adjusted Rates
Specific Rates
• Measure morbidity and mortality for particular
  populations or diseases
• Case fatality rate: percentage of cases of a
  particular disease that result in death
• Proportionate mortality ratio: percentage of
  overall mortality in a population that is
  attributable to a particular cause
Important Rates in Epidemiology
Reporting of Birth, Deaths, and Diseases
• Physicians, clinics, and hospitals required to
  report births, deaths, and notifiable diseases
  • Notifiable diseases: infectious diseases in
    which health officials request or require
    reporting
     • Can become epidemics
     • Health officials maintain weekly records
• Various challenges to maintaining accurate
  data
Notifiable Disease Scheme
Standardized Measurements of Health Status of
                Populations
• Mortality statistics most reliable measure of
  population health status
  • Easier to track death than illness
• Life expectancy: average number of years a
  person from a specific cohort is projected to
  live from a given point in time
• Years of potential life lost (YPLL): number of
  years lost when death occurs before one’s life
  expectancy
Life Expectancy Figures
Years of Potential Life Lost
• Subtract person’s age at death from his or her
  life expectancy
• Difficult to determine because life expectancy
  changes at different ages
• Weighs death of young person as counting
  more than death of old
Sources of Standardized Data
• Various valid sources have specific value and
  usefulness to those in public health
  • U.S. Census
     • Taken every 10 years
     • Enumeration of the population
     • More complex now
        • Gathers data on race, age, income,
          employment, education, and other social
          indicators
Sources of Standardized Data (ctd)
• Statistical Abstract of the United States
   • Book published annually by Bureau of Census
   • Summary of statistics on social, political, and
     economic organization of the United States
• Monthly Vital Statistics Report
   • Vital statistics are summaries of records of
     major life events: birth, death, marriage, divorce
   • Published by National Center for Health
     Statistics under the CDC
   • Also calculates death rates by race and age
Sources of Standardized Data (ctd)
• Morbidity and Mortality Weekly Report
  (MMWR)
  • Prepared by CDC from state health department
    reports
  • Reports morbidity and mortality data by state
    and region of U.S.
  • Reports outbreaks of disease, environmental
    hazards, unusual cases, or other public health
    problems
National Health Surveys
• National Health Survey Act of 1956
  authorized continuing survey of amount,
  distribution, and effects of illness and
  disability in the U.S.
• Three types of surveys
  • Health interviews of people
  • Clinical tests, measurements, and physical
    examinations
  • Surveys of places where people receive
    medical care
Some National Health Surveys
• National Health Interview Survey (NHIS)
   • Conducted by NCHS
   • Questions respondents about their health
• National Health and Nutrition Examination
  Survey (NHANES)
   • Assesses health and nutrition status through
     mobile examination center
• Behavioral Risk Factor Surveillance System
  (BRFSS); National Health Care Survey (NHCS)
Epidemiological Studies
• Investigations carried out when disease or
  death occurs in unexpected or unacceptable
  numbers
• Descriptive studies
  • Describe epidemics with respect to person,
    place, and time
• Analytic studies
  • Aimed at testing hypotheses
Descriptive Studies
• Who?
  • Case count, followed by who is ill (children,
    men, women, race, etc.)
• When?
  • Time of onset for each case
  • Epidemic curves created
• Where?
  • Determine residential address and travel history
Epidemic Curves
• Graphic display of the cases of disease
  according to the time or date of onset of
  symptoms
• Secular, seasonal, and single epidemic curves
• Single epidemic curves
  • Point source epidemic curve
  • Propagated epidemic curve
Secular Epidemic Curve
Seasonal Epidemic Curve
Point Source Epidemic Curve
Propagated Epidemic Curve
Analytic Studies
• Test hypotheses about relationships between
  health problems and possible risk factors
  • Observational studies: investigator observes
    natural course of events, noting exposed vs.
    unexposed and disease development
     • Case/control studies
     • Cohort studies
  • Experimental studies: investigator allocates
    exposure and follows development of disease
Case/Control Studies
• Case/Control
  • Compares those with disease to those without
    but with similar background and/or with prior
    exposure to certain risk factors
     • Aimed at identifying factors more common in
       case than control group
Cohort Studies
• Cohort is classified by exposure to one or
  more risk factors and observed to determine
  rate of disease development
  • Cohort: group of people who share important
    demographic characteristic
• Odds ratio
• Relative risk
Experimental Studies
• Carried out to identify cause of disease or
  determine effectiveness of vaccine, drug, or
  procedure
  • Control for variables
     • Control groups
     • Randomization
     • Blinding
  • Placebo: blank treatment
Criteria of Causation
• Questions exposure causing development of
  disease
• Criteria
  •   Strength
  •   Consistency
  •   Specificity
  •   Temporality
  •   Biological plausibility
Discussion Questions
• How can data collection for notifiable diseases
  be improved?
• Why is tracking vital statistics so important?
• How does calculating Years of Potential Life
  Lost change the way we think about
  community health efforts?

Ch03 outline

  • 1.
    Epidemiology: The Study of Disease, Injury, and Death in the Community Chapter 3
  • 2.
    Introduction • Epidemiology =population medicine • Epidemiologists concerned with course of disease in a population • Collect information about disease status of a community • How many people are sick? Who is sick? When did they become sick? Where do they live? • Data can be used to prevent disease outbreaks or determine effectiveness of prevention effort
  • 3.
    Definitions • Epidemiology: studyof distribution and determinants of health-related states or events in specified populations • Epidemic: unexpectedly large number of cases of an illness, specific health-related behavior or event, in a particular population • Endemic: disease that occurs regularly in a population as a matter of course • Pandemic: outbreak over wide geographic area
  • 4.
    The Importance ofRates • Rates allow for comparison of outbreaks at different times or in different places • Cases: people afflicted (those who are sick) • Rates: number of events in a given population over a given period of time or given point in time • Natality (birth), morbidity (sickness), mortality or fatality (death) rates • Population at Risk: those susceptible to particular disease or condition
  • 5.
    Morbidity Rates • Incidencerate: number of new health-related events or cases of a disease in a population exposed to that risk during a particular period of time, divided by total # in same population • Prevalence rate: number of new and old cases in a given period of time, divided by total # in that population • Attack rate: incidence rate calculated for a particular population for a single disease outbreak; expressed as a percentage
  • 6.
    Incidence, Prevalence, andAttack Rates • Incidence rates important to study of acute diseases • Acute disease: lasts three months or less • Prevalence rates useful for study of chronic diseases • Chronic disease: last longer than three months • Incidence and prevalence rates expressed as crude or specific
  • 7.
  • 8.
    Crude and Age-AdjustedRates • Crude rates: denominator includes the total population • Crude birth rate: # of live births in given year, divided by midyear population • Crude death rate: # of deaths in given year from all causes, divided by midyear population • Age-adjusted rates: used to make comparisons of relative risks across groups and over time when groups differ in age structure
  • 9.
  • 10.
  • 11.
    Specific Rates • Measuremorbidity and mortality for particular populations or diseases • Case fatality rate: percentage of cases of a particular disease that result in death • Proportionate mortality ratio: percentage of overall mortality in a population that is attributable to a particular cause
  • 12.
    Important Rates inEpidemiology
  • 13.
    Reporting of Birth,Deaths, and Diseases • Physicians, clinics, and hospitals required to report births, deaths, and notifiable diseases • Notifiable diseases: infectious diseases in which health officials request or require reporting • Can become epidemics • Health officials maintain weekly records • Various challenges to maintaining accurate data
  • 14.
  • 15.
    Standardized Measurements ofHealth Status of Populations • Mortality statistics most reliable measure of population health status • Easier to track death than illness • Life expectancy: average number of years a person from a specific cohort is projected to live from a given point in time • Years of potential life lost (YPLL): number of years lost when death occurs before one’s life expectancy
  • 16.
  • 17.
    Years of PotentialLife Lost • Subtract person’s age at death from his or her life expectancy • Difficult to determine because life expectancy changes at different ages • Weighs death of young person as counting more than death of old
  • 18.
    Sources of StandardizedData • Various valid sources have specific value and usefulness to those in public health • U.S. Census • Taken every 10 years • Enumeration of the population • More complex now • Gathers data on race, age, income, employment, education, and other social indicators
  • 19.
    Sources of StandardizedData (ctd) • Statistical Abstract of the United States • Book published annually by Bureau of Census • Summary of statistics on social, political, and economic organization of the United States • Monthly Vital Statistics Report • Vital statistics are summaries of records of major life events: birth, death, marriage, divorce • Published by National Center for Health Statistics under the CDC • Also calculates death rates by race and age
  • 20.
    Sources of StandardizedData (ctd) • Morbidity and Mortality Weekly Report (MMWR) • Prepared by CDC from state health department reports • Reports morbidity and mortality data by state and region of U.S. • Reports outbreaks of disease, environmental hazards, unusual cases, or other public health problems
  • 21.
    National Health Surveys •National Health Survey Act of 1956 authorized continuing survey of amount, distribution, and effects of illness and disability in the U.S. • Three types of surveys • Health interviews of people • Clinical tests, measurements, and physical examinations • Surveys of places where people receive medical care
  • 22.
    Some National HealthSurveys • National Health Interview Survey (NHIS) • Conducted by NCHS • Questions respondents about their health • National Health and Nutrition Examination Survey (NHANES) • Assesses health and nutrition status through mobile examination center • Behavioral Risk Factor Surveillance System (BRFSS); National Health Care Survey (NHCS)
  • 23.
    Epidemiological Studies • Investigationscarried out when disease or death occurs in unexpected or unacceptable numbers • Descriptive studies • Describe epidemics with respect to person, place, and time • Analytic studies • Aimed at testing hypotheses
  • 24.
    Descriptive Studies • Who? • Case count, followed by who is ill (children, men, women, race, etc.) • When? • Time of onset for each case • Epidemic curves created • Where? • Determine residential address and travel history
  • 25.
    Epidemic Curves • Graphicdisplay of the cases of disease according to the time or date of onset of symptoms • Secular, seasonal, and single epidemic curves • Single epidemic curves • Point source epidemic curve • Propagated epidemic curve
  • 26.
  • 27.
  • 28.
  • 29.
  • 30.
    Analytic Studies • Testhypotheses about relationships between health problems and possible risk factors • Observational studies: investigator observes natural course of events, noting exposed vs. unexposed and disease development • Case/control studies • Cohort studies • Experimental studies: investigator allocates exposure and follows development of disease
  • 31.
    Case/Control Studies • Case/Control • Compares those with disease to those without but with similar background and/or with prior exposure to certain risk factors • Aimed at identifying factors more common in case than control group
  • 32.
    Cohort Studies • Cohortis classified by exposure to one or more risk factors and observed to determine rate of disease development • Cohort: group of people who share important demographic characteristic • Odds ratio • Relative risk
  • 33.
    Experimental Studies • Carriedout to identify cause of disease or determine effectiveness of vaccine, drug, or procedure • Control for variables • Control groups • Randomization • Blinding • Placebo: blank treatment
  • 34.
    Criteria of Causation •Questions exposure causing development of disease • Criteria • Strength • Consistency • Specificity • Temporality • Biological plausibility
  • 35.
    Discussion Questions • Howcan data collection for notifiable diseases be improved? • Why is tracking vital statistics so important? • How does calculating Years of Potential Life Lost change the way we think about community health efforts?