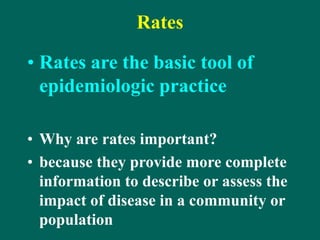
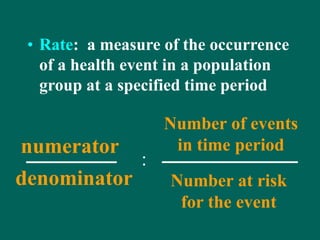
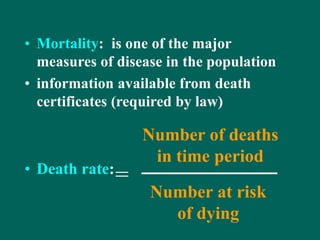
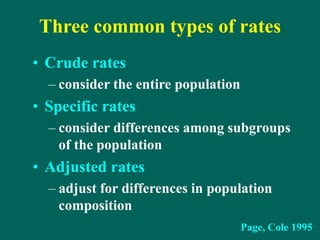
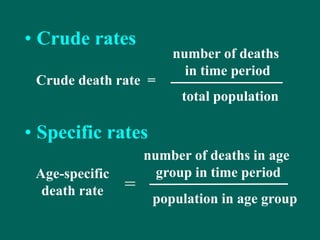
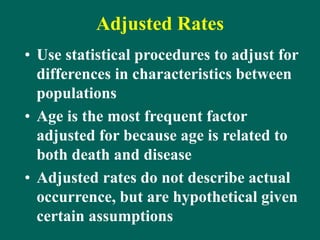
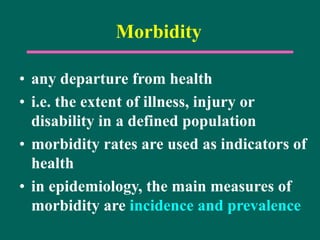
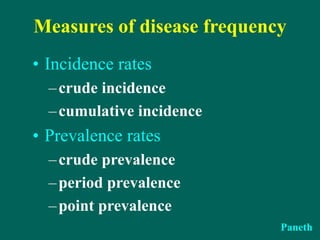
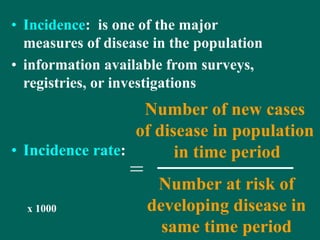
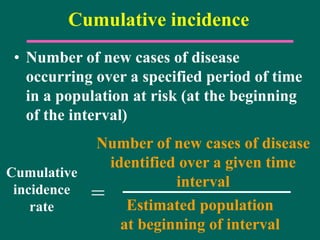
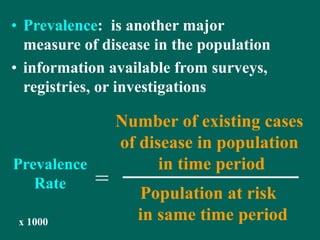
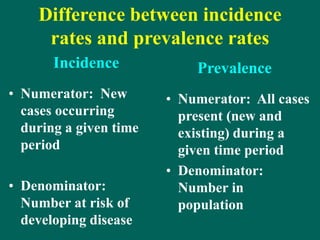
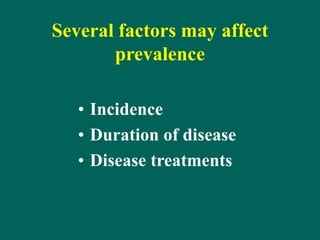
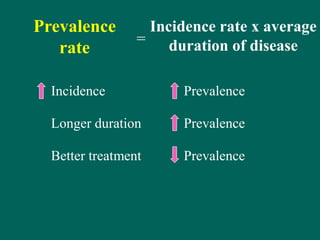
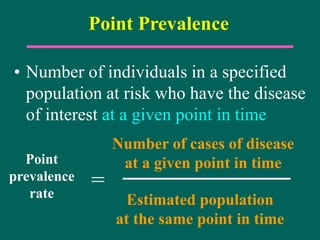
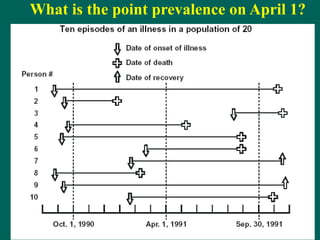
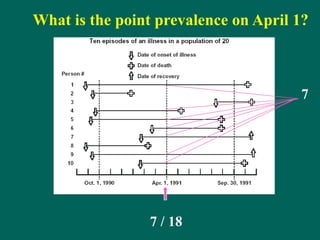
Assessing Disease Frequency
Thomas Songer, PhD
Basic Epidemiology
South Asian Cardiovascular
Research Methodology Workshop
Why should we be
concerned with
monitoring disease(s)?
Disease Control and Prevention
Good monitoring does not necessarily
ensure the making of right decisions,
but it reduces the risk of wrong ones.
Languimer, 1963
There are several decisions regarding
disease monitoring
• What level of resources should be
allocated to disease monitoring?
• What outcomes do we want to achieve?
• What benefits are obtained from these
items and to whom do the benefits
accrue?
• Can the counting methods be readily
accepted into the community?
Approaches Towards Monitoring
Disease and Injury
Death Certificates
Population Surveys
Surveillance
Registries
Screening
Surveillance:
Systematic, regular ascertainment
of incidence using methods
distinguished by their practicality,
uniformity, and frequently their
rapidity, rather than by complete
accuracy.
Last, 1990
Types of Surveillance
•Active
•Passive
Active Surveillance
• the collection of data on a
disease by regular outreach.
Designated medical personnel
are called at regular intervals to
collect information on the new
cases of disease.
monitoring domestic violence in
emergency departments
Active Surveillance
Health Dept.
Passive Surveillance
• data generated without contact by
the agency carrying out the
surveillance. Reportable diseases
fall under this type of surveillance.
Passive Surveillance
Health Dept.
Comparison of Disease Counting
Approaches
Registries
Population
Screening
Communicable
Disease
Surveillance
Source Academia Academia Health Depts
Speed Slow Slow Fast
Cost/Case High High Low
Ascertain
-ment
>90 % 65-75% Low and
Variable
So you have identified the frequency
of disease in a given area….
What do you do with it?
Epidemiology is a Science of Rates
• death rates
• disability rates
• hospitalization rates
• incidence rates
• prevalence rates
Rates
• Rates are the basic tool of
epidemiologic practice
• Why are rates important?
• because they provide more complete
information to describe or assess the
impact of disease in a community or
population
• Rate: a measure of the occurrence
of a health event in a population
group at a specified time period
Number of events
in time period
Number at risk
for the event
numerator
denominator
:
Why are rates useful?
• Can help to identify groups with an
elevated risk of disease
– can target interventions to these groups
– these groups can be studied to identify
risk factors
Page, Cole 1995
Rates
• Relate health events to a population
base
• This provides a basis for making valid
comparisons of health events by
considering the number at risk in
each population
Page, Cole 1995
Injury Deaths, Australia, 1992
0
100
200
300
400
500
600
700
10-14
yrs
20-24 30-34 40-44 50-54 60-64 70-74 80-84
number
of
deaths
Male Female
Age Group
Harrison, 1995
Injury Death Rates, Australia, 1992
0
50
100
150
200
10-14
yrs
20-24 30-34 40-44 50-54 60-64 70-74 80-84
deaths
per
100,000
pop.
Male Female
Age Group
Harrison, 1995
• Mortality: is one of the major
measures of disease in the population
• information available from death
certificates (required by law)
• Death rate:
Number of deaths
in time period
Number at risk
of dying
=
Three common types of rates
• Crude rates
• Specific rates
• Adjusted rates
Page, Cole 1995
Three common types of rates
• Crude rates
– consider the entire population
• Specific rates
– consider differences among subgroups
of the population
• Adjusted rates
– adjust for differences in population
composition
Page, Cole 1995
• Crude rates
• Specific rates
Crude death rate =
number of deaths
in time period
total population
Age-specific
death rate
number of deaths in age
group in time period
population in age group
=
Adjusted Rates
• Use statistical procedures to adjust for
differences in characteristics between
populations
• Age is the most frequent factor
adjusted for because age is related to
both death and disease
• Adjusted rates do not describe actual
occurrence, but are hypothetical given
certain assumptions
Crude and Age-Adjusted Death Rates
United States, 1940-1992
0
200
400
600
800
1000
1200
1940 1944 1948 1952 1956 1960 1964 1968 1972 1976 1980 1984 1988 1992
per
100,000
population
crude death rate
age-adjusted death rate
Morbidity
• any departure from health
• i.e. the extent of illness, injury or
disability in a defined population
• morbidity rates are used as indicators of
health
• in epidemiology, the main measures of
morbidity are incidence and prevalence
Measures of disease frequency
• Incidence rates
–crude incidence
–cumulative incidence
• Prevalence rates
–crude prevalence
–period prevalence
–point prevalence
Paneth
• Incidence: is one of the major
measures of disease in the population
• information available from surveys,
registries, or investigations
• Incidence rate:
Number of new cases
of disease in population
in time period
Number at risk of
developing disease in
same time period
=
x 1000
Incidence Rate
• The numerator has to come from the
population at risk for developing
disease
• The denominator may change over
time as people develop disease
• The denominator does not include
persons with the disease
numerator
denominator
Incidence Rate
• in large studies, the denominator is
often the mid-year population
• in small studies, the denominator does
not include persons with the disease
numerator
denominator
However, in practice
What is the incidence rate from
October 1, 1990 to Sep 30, 1991?
What is the incidence rate from
October 1, 1990 to Sep 30, 1991?
4
4 / 14
Cumulative incidence
• Number of new cases of disease
occurring over a specified period of time
in a population at risk (at the beginning
of the interval)
Number of new cases of disease
identified over a given time
interval
Estimated population
at beginning of interval
=
Cumulative
incidence
rate
Prevalence
• Prevalence: is another major
measure of disease in the population
• information available from surveys,
registries, or investigations
Number of existing cases
of disease in population
in time period
Population at risk
in same time period
=
x 1000
Prevalence
Rate
Difference between incidence
rates and prevalence rates
• Numerator: New
cases occurring
during a given time
period
• Denominator:
Number at risk of
developing disease
• Numerator: All cases
present (new and
existing) during a
given time period
• Denominator:
Number in
population
Incidence Prevalence
Several factors may affect
prevalence
• Incidence
• Duration of disease
• Disease treatments
Prevalence
rate
Incidence Prevalence
Longer duration Prevalence
Better treatment Prevalence
=
Incidence rate x average
duration of disease
Point Prevalence
• Number of individuals in a specified
population at risk who have the disease
of interest at a given point in time
Number of cases of disease
at a given point in time
Estimated population
at the same point in time
=
Point
prevalence
rate
What is the point prevalence on April 1?
7
7 / 18

19081.ppt

  • 1.
    Assessing Disease Frequency ThomasSonger, PhD Basic Epidemiology South Asian Cardiovascular Research Methodology Workshop
  • 2.
    Why should webe concerned with monitoring disease(s)?
  • 3.
  • 4.
    Good monitoring doesnot necessarily ensure the making of right decisions, but it reduces the risk of wrong ones. Languimer, 1963
  • 5.
    There are severaldecisions regarding disease monitoring • What level of resources should be allocated to disease monitoring? • What outcomes do we want to achieve? • What benefits are obtained from these items and to whom do the benefits accrue? • Can the counting methods be readily accepted into the community?
  • 6.
    Approaches Towards Monitoring Diseaseand Injury Death Certificates Population Surveys Surveillance Registries Screening
  • 7.
    Surveillance: Systematic, regular ascertainment ofincidence using methods distinguished by their practicality, uniformity, and frequently their rapidity, rather than by complete accuracy. Last, 1990
  • 8.
  • 9.
    Active Surveillance • thecollection of data on a disease by regular outreach. Designated medical personnel are called at regular intervals to collect information on the new cases of disease. monitoring domestic violence in emergency departments
  • 10.
  • 11.
    Passive Surveillance • datagenerated without contact by the agency carrying out the surveillance. Reportable diseases fall under this type of surveillance.
  • 12.
  • 13.
    Comparison of DiseaseCounting Approaches Registries Population Screening Communicable Disease Surveillance Source Academia Academia Health Depts Speed Slow Slow Fast Cost/Case High High Low Ascertain -ment >90 % 65-75% Low and Variable
  • 14.
    So you haveidentified the frequency of disease in a given area…. What do you do with it?
  • 15.
    Epidemiology is aScience of Rates • death rates • disability rates • hospitalization rates • incidence rates • prevalence rates
  • 16.
    Rates • Rates arethe basic tool of epidemiologic practice • Why are rates important? • because they provide more complete information to describe or assess the impact of disease in a community or population
  • 17.
    • Rate: ameasure of the occurrence of a health event in a population group at a specified time period Number of events in time period Number at risk for the event numerator denominator :
  • 18.
    Why are ratesuseful? • Can help to identify groups with an elevated risk of disease – can target interventions to these groups – these groups can be studied to identify risk factors Page, Cole 1995
  • 19.
    Rates • Relate healthevents to a population base • This provides a basis for making valid comparisons of health events by considering the number at risk in each population Page, Cole 1995
  • 20.
    Injury Deaths, Australia,1992 0 100 200 300 400 500 600 700 10-14 yrs 20-24 30-34 40-44 50-54 60-64 70-74 80-84 number of deaths Male Female Age Group Harrison, 1995
  • 21.
    Injury Death Rates,Australia, 1992 0 50 100 150 200 10-14 yrs 20-24 30-34 40-44 50-54 60-64 70-74 80-84 deaths per 100,000 pop. Male Female Age Group Harrison, 1995
  • 22.
    • Mortality: isone of the major measures of disease in the population • information available from death certificates (required by law) • Death rate: Number of deaths in time period Number at risk of dying =
  • 23.
    Three common typesof rates • Crude rates • Specific rates • Adjusted rates Page, Cole 1995
  • 24.
    Three common typesof rates • Crude rates – consider the entire population • Specific rates – consider differences among subgroups of the population • Adjusted rates – adjust for differences in population composition Page, Cole 1995
  • 25.
    • Crude rates •Specific rates Crude death rate = number of deaths in time period total population Age-specific death rate number of deaths in age group in time period population in age group =
  • 26.
    Adjusted Rates • Usestatistical procedures to adjust for differences in characteristics between populations • Age is the most frequent factor adjusted for because age is related to both death and disease • Adjusted rates do not describe actual occurrence, but are hypothetical given certain assumptions
  • 27.
    Crude and Age-AdjustedDeath Rates United States, 1940-1992 0 200 400 600 800 1000 1200 1940 1944 1948 1952 1956 1960 1964 1968 1972 1976 1980 1984 1988 1992 per 100,000 population crude death rate age-adjusted death rate
  • 28.
    Morbidity • any departurefrom health • i.e. the extent of illness, injury or disability in a defined population • morbidity rates are used as indicators of health • in epidemiology, the main measures of morbidity are incidence and prevalence
  • 29.
    Measures of diseasefrequency • Incidence rates –crude incidence –cumulative incidence • Prevalence rates –crude prevalence –period prevalence –point prevalence Paneth
  • 30.
    • Incidence: isone of the major measures of disease in the population • information available from surveys, registries, or investigations • Incidence rate: Number of new cases of disease in population in time period Number at risk of developing disease in same time period = x 1000
  • 31.
    Incidence Rate • Thenumerator has to come from the population at risk for developing disease • The denominator may change over time as people develop disease • The denominator does not include persons with the disease numerator denominator
  • 32.
    Incidence Rate • inlarge studies, the denominator is often the mid-year population • in small studies, the denominator does not include persons with the disease numerator denominator However, in practice
  • 33.
    What is theincidence rate from October 1, 1990 to Sep 30, 1991?
  • 34.
    What is theincidence rate from October 1, 1990 to Sep 30, 1991? 4 4 / 14
  • 35.
    Cumulative incidence • Numberof new cases of disease occurring over a specified period of time in a population at risk (at the beginning of the interval) Number of new cases of disease identified over a given time interval Estimated population at beginning of interval = Cumulative incidence rate
  • 36.
  • 37.
    • Prevalence: isanother major measure of disease in the population • information available from surveys, registries, or investigations Number of existing cases of disease in population in time period Population at risk in same time period = x 1000 Prevalence Rate
  • 38.
    Difference between incidence ratesand prevalence rates • Numerator: New cases occurring during a given time period • Denominator: Number at risk of developing disease • Numerator: All cases present (new and existing) during a given time period • Denominator: Number in population Incidence Prevalence
  • 39.
    Several factors mayaffect prevalence • Incidence • Duration of disease • Disease treatments
  • 40.
    Prevalence rate Incidence Prevalence Longer durationPrevalence Better treatment Prevalence = Incidence rate x average duration of disease
  • 41.
    Point Prevalence • Numberof individuals in a specified population at risk who have the disease of interest at a given point in time Number of cases of disease at a given point in time Estimated population at the same point in time = Point prevalence rate
  • 42.
    What is thepoint prevalence on April 1?
  • 43.
    What is thepoint prevalence on April 1? 7 7 / 18