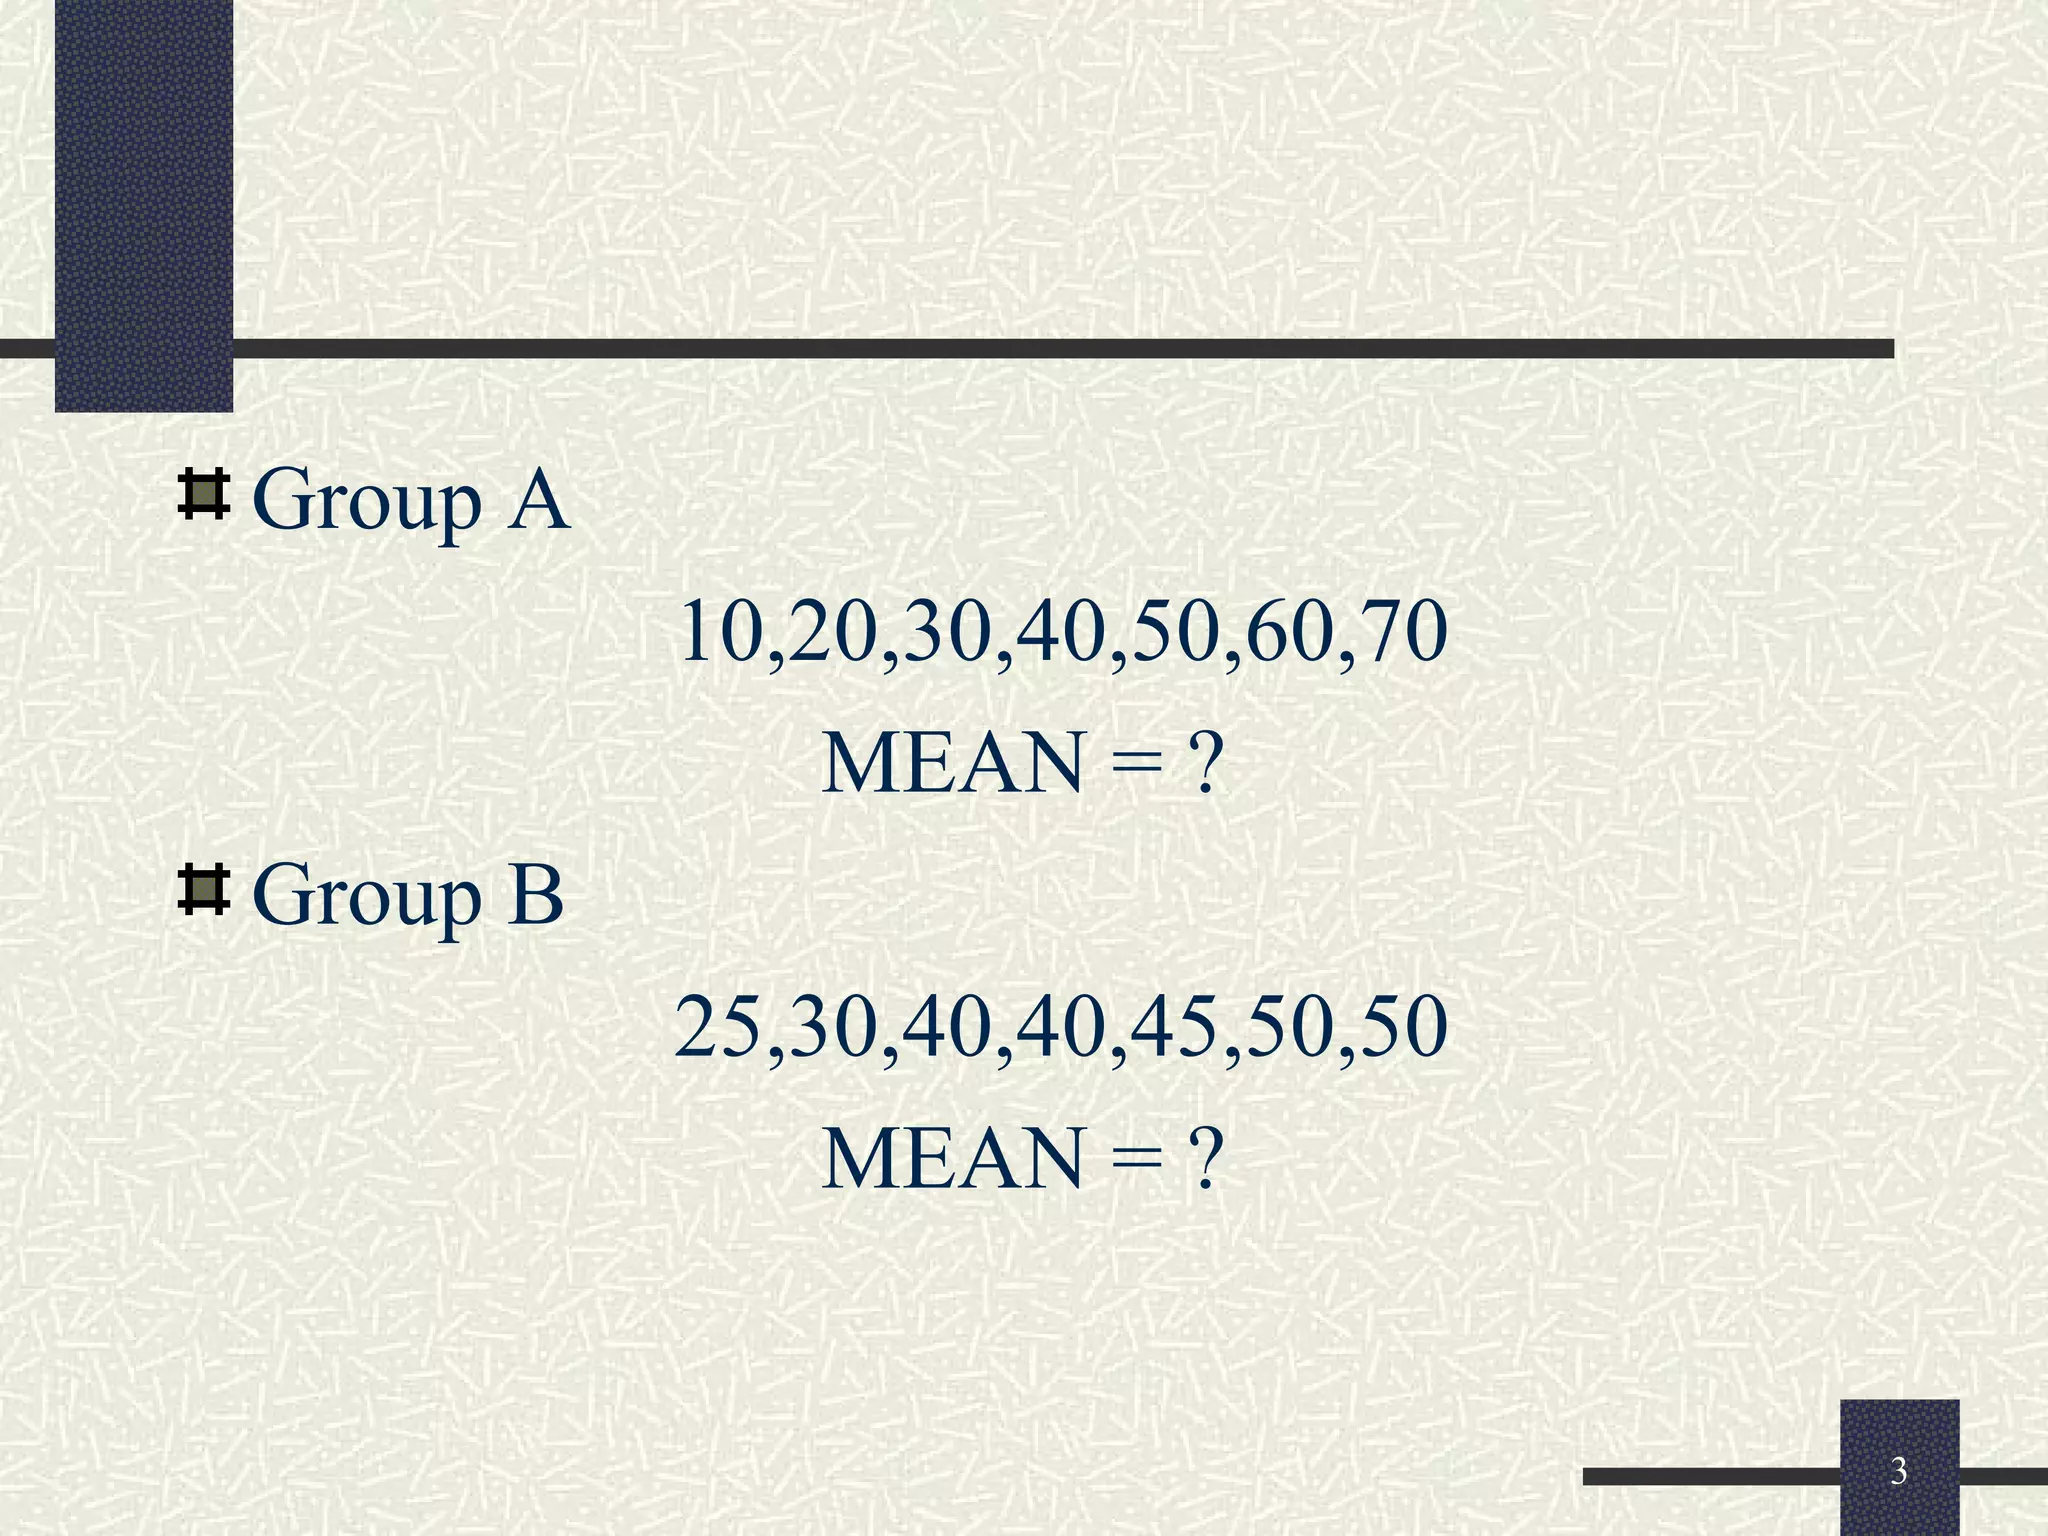
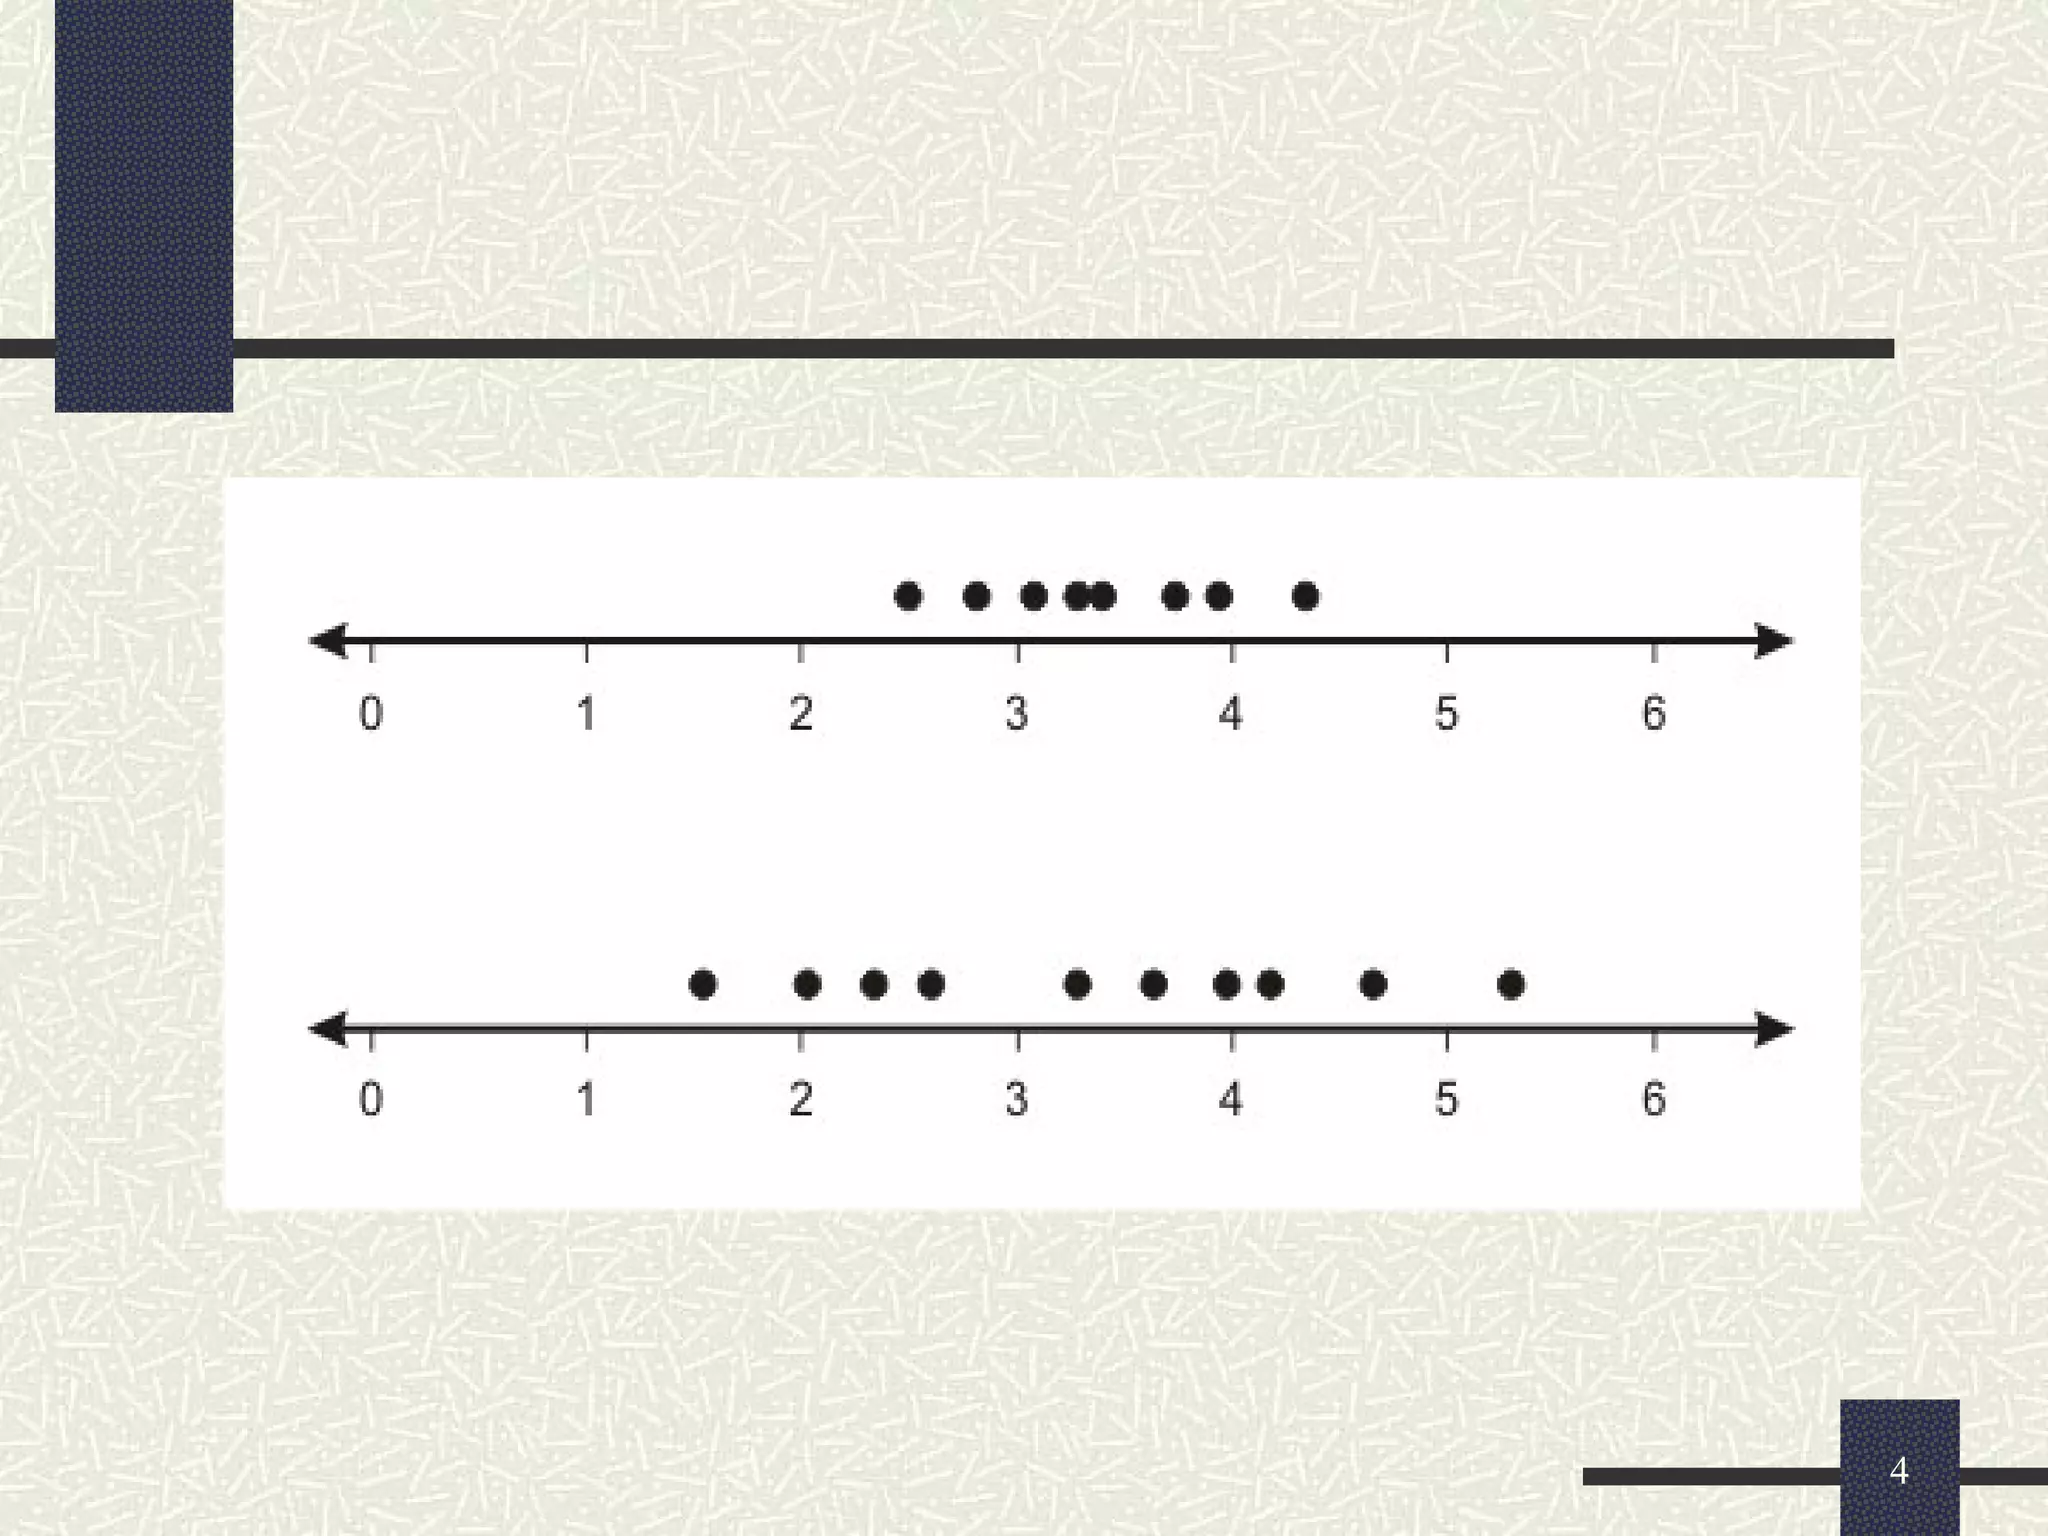
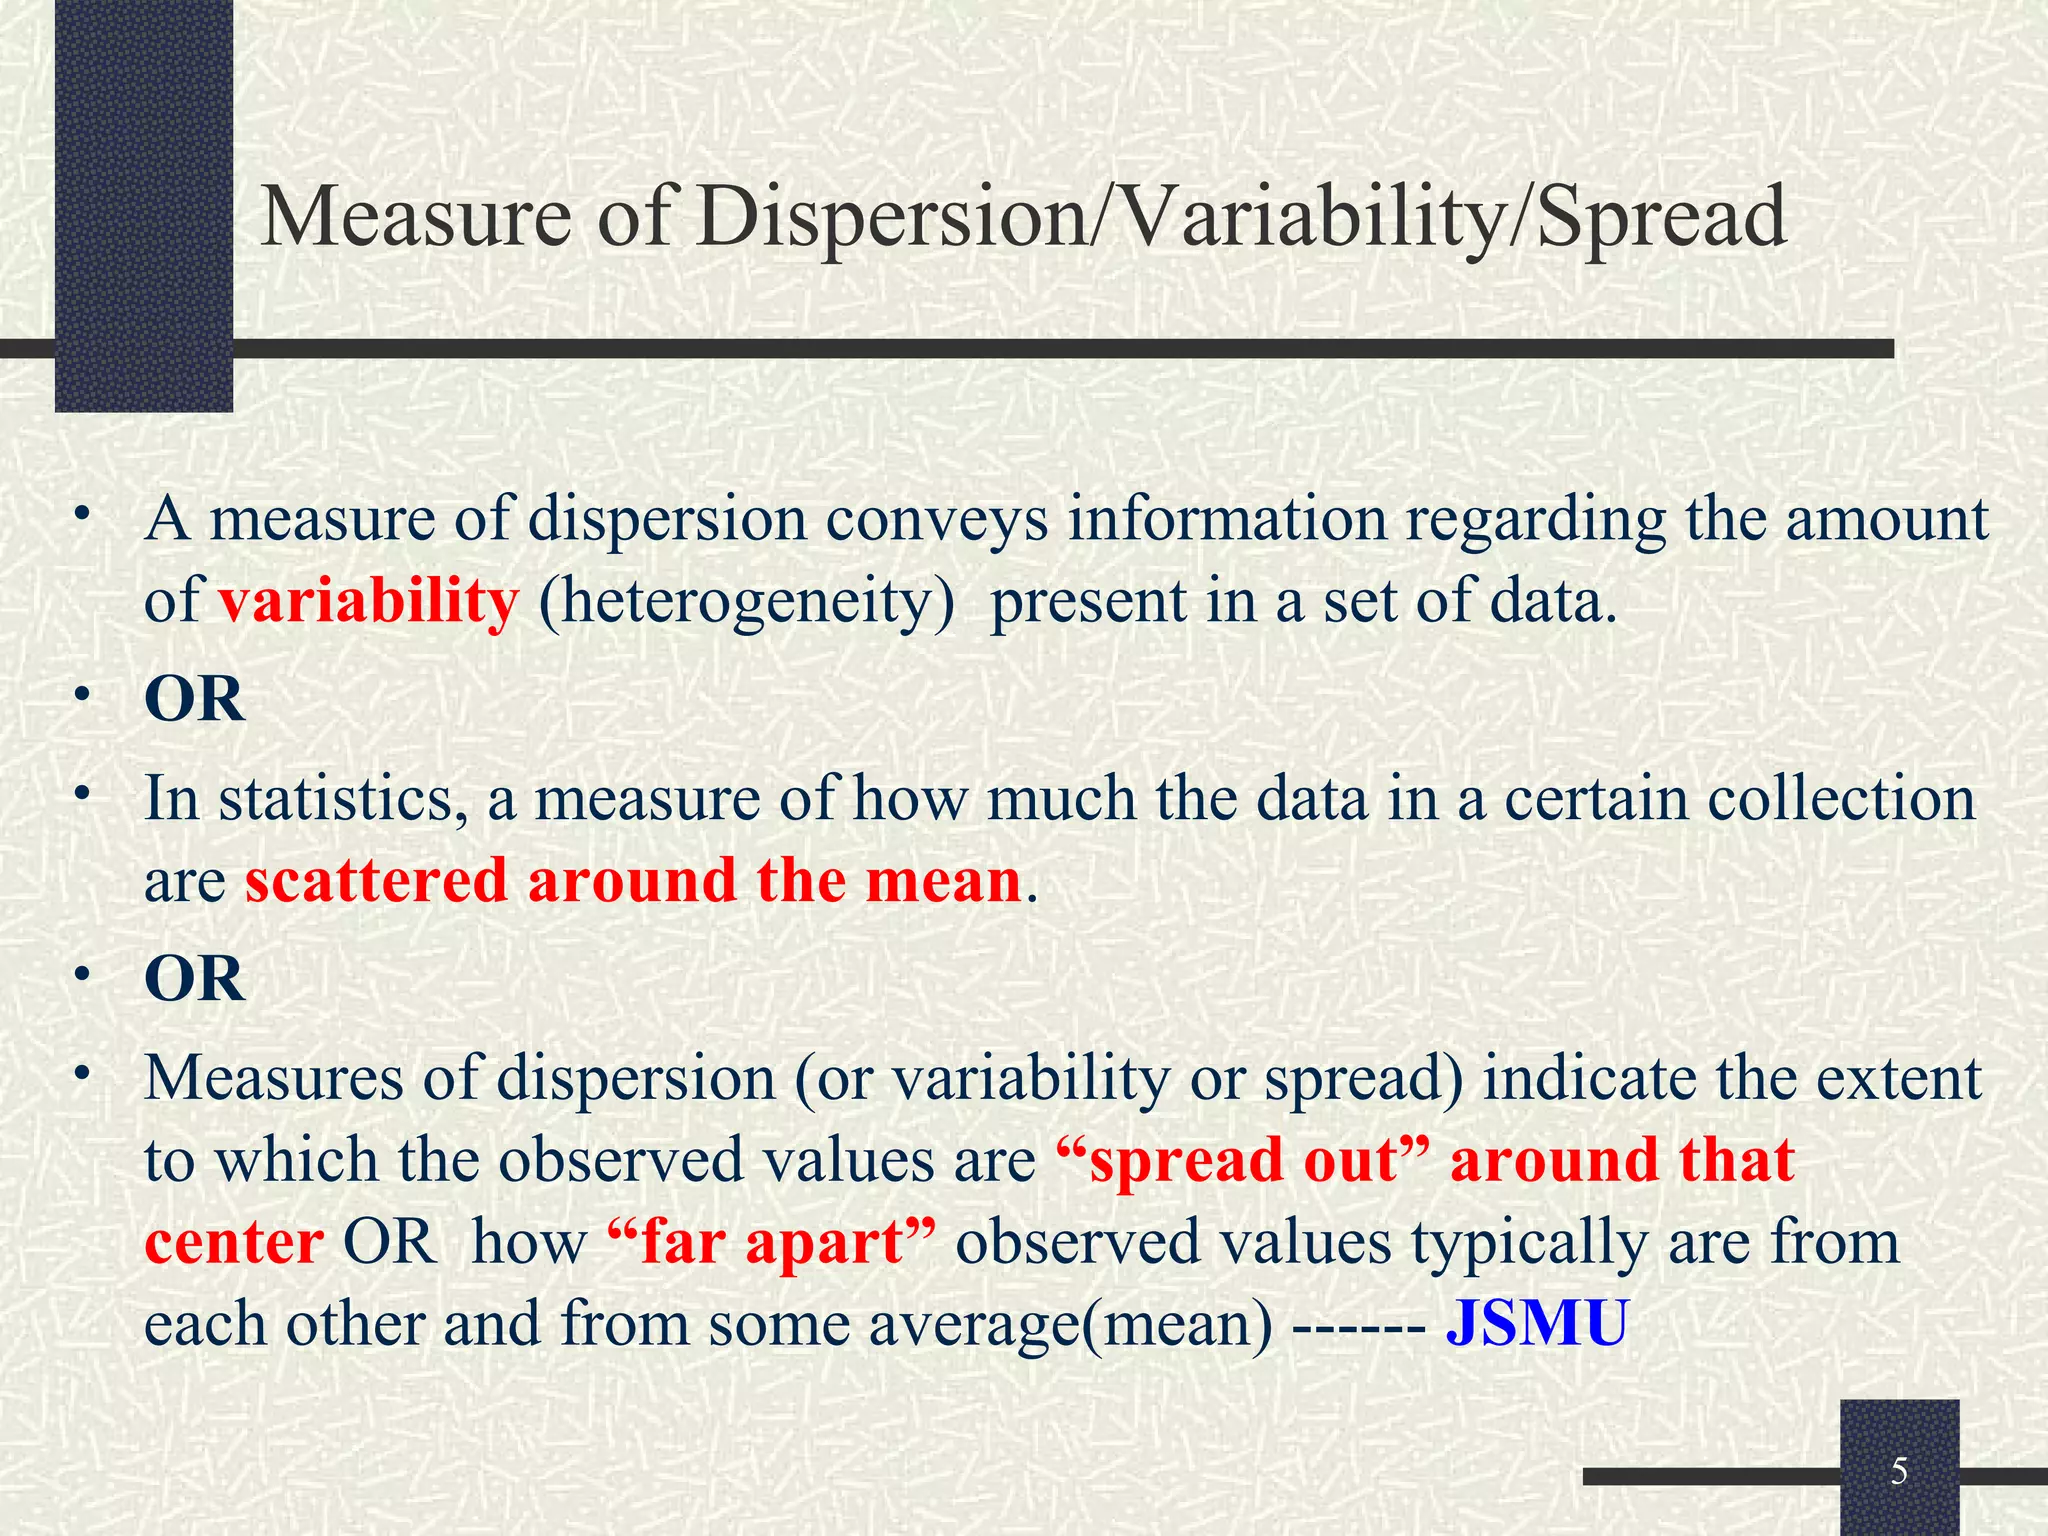
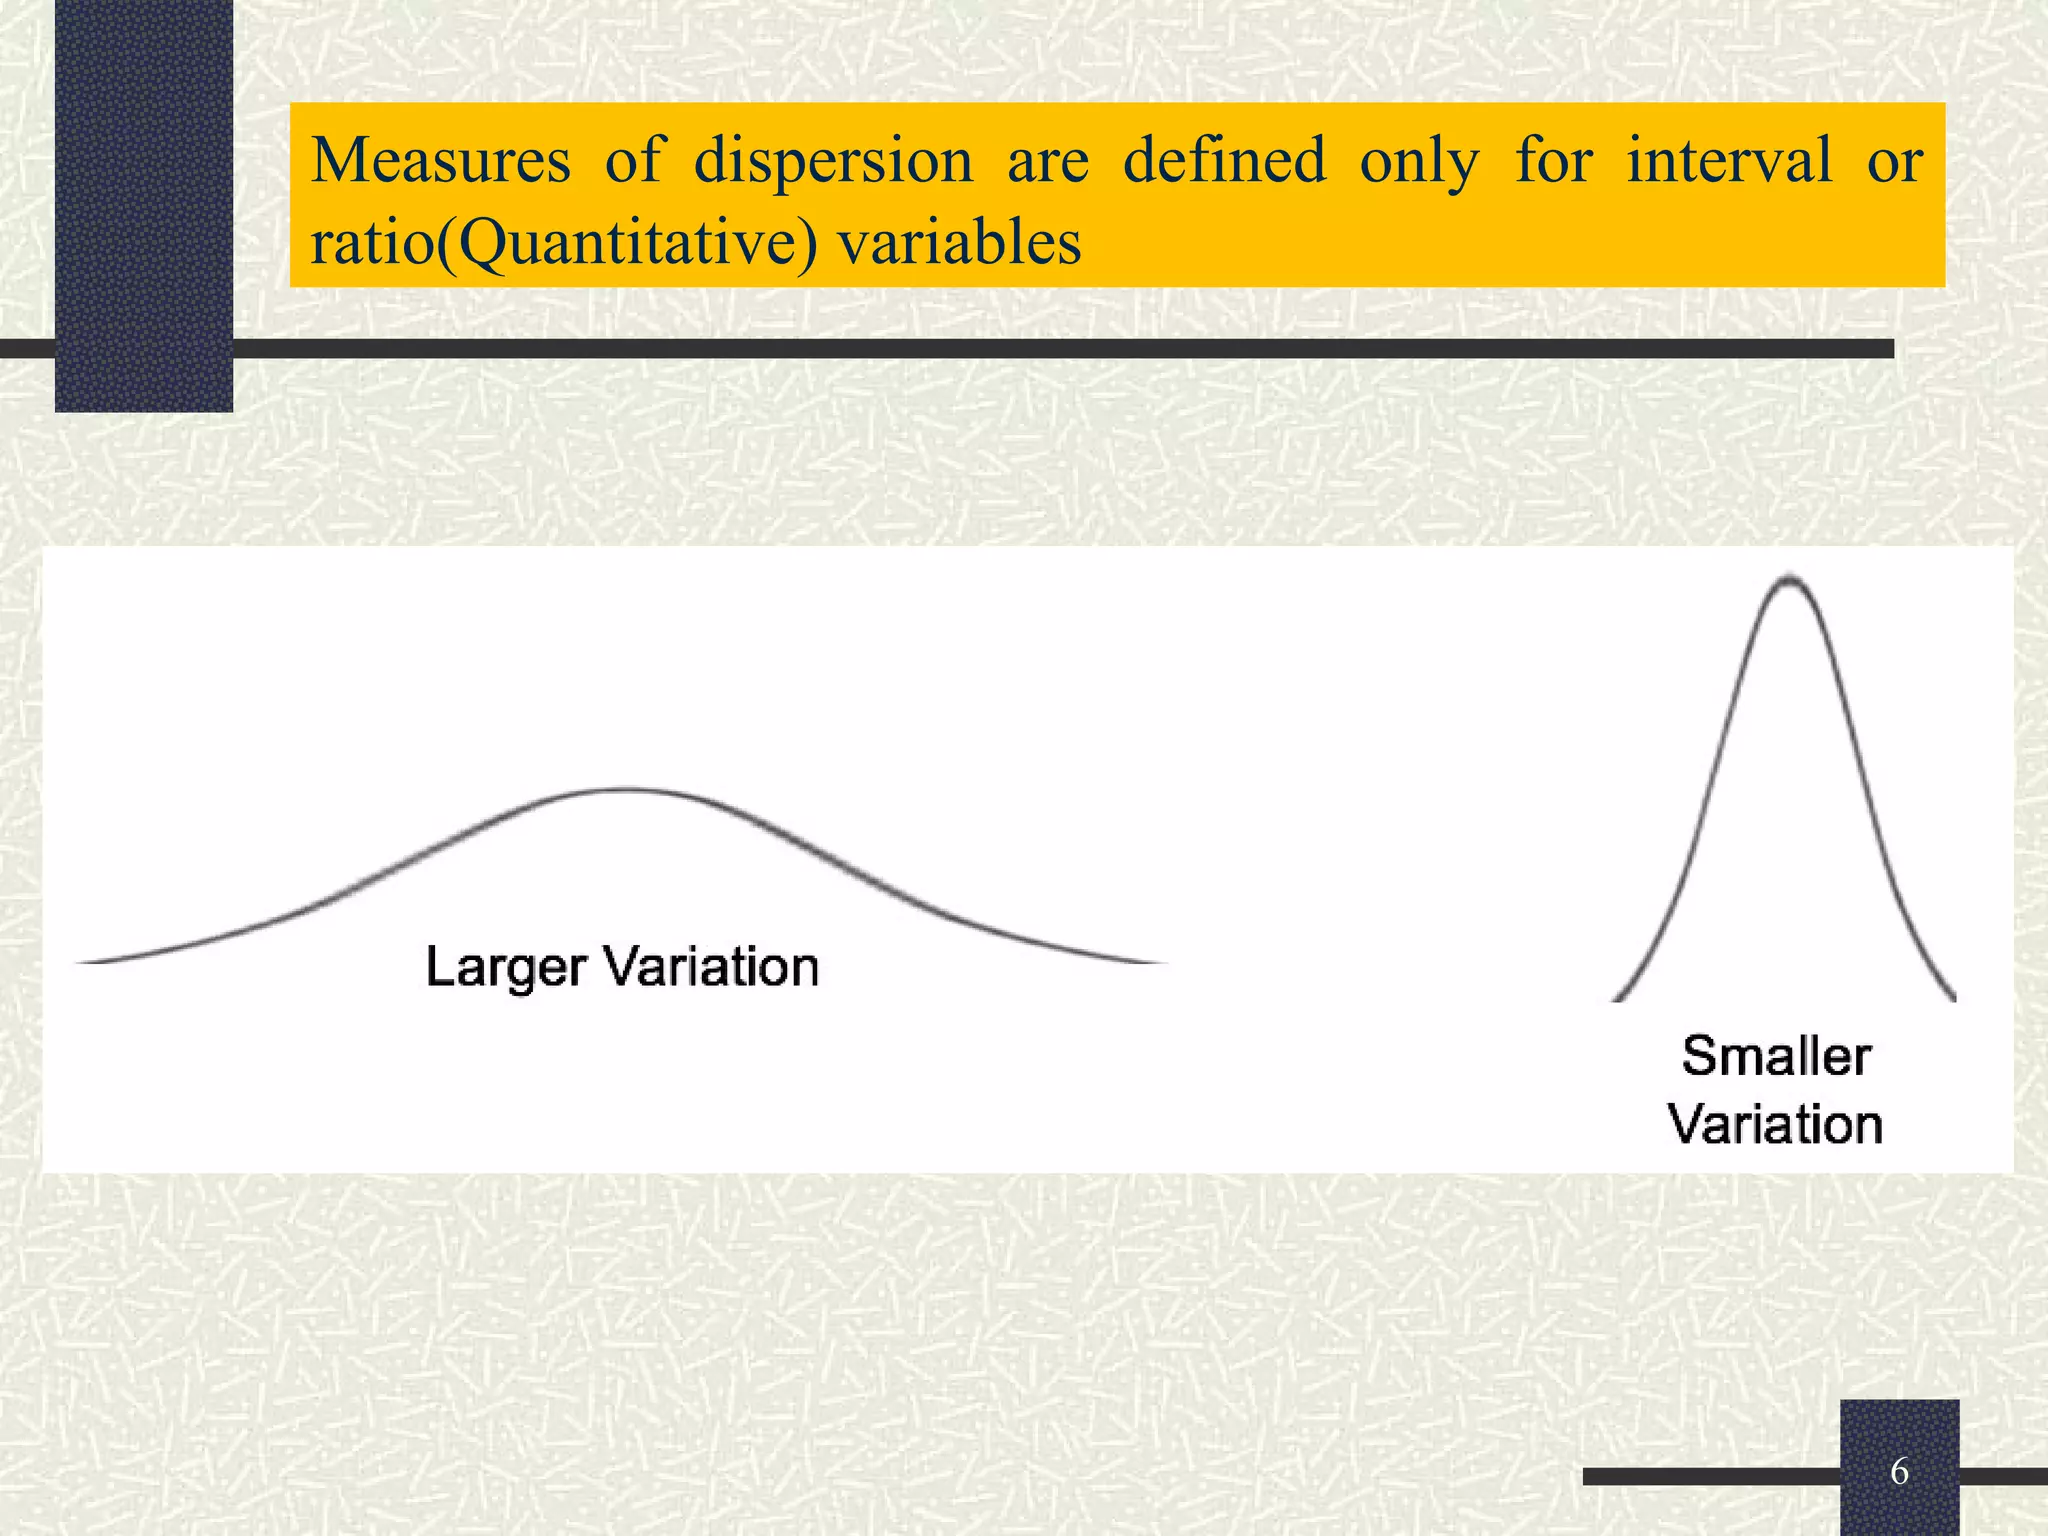
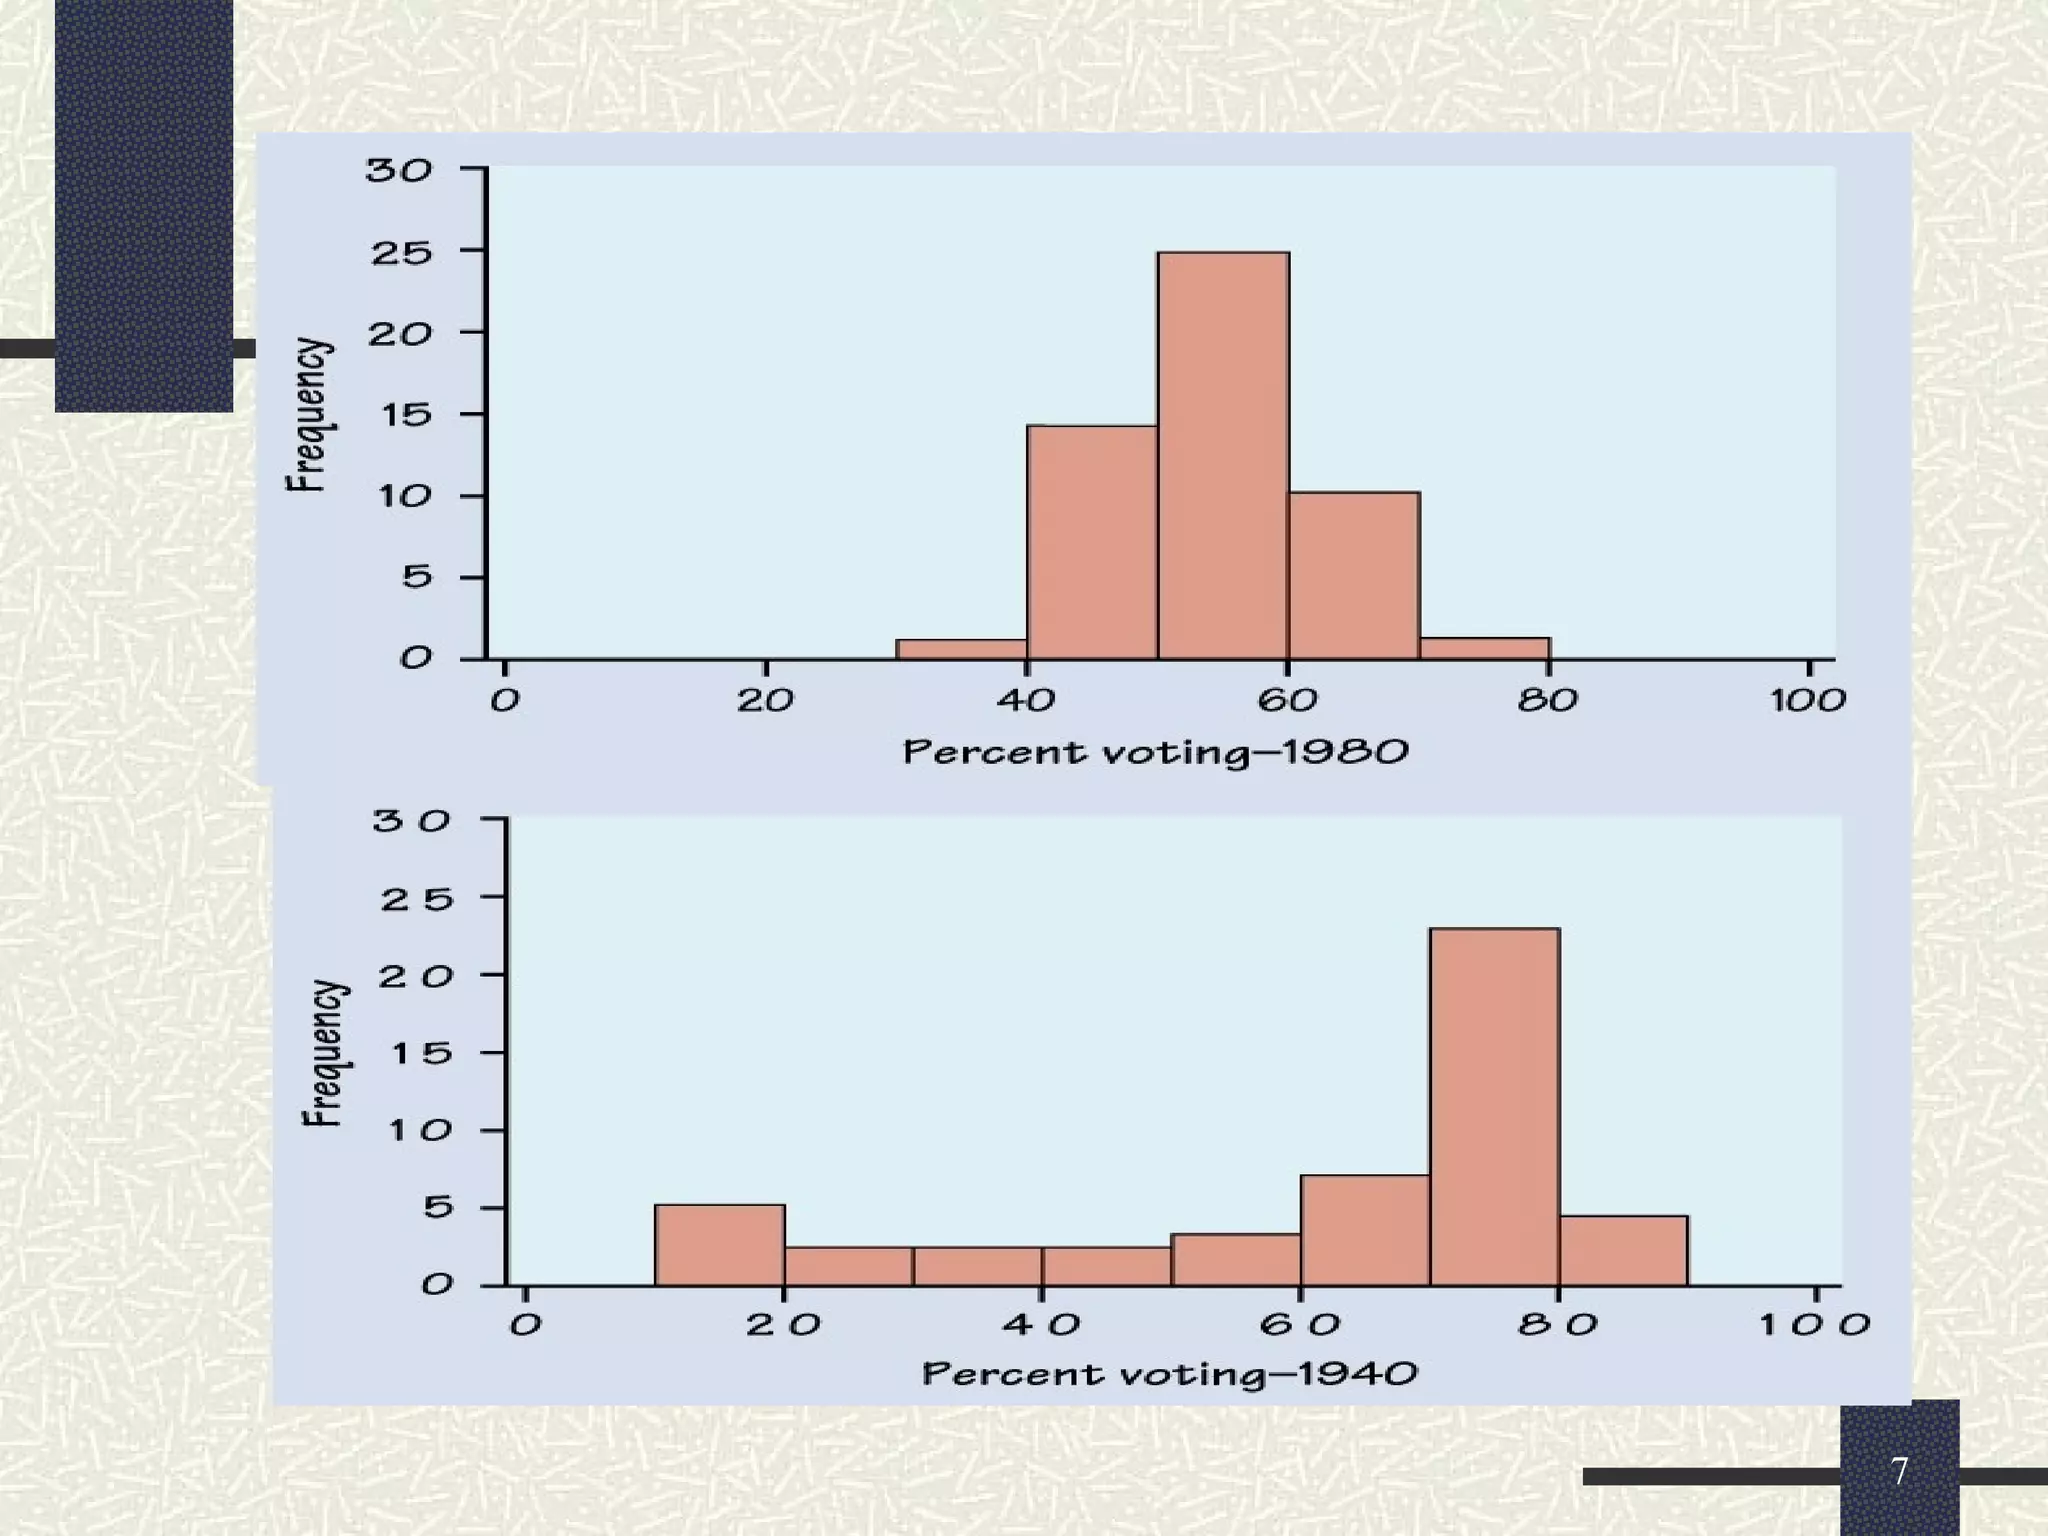
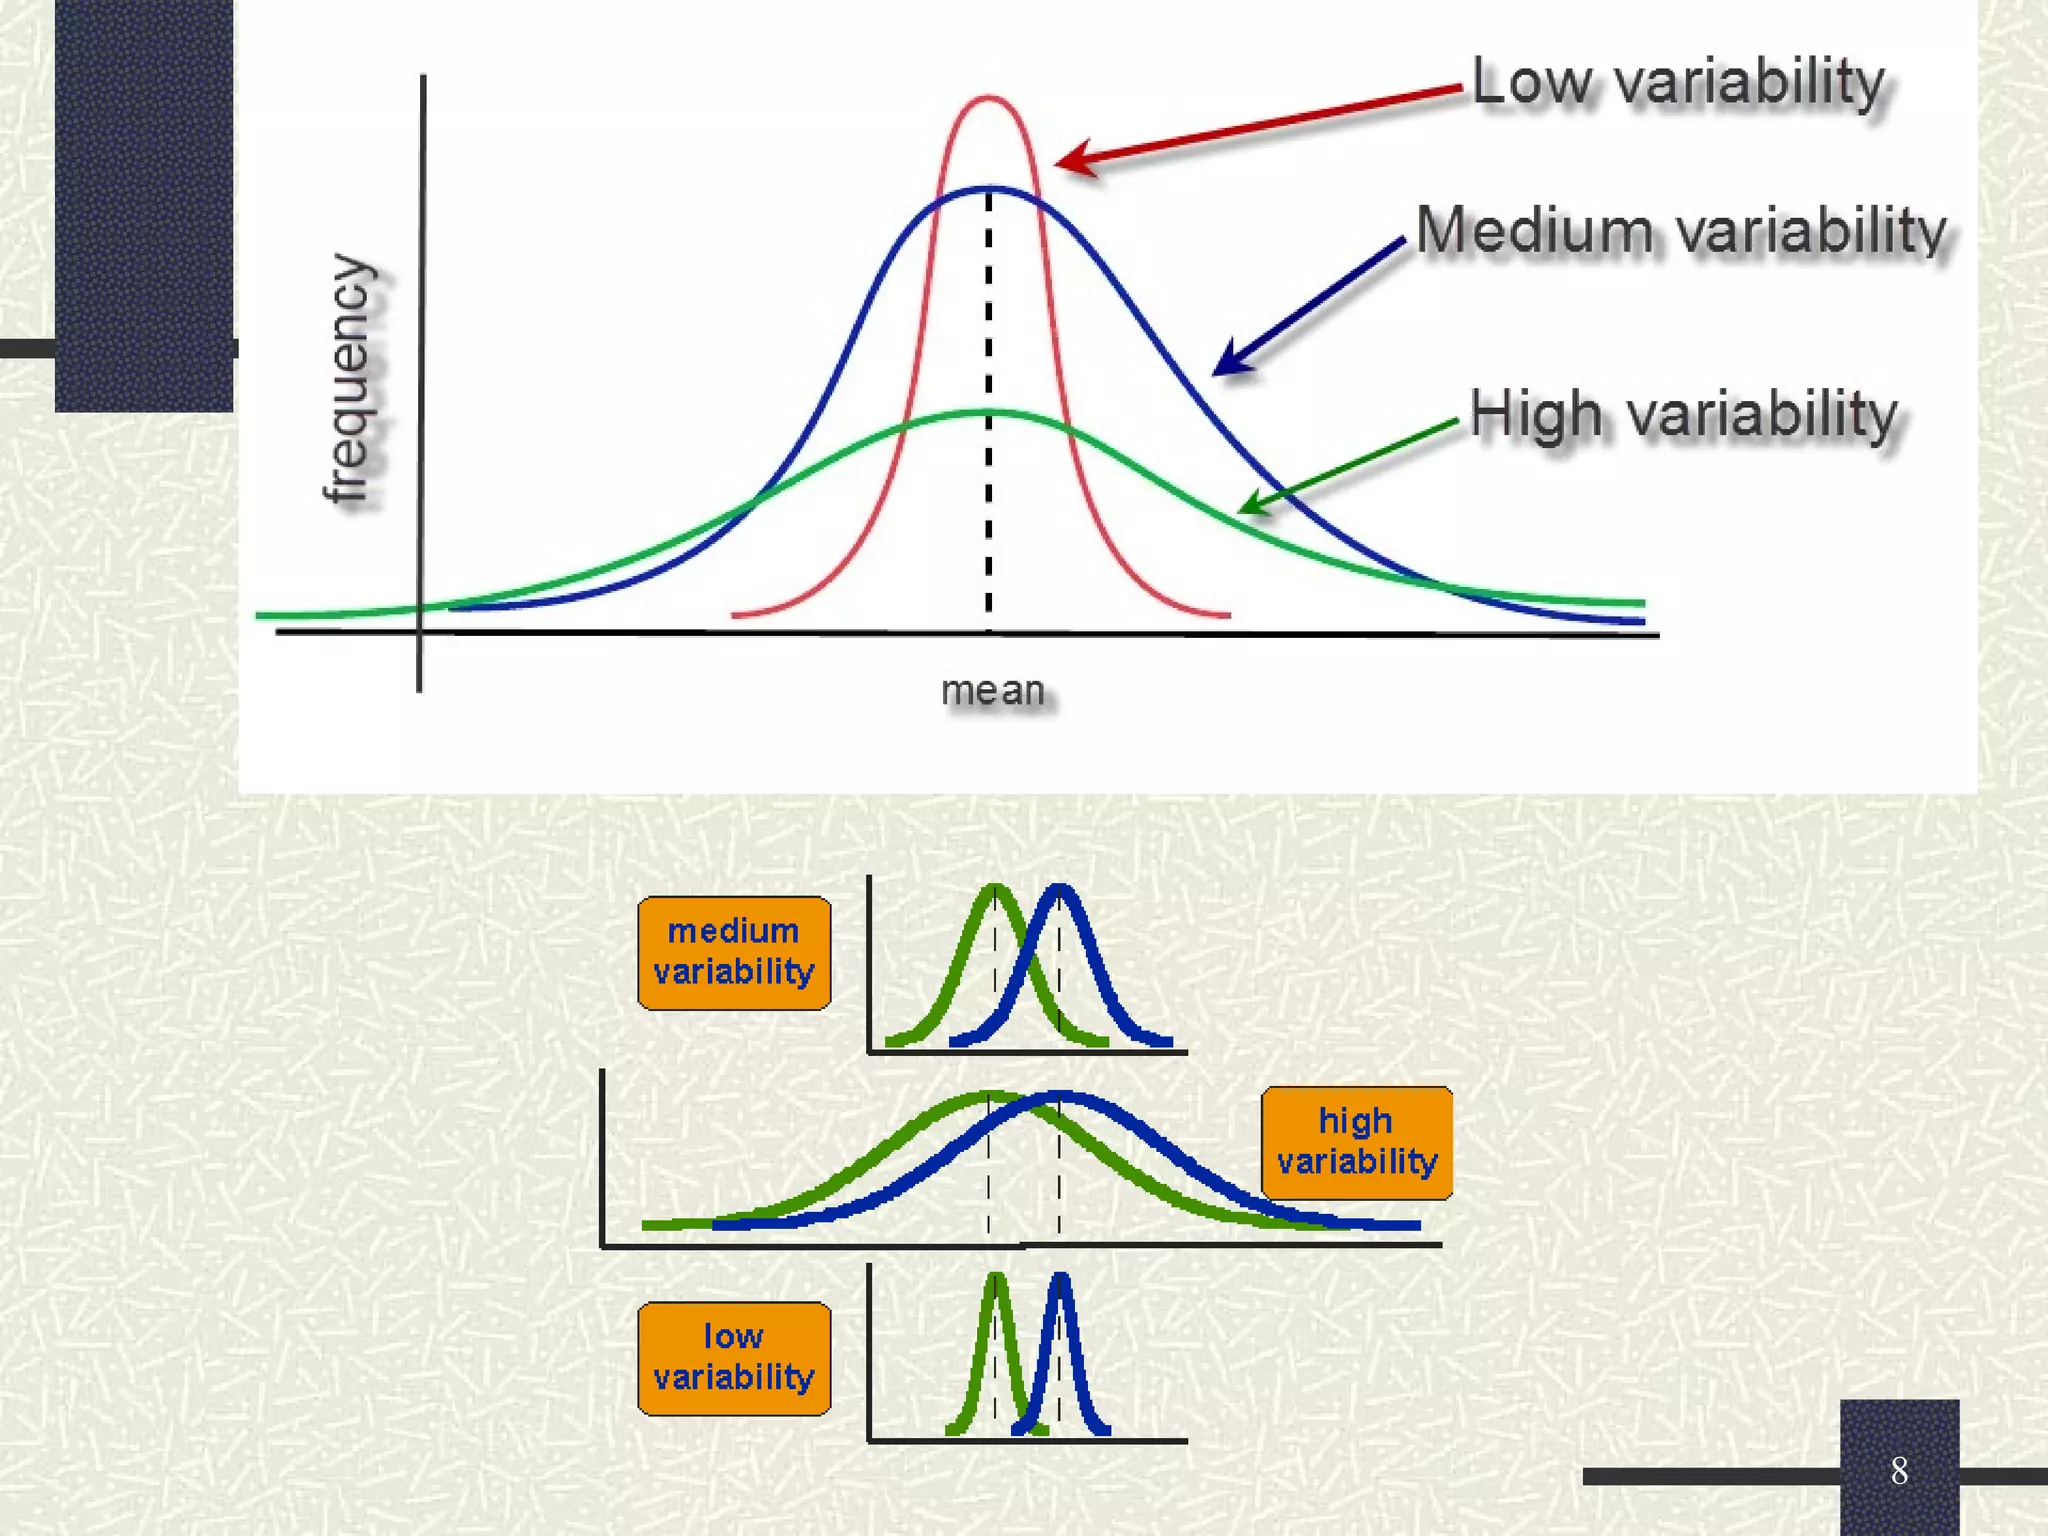
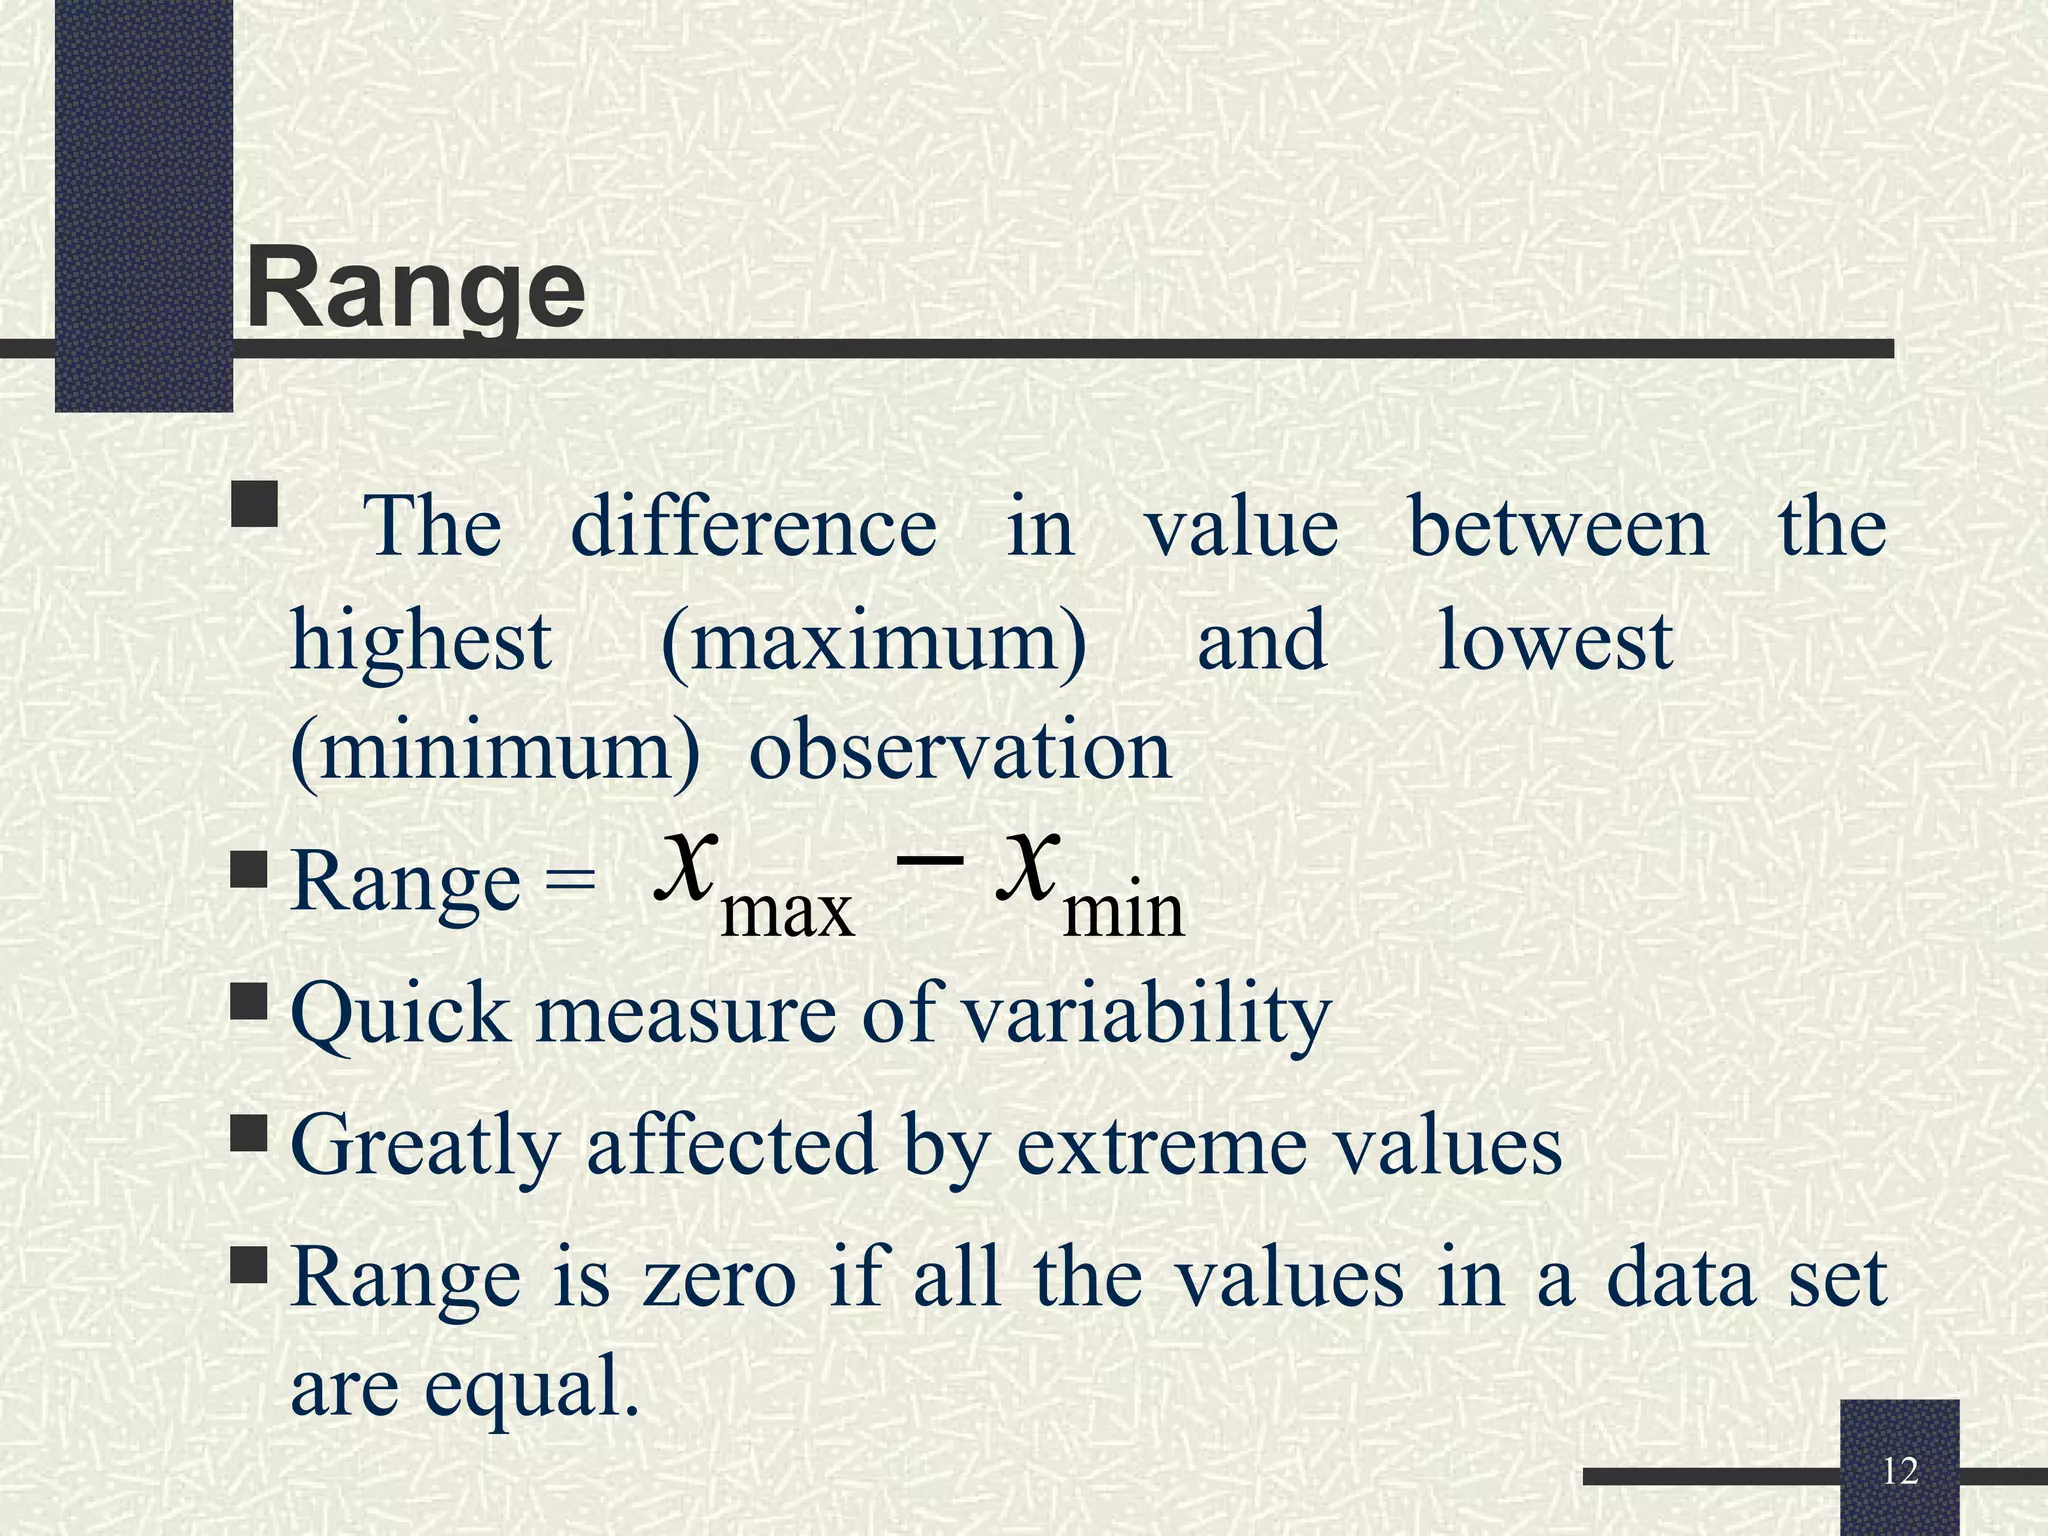
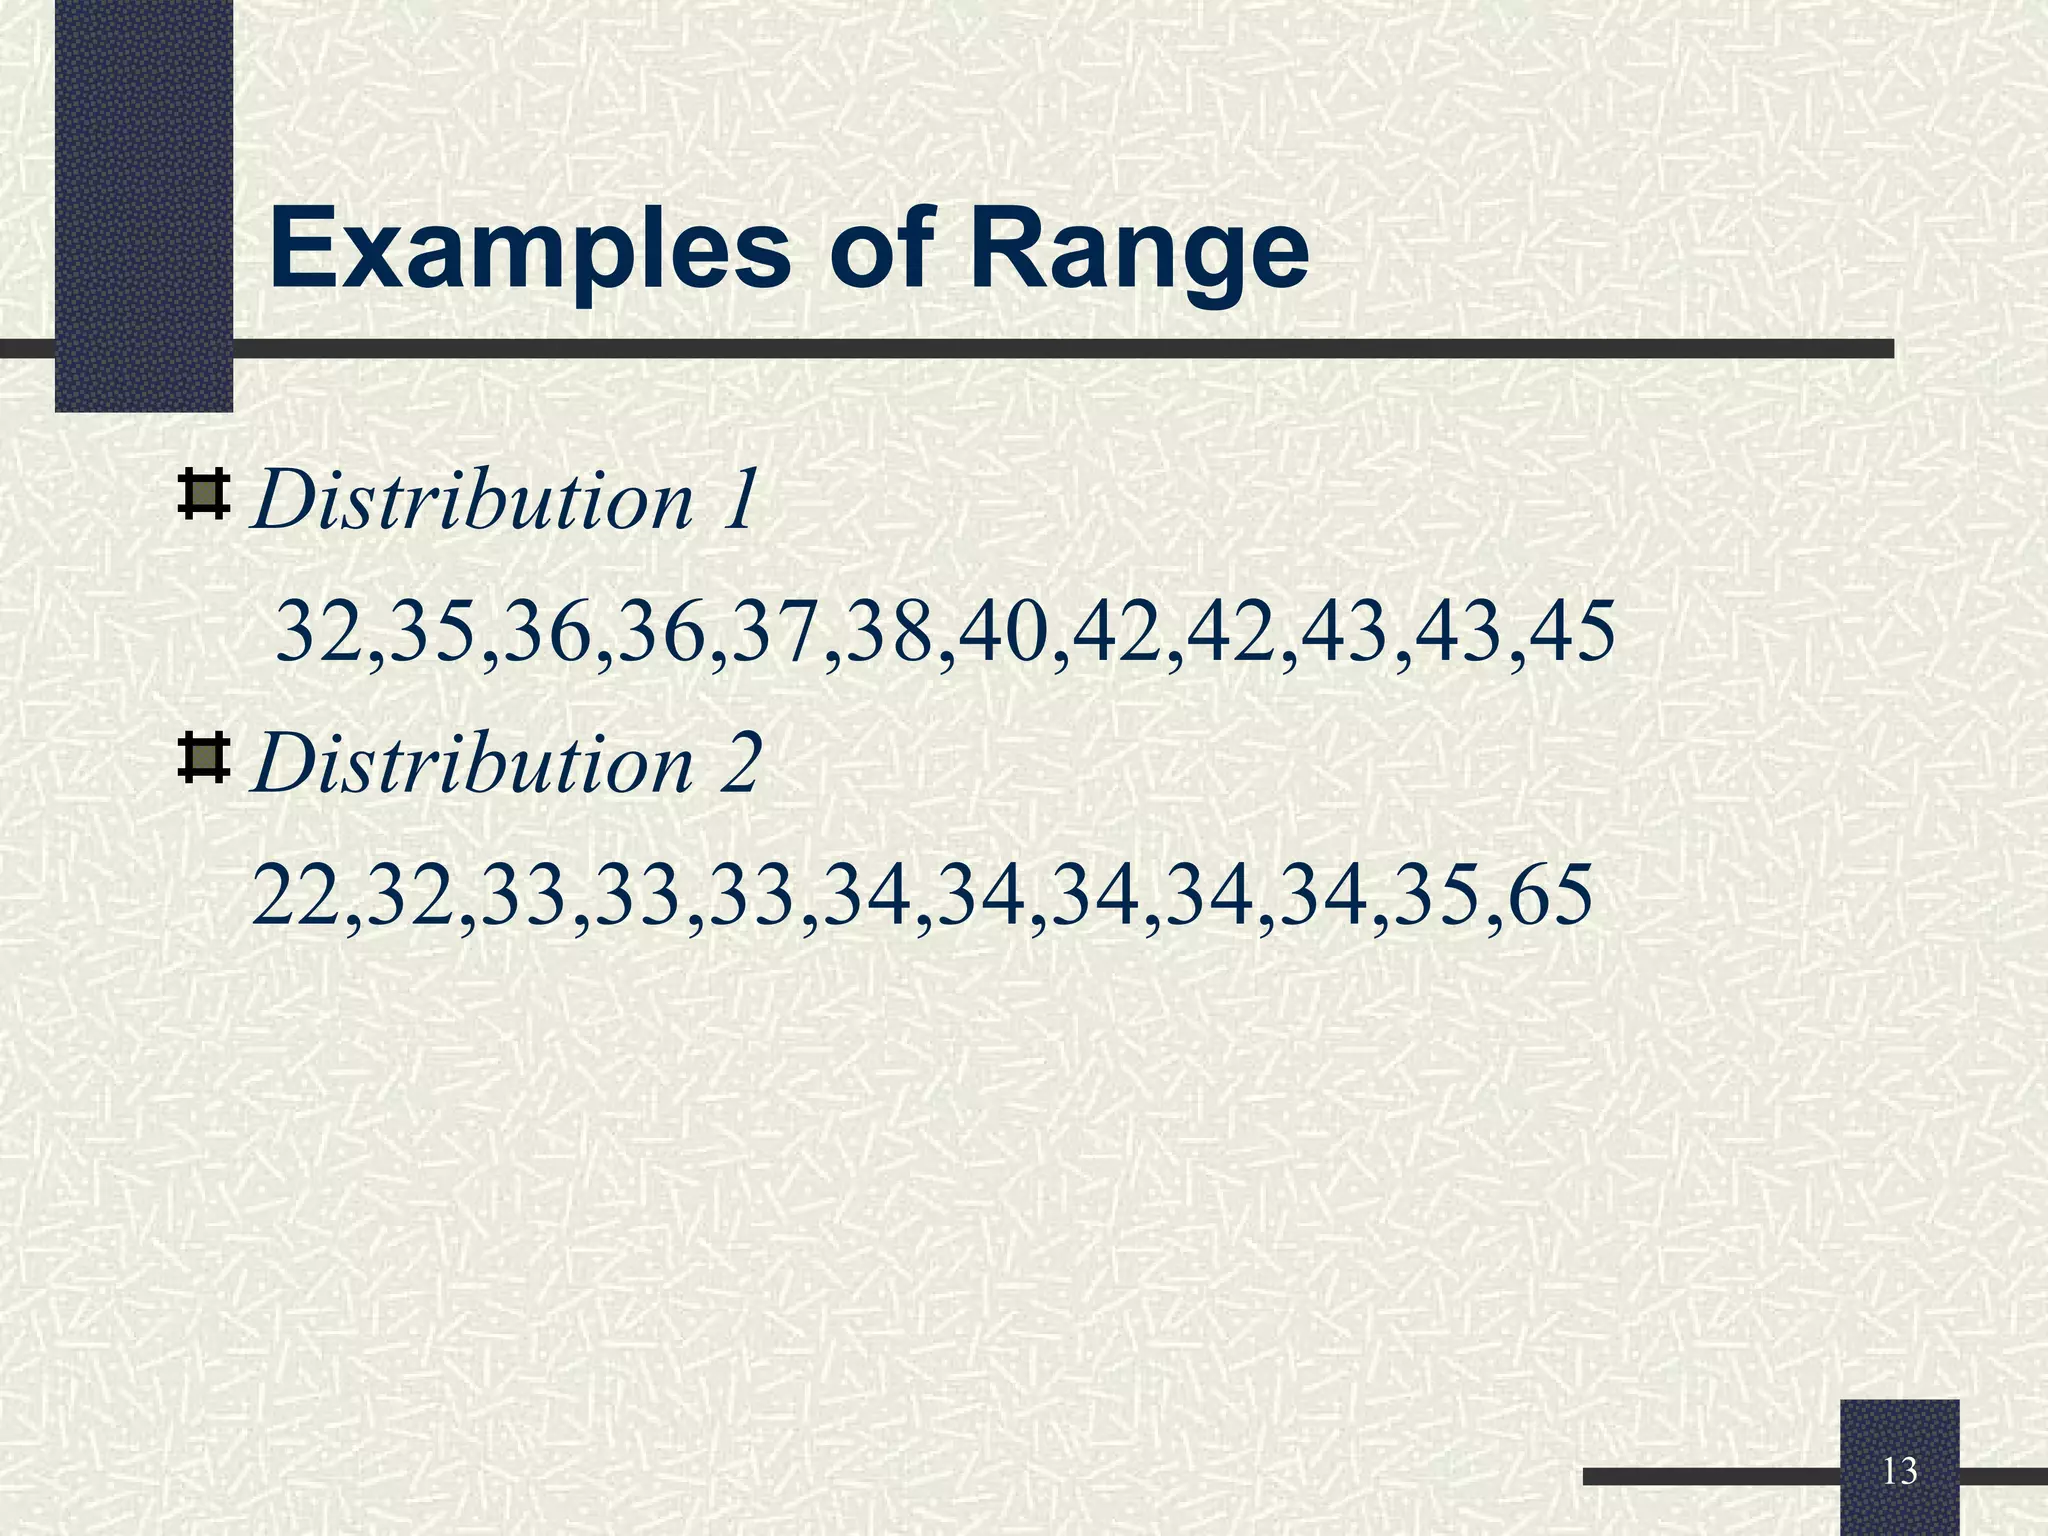
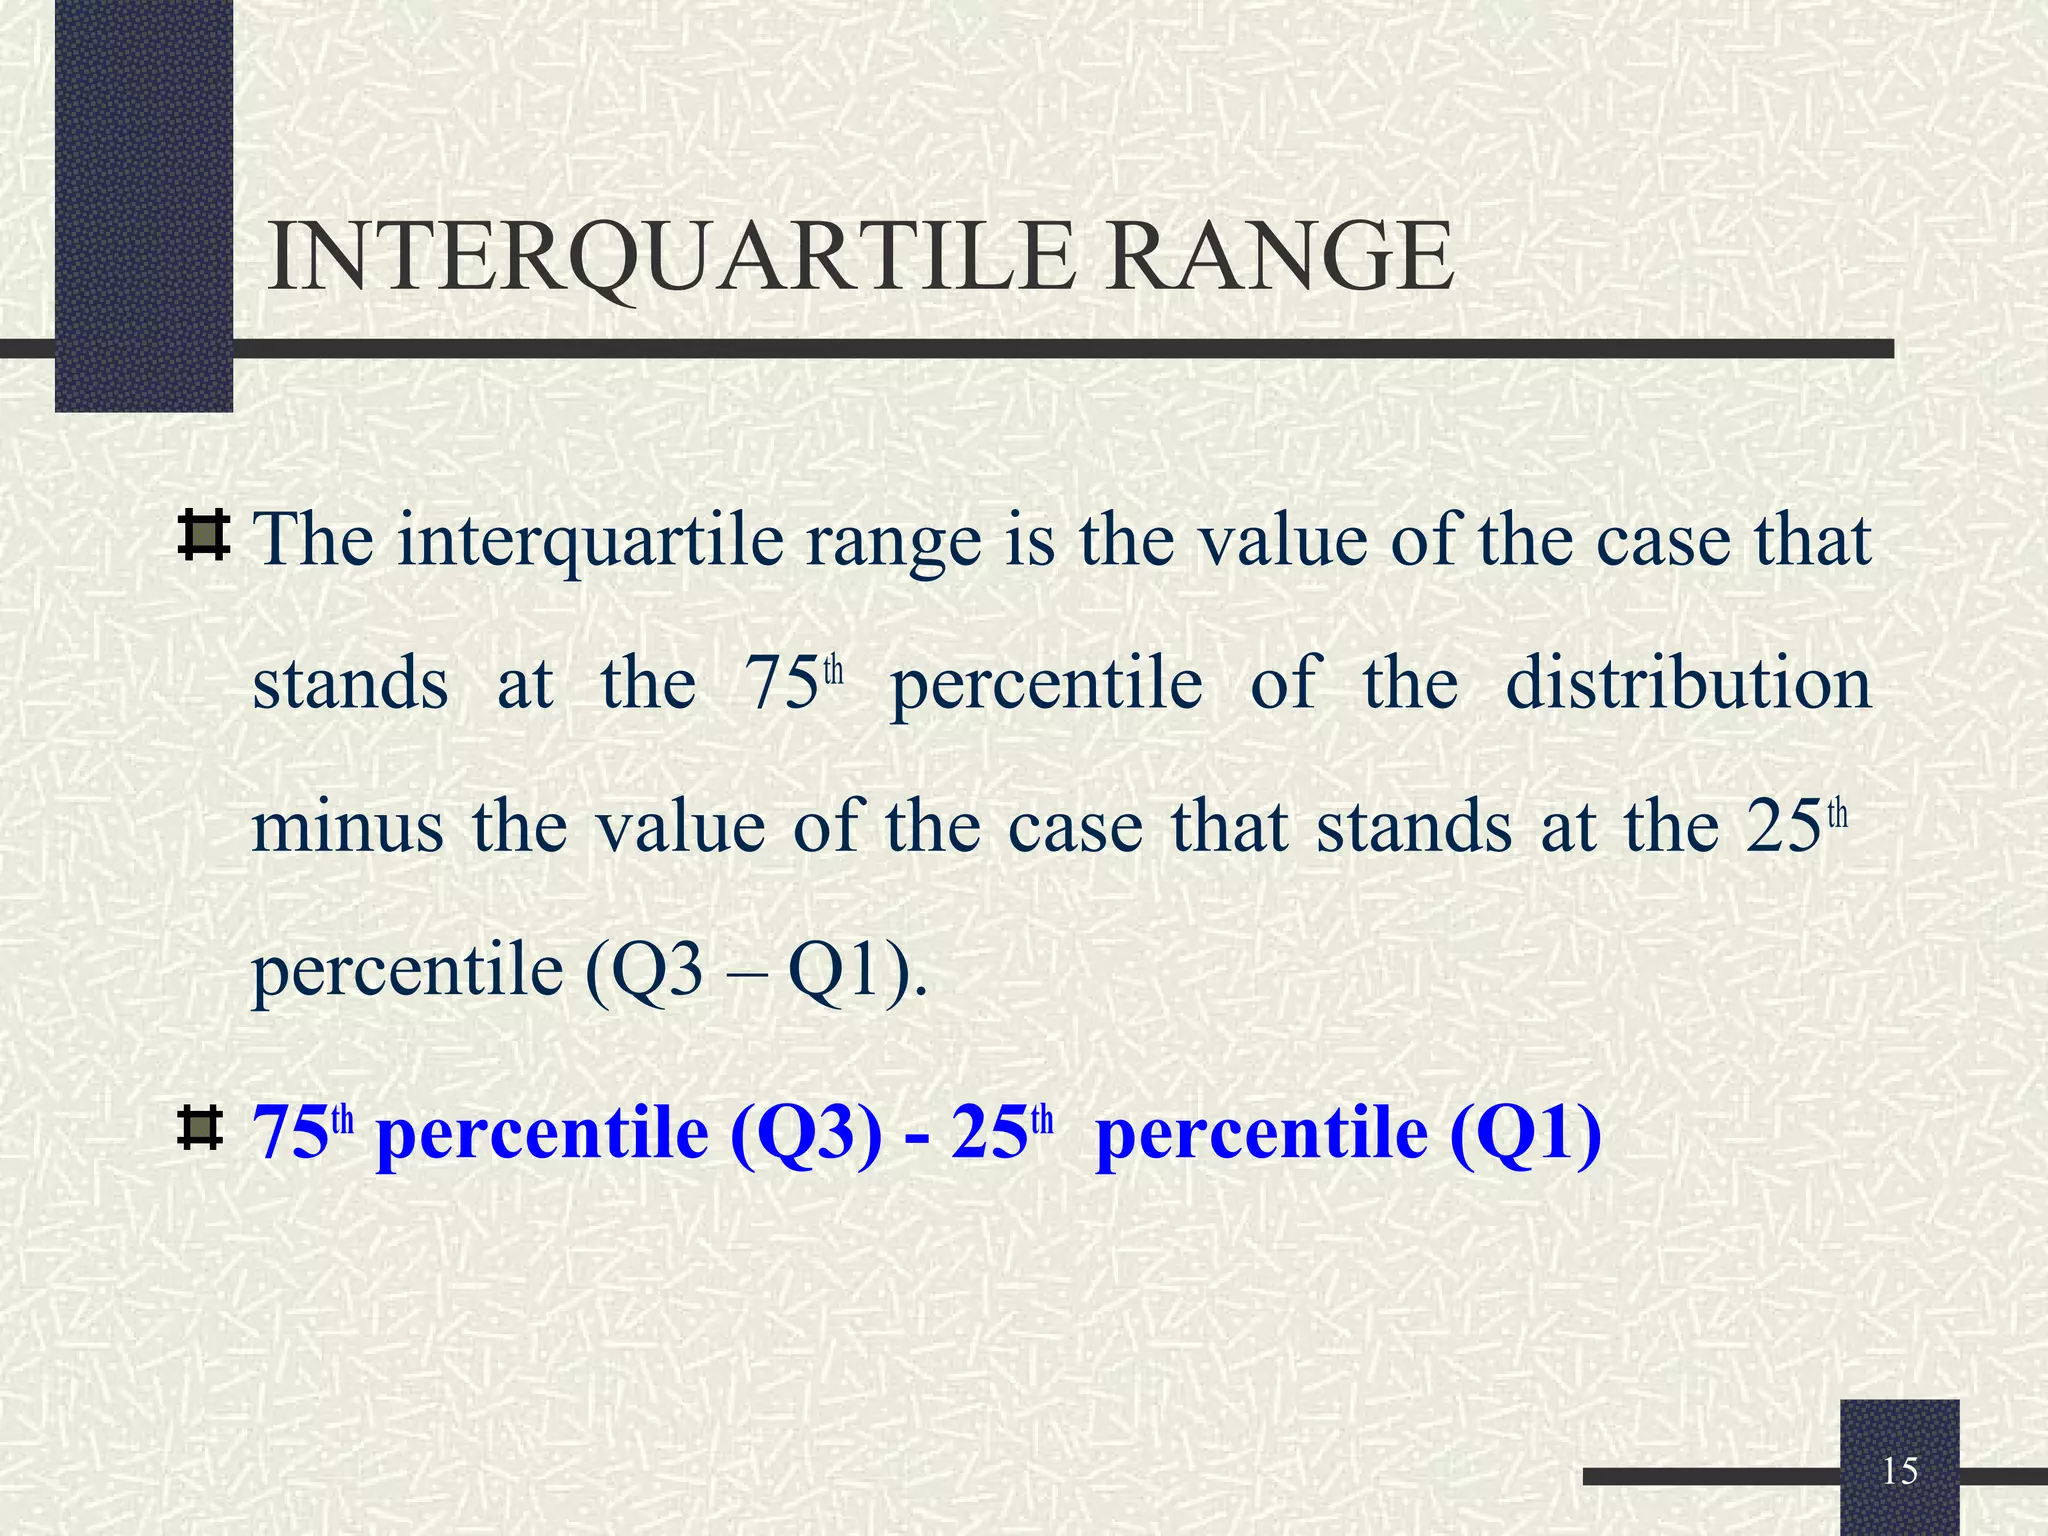
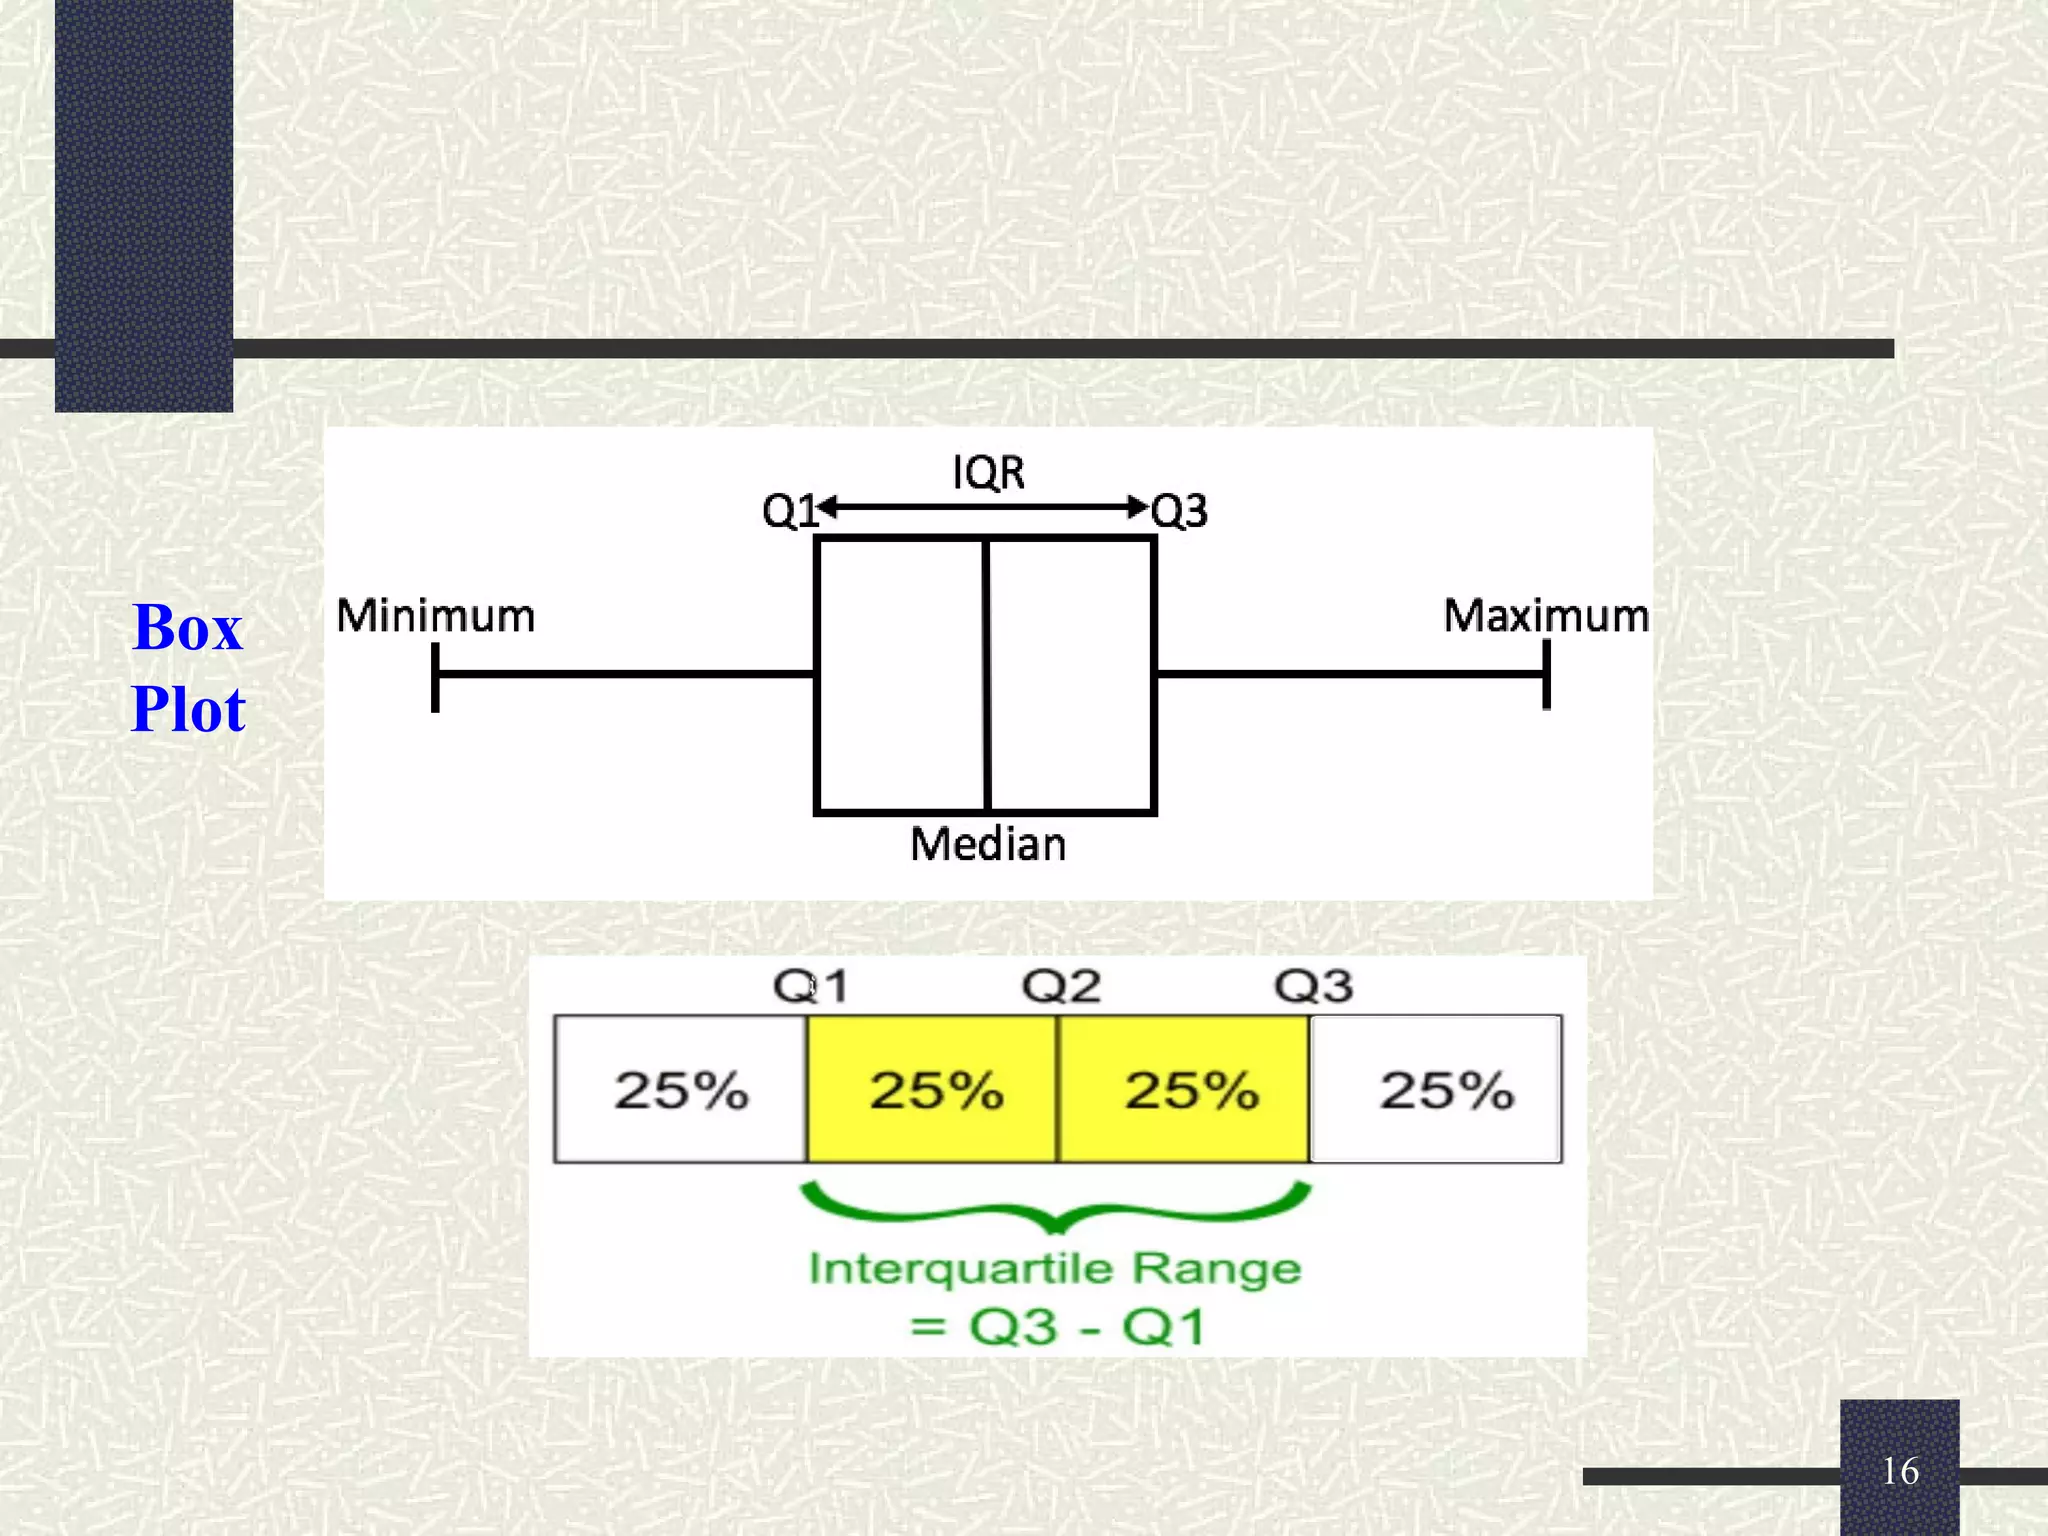
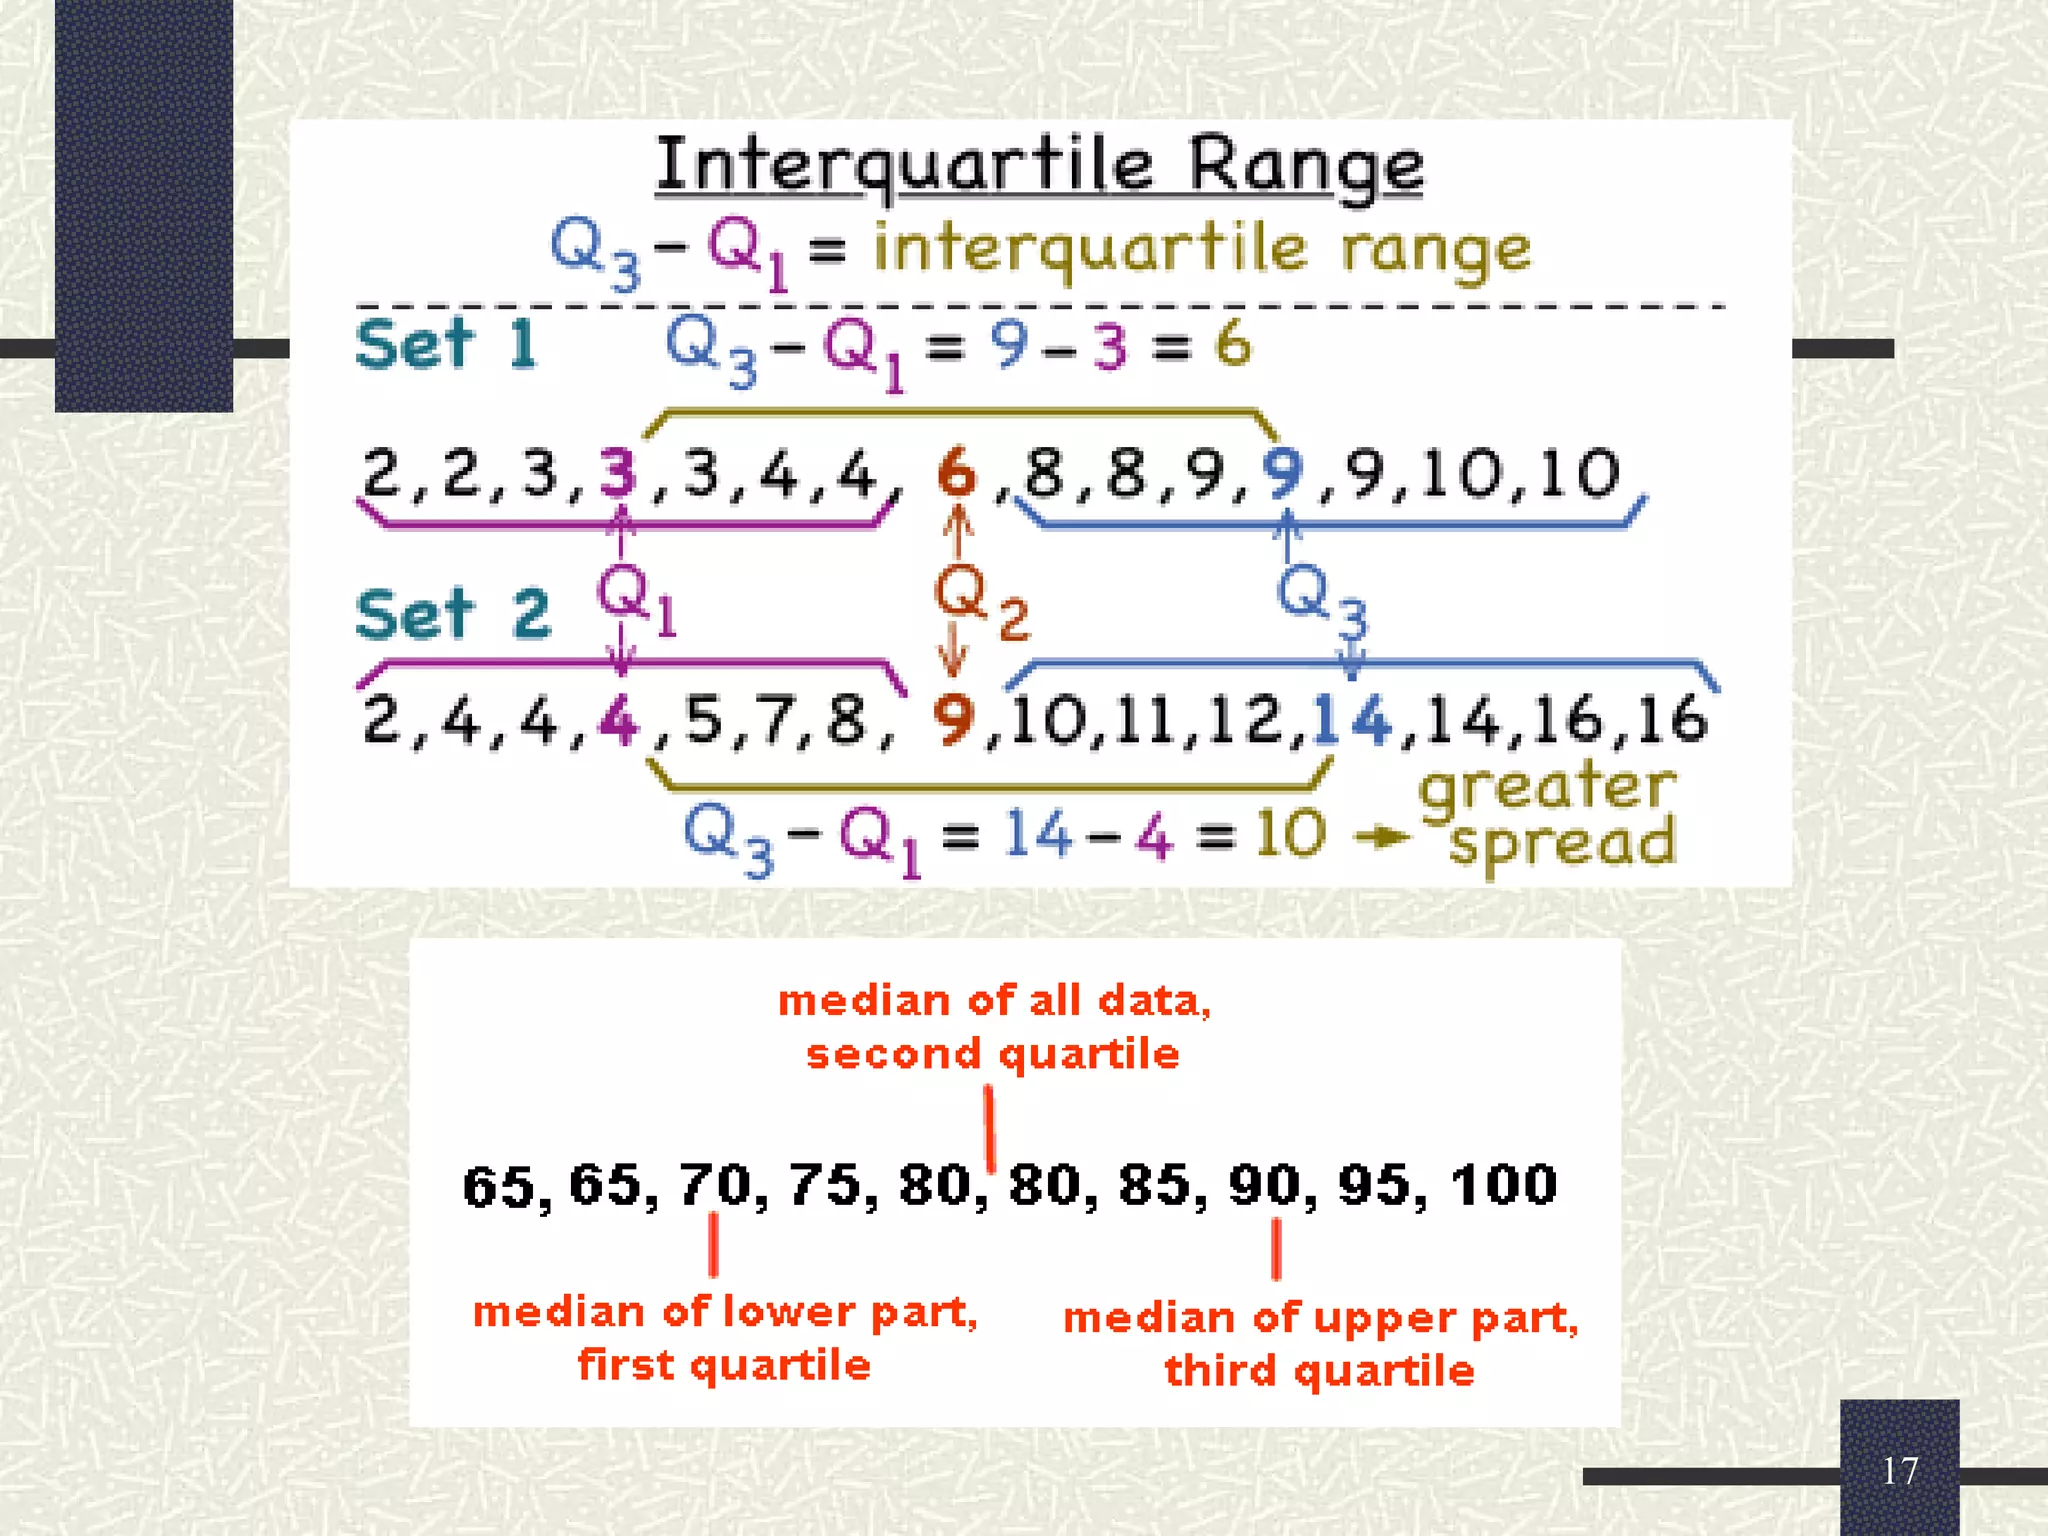
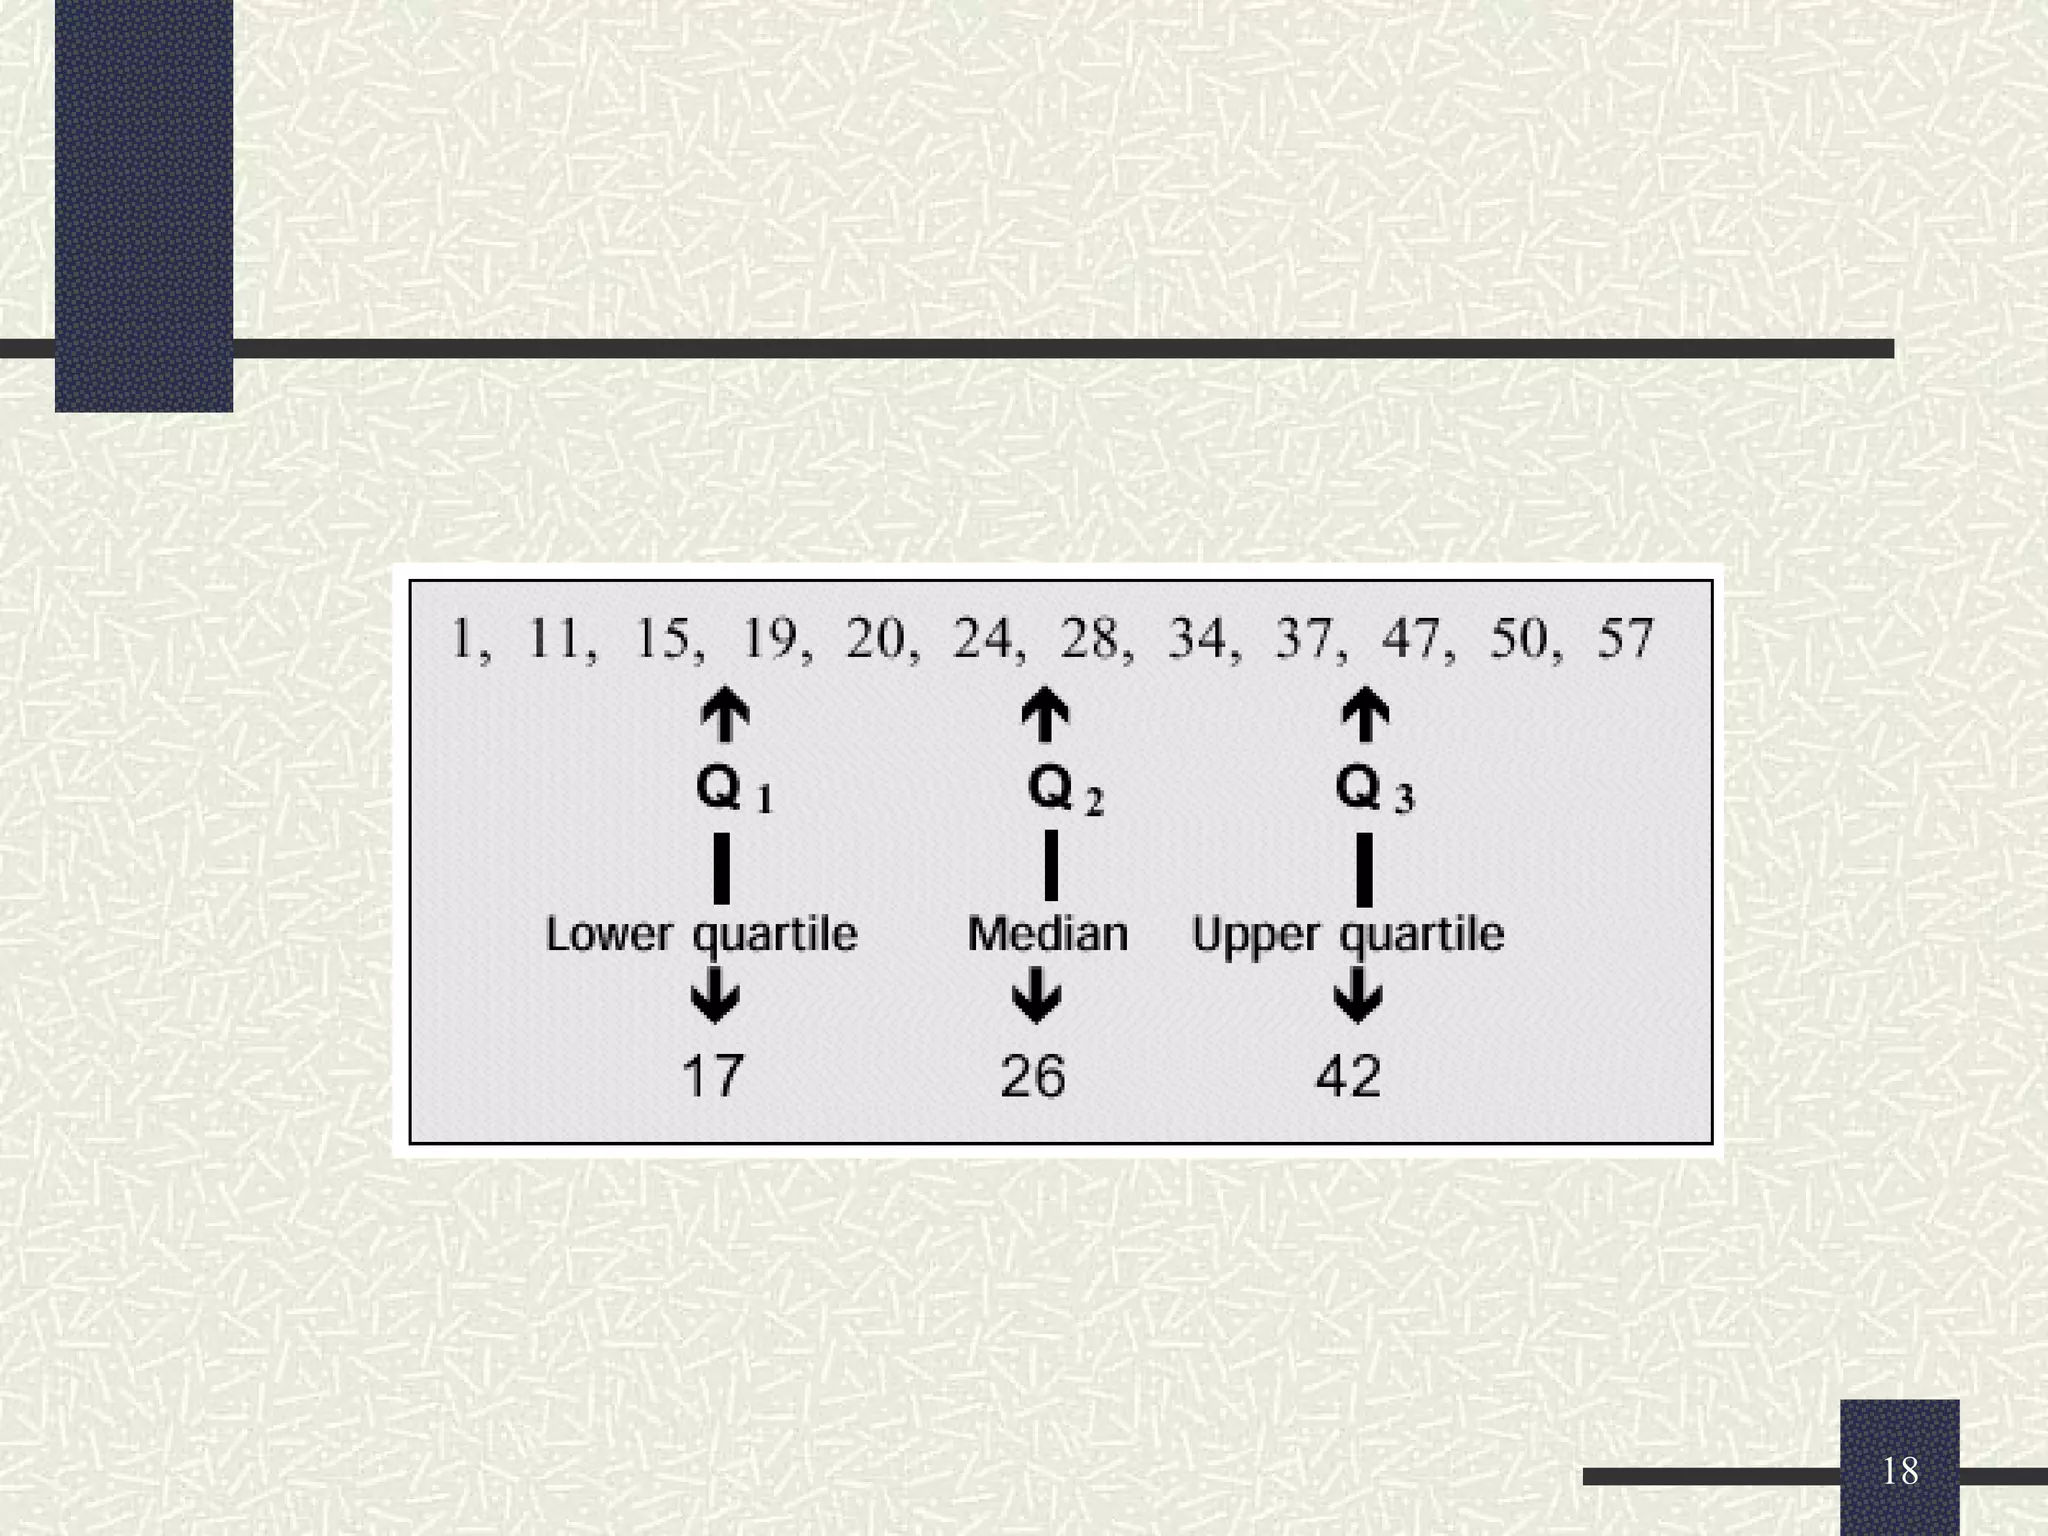
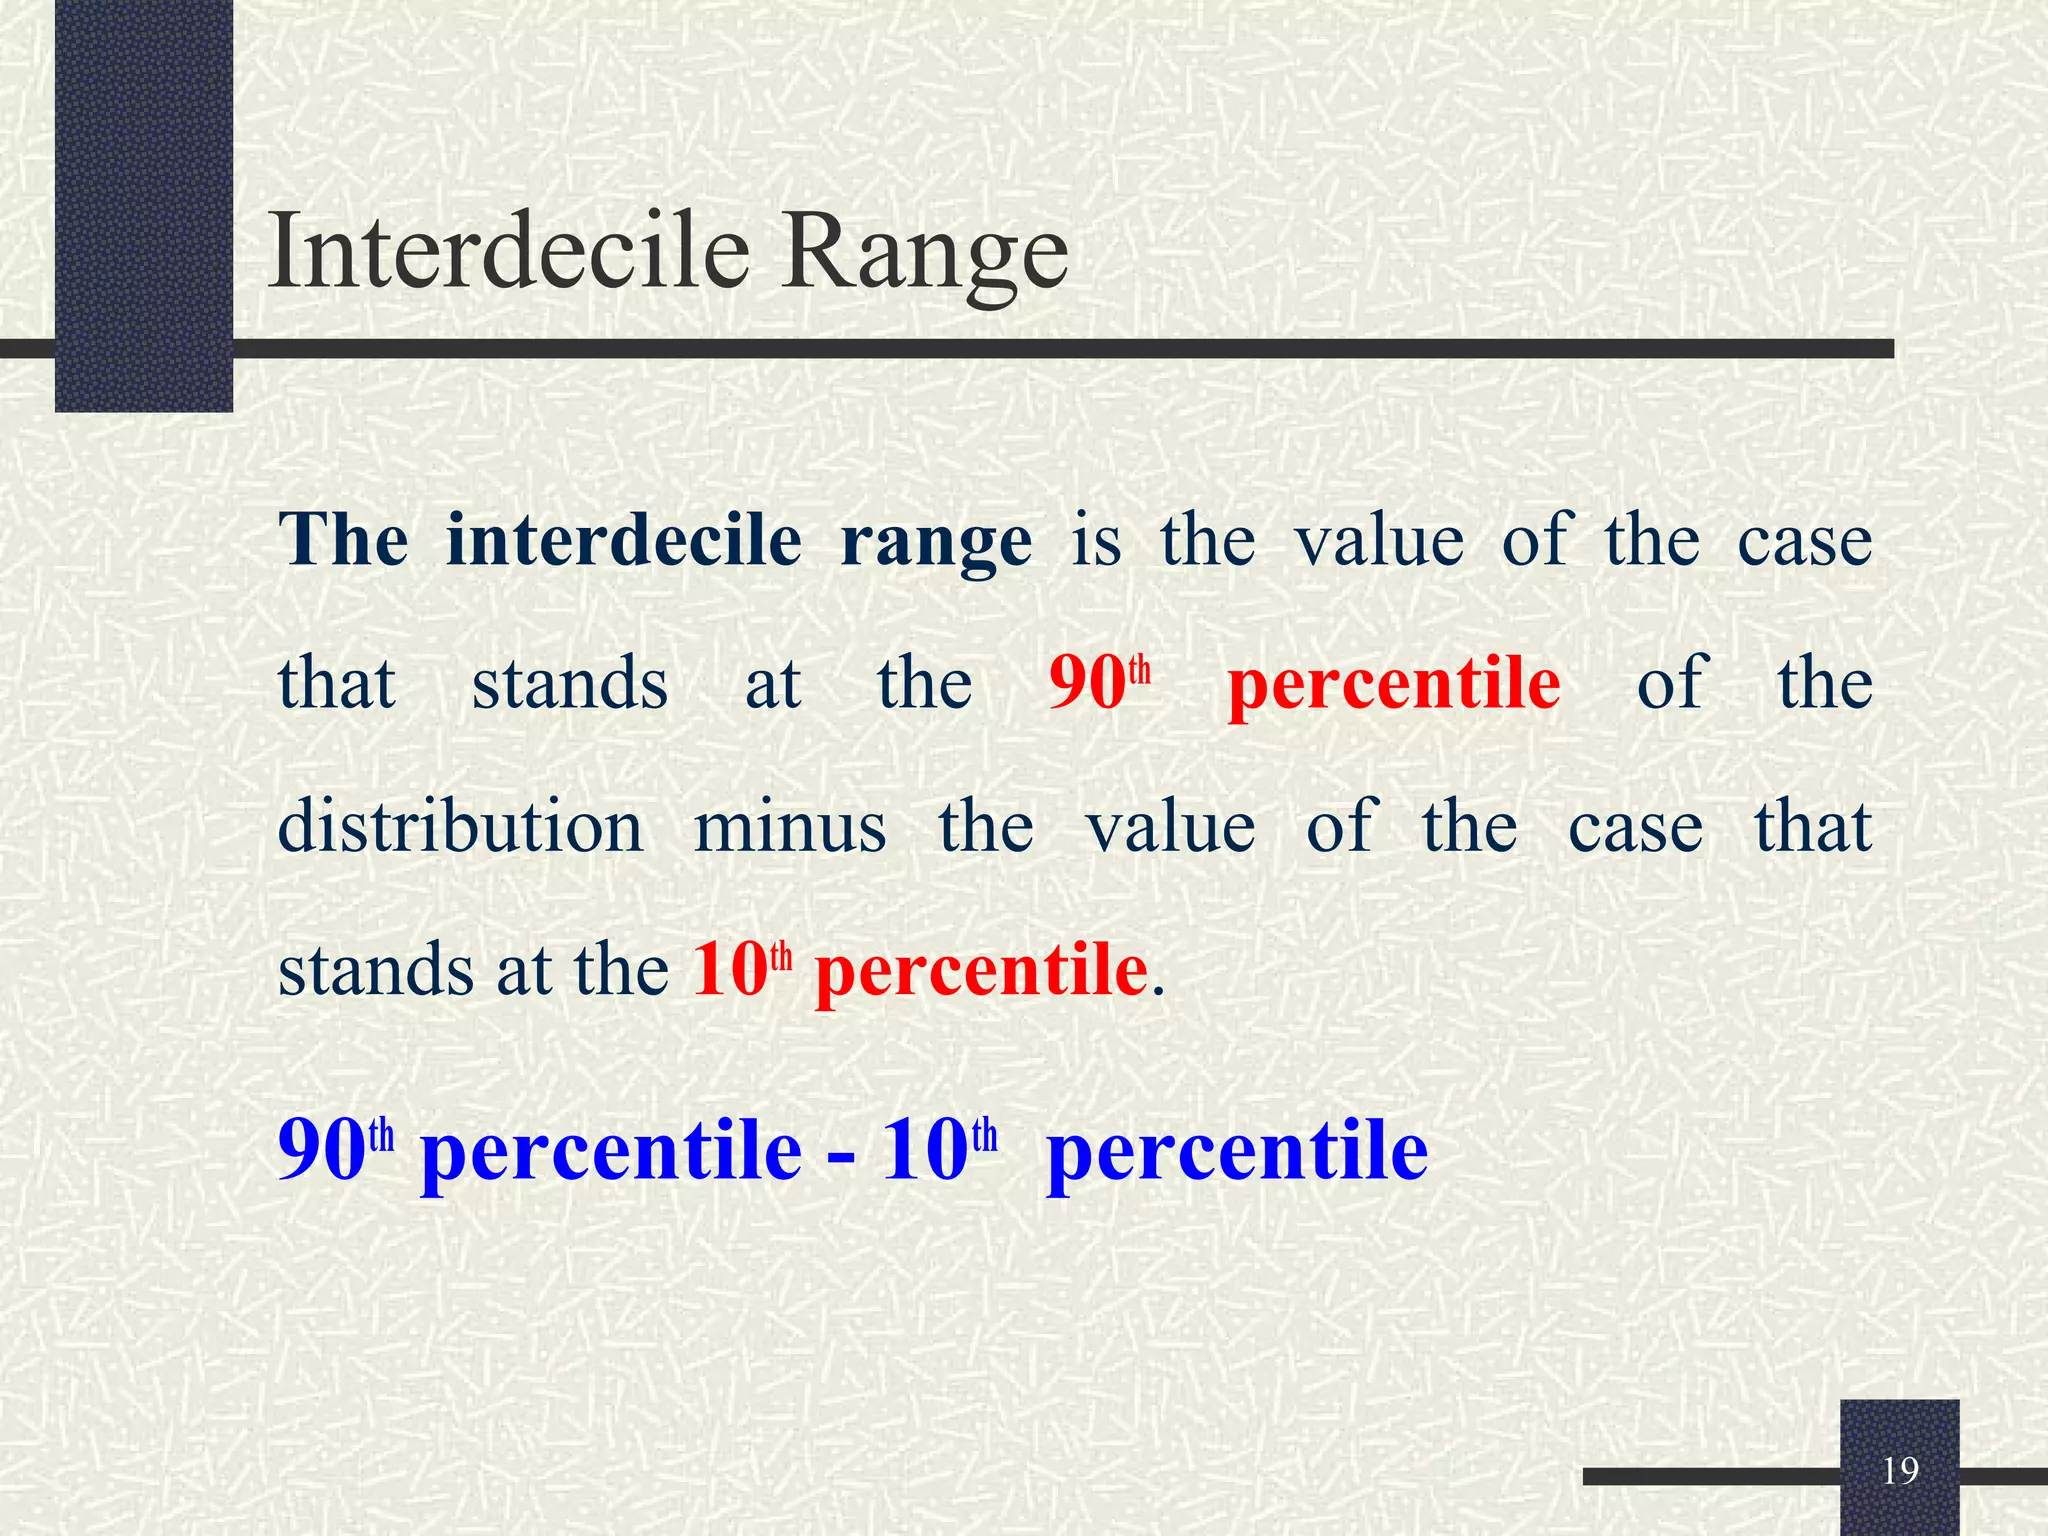
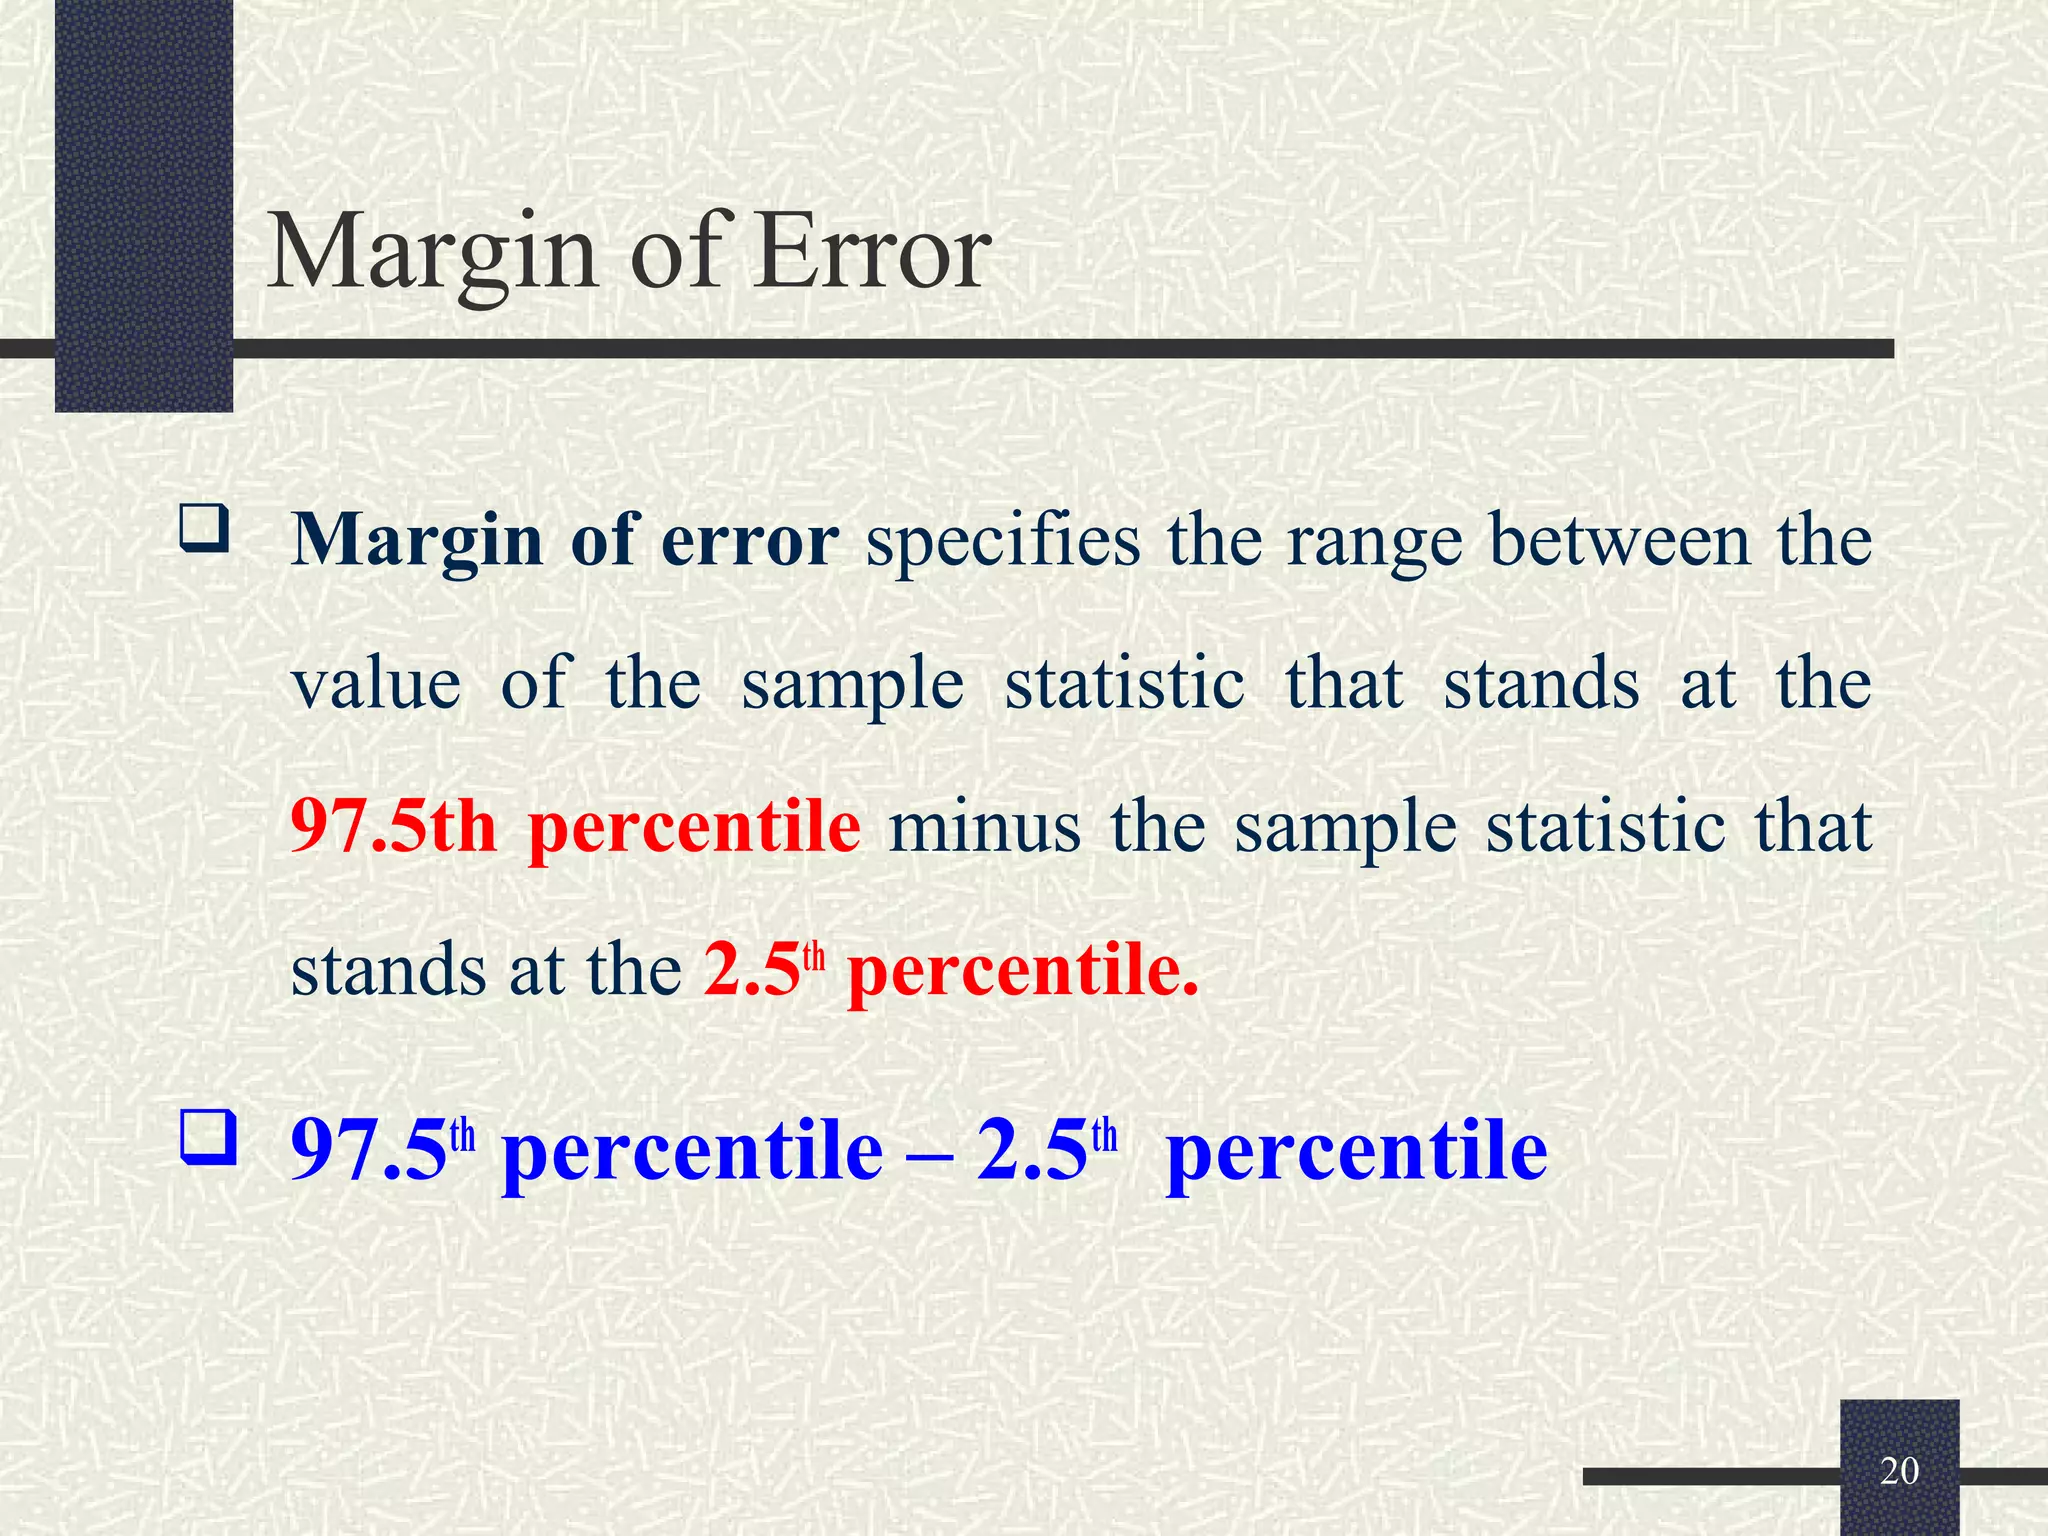
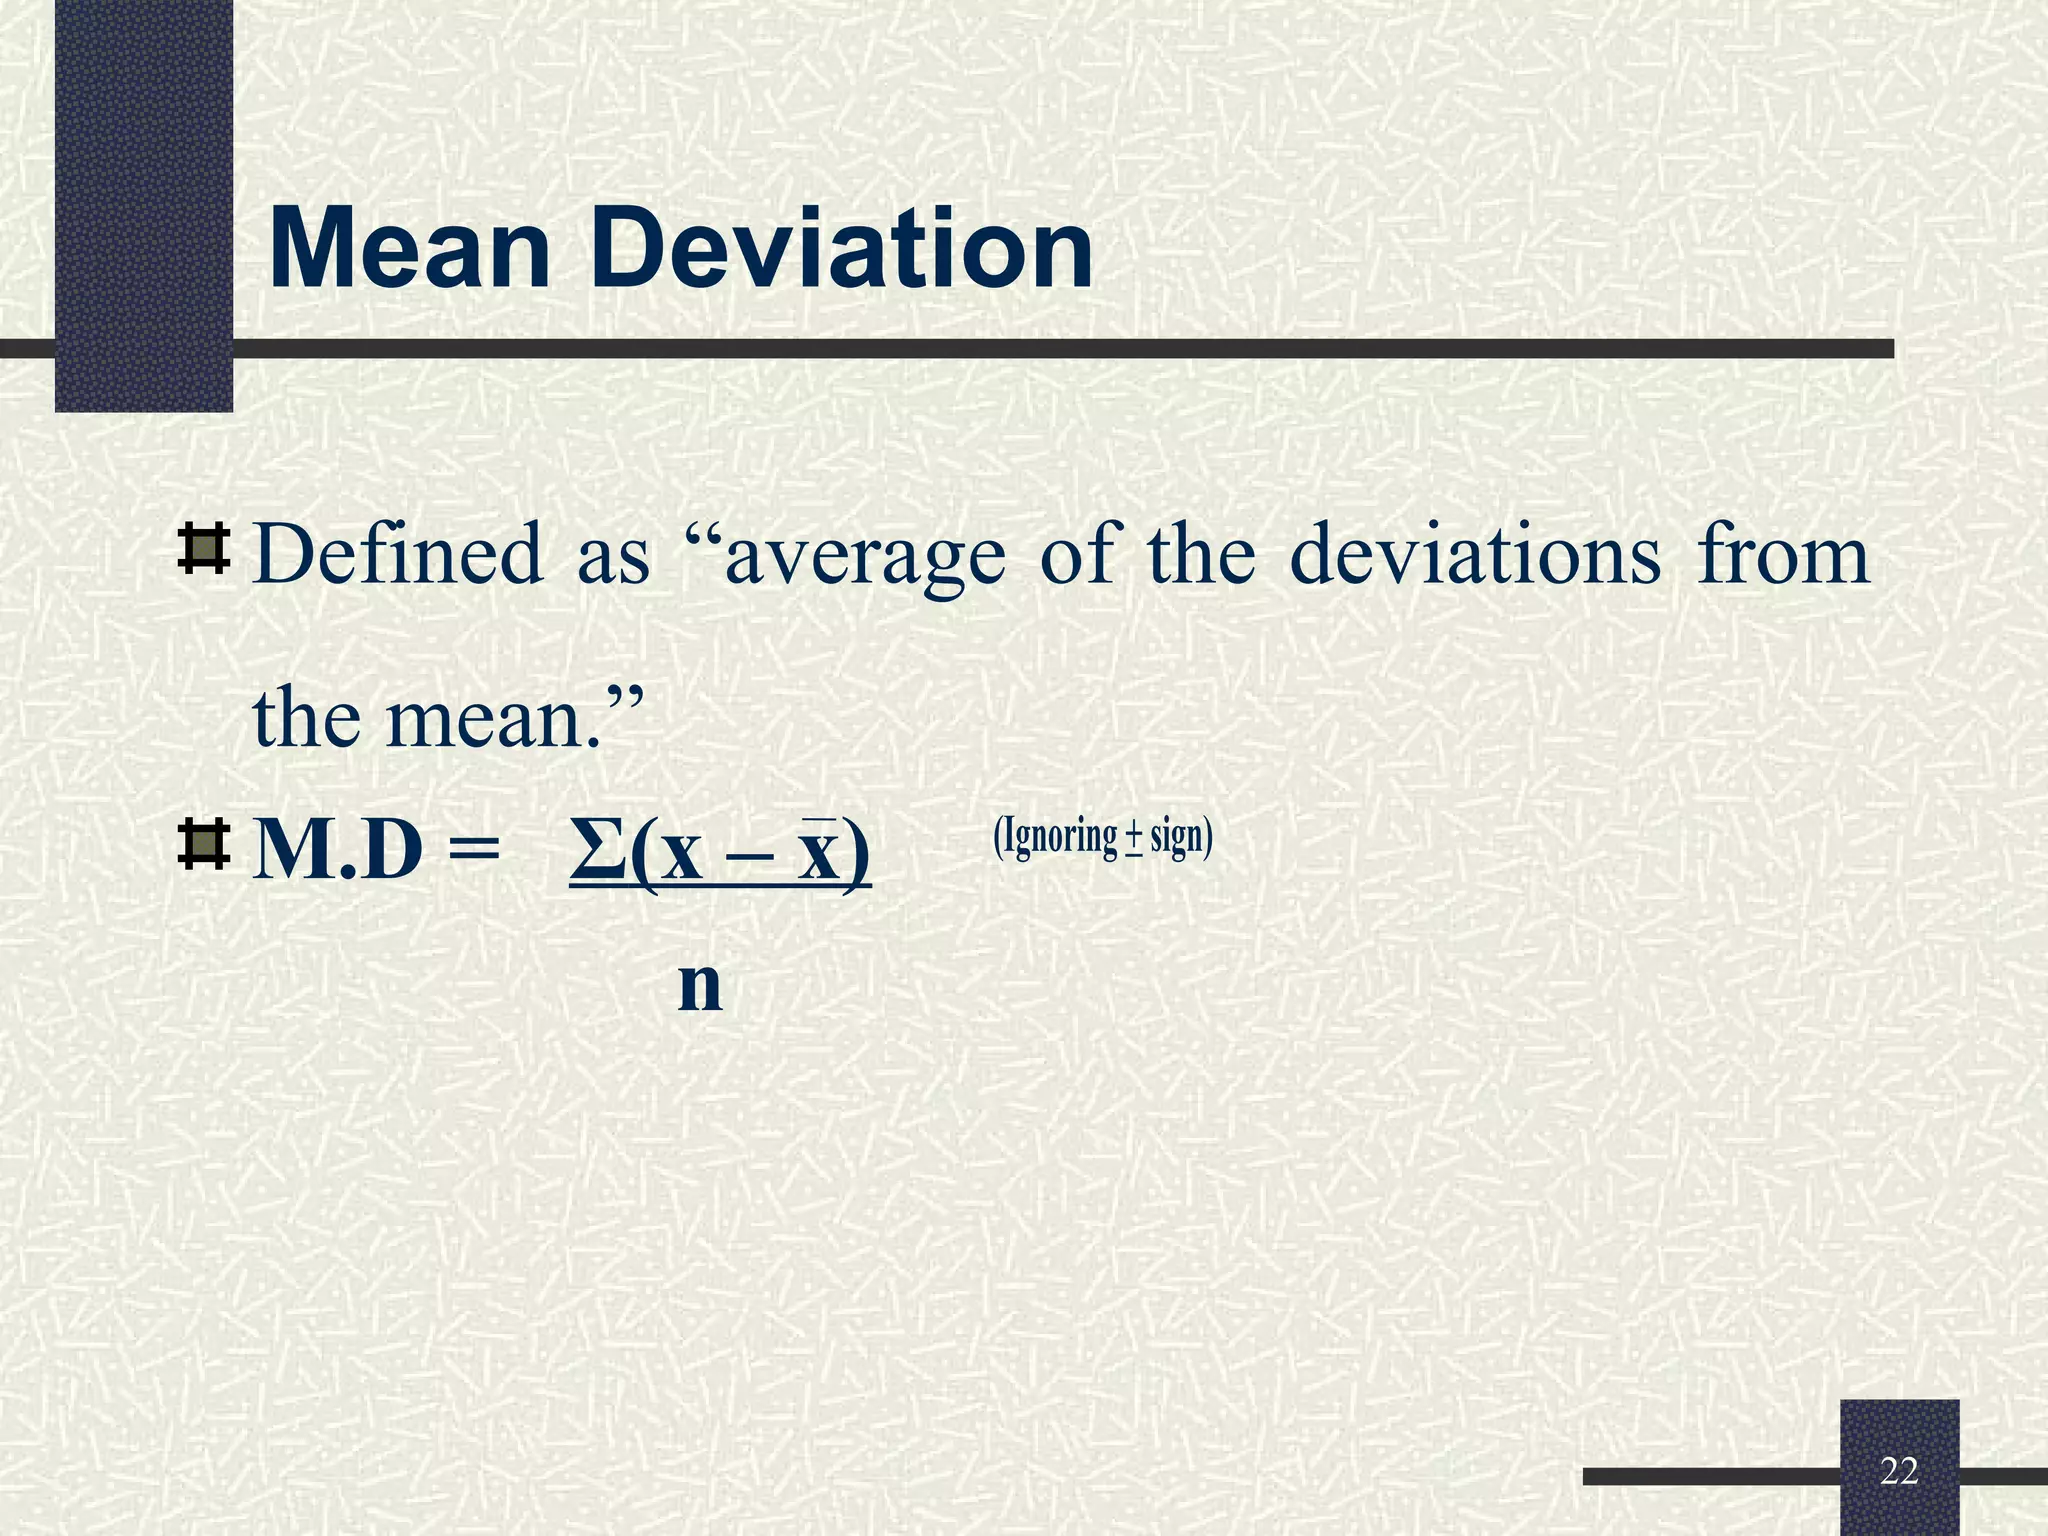
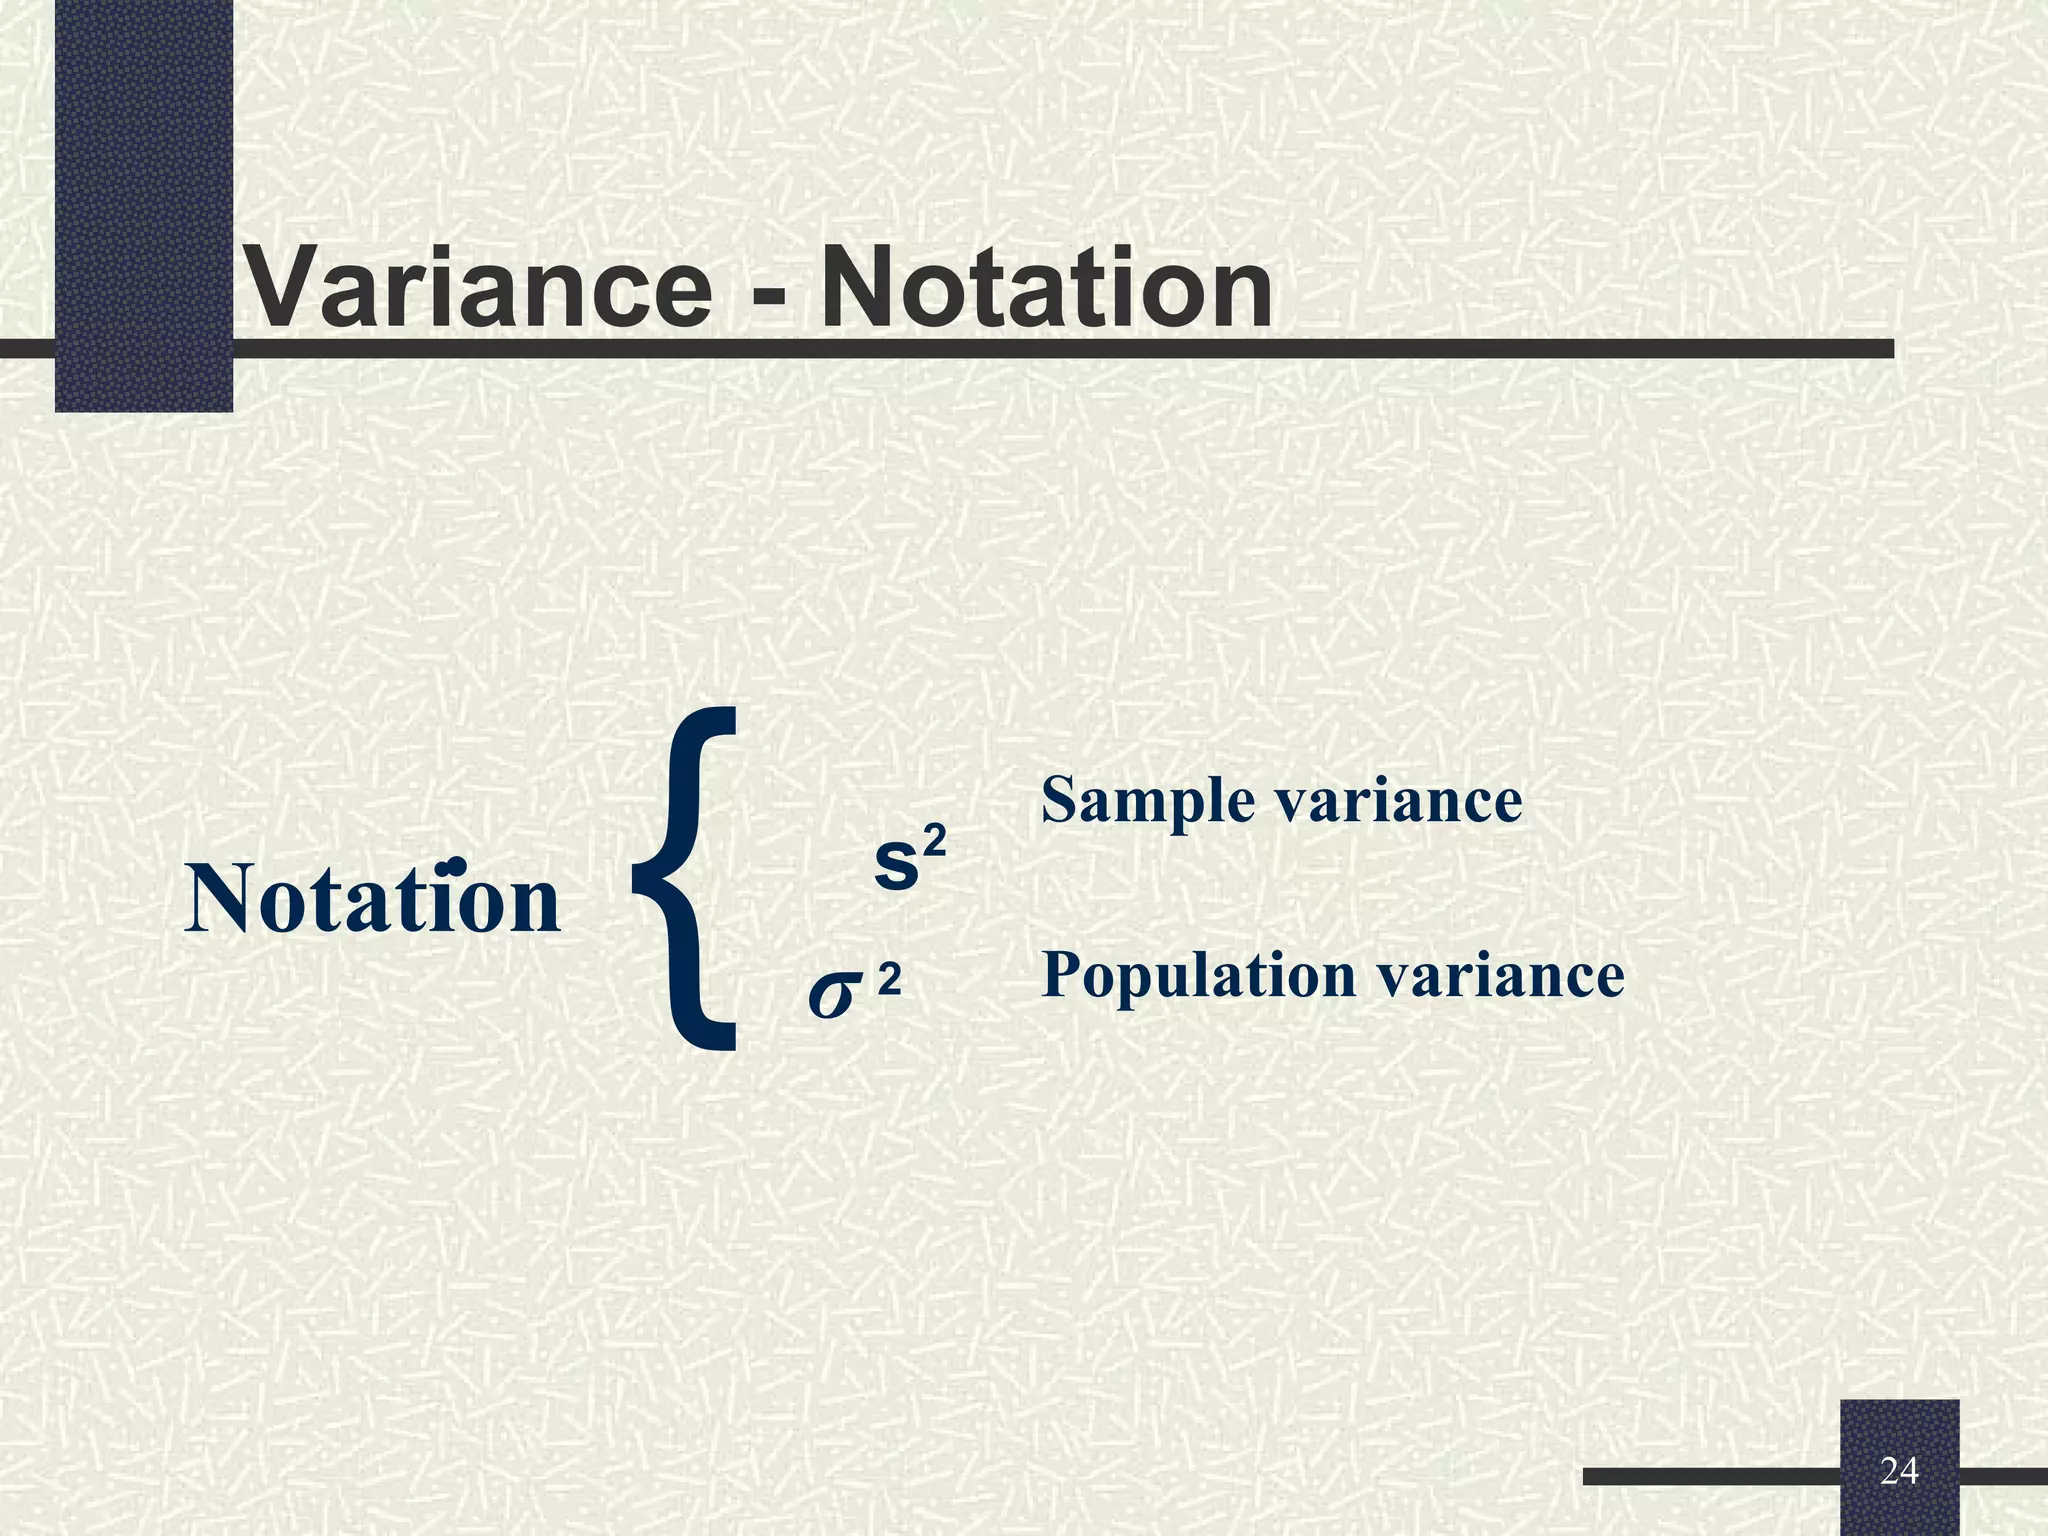
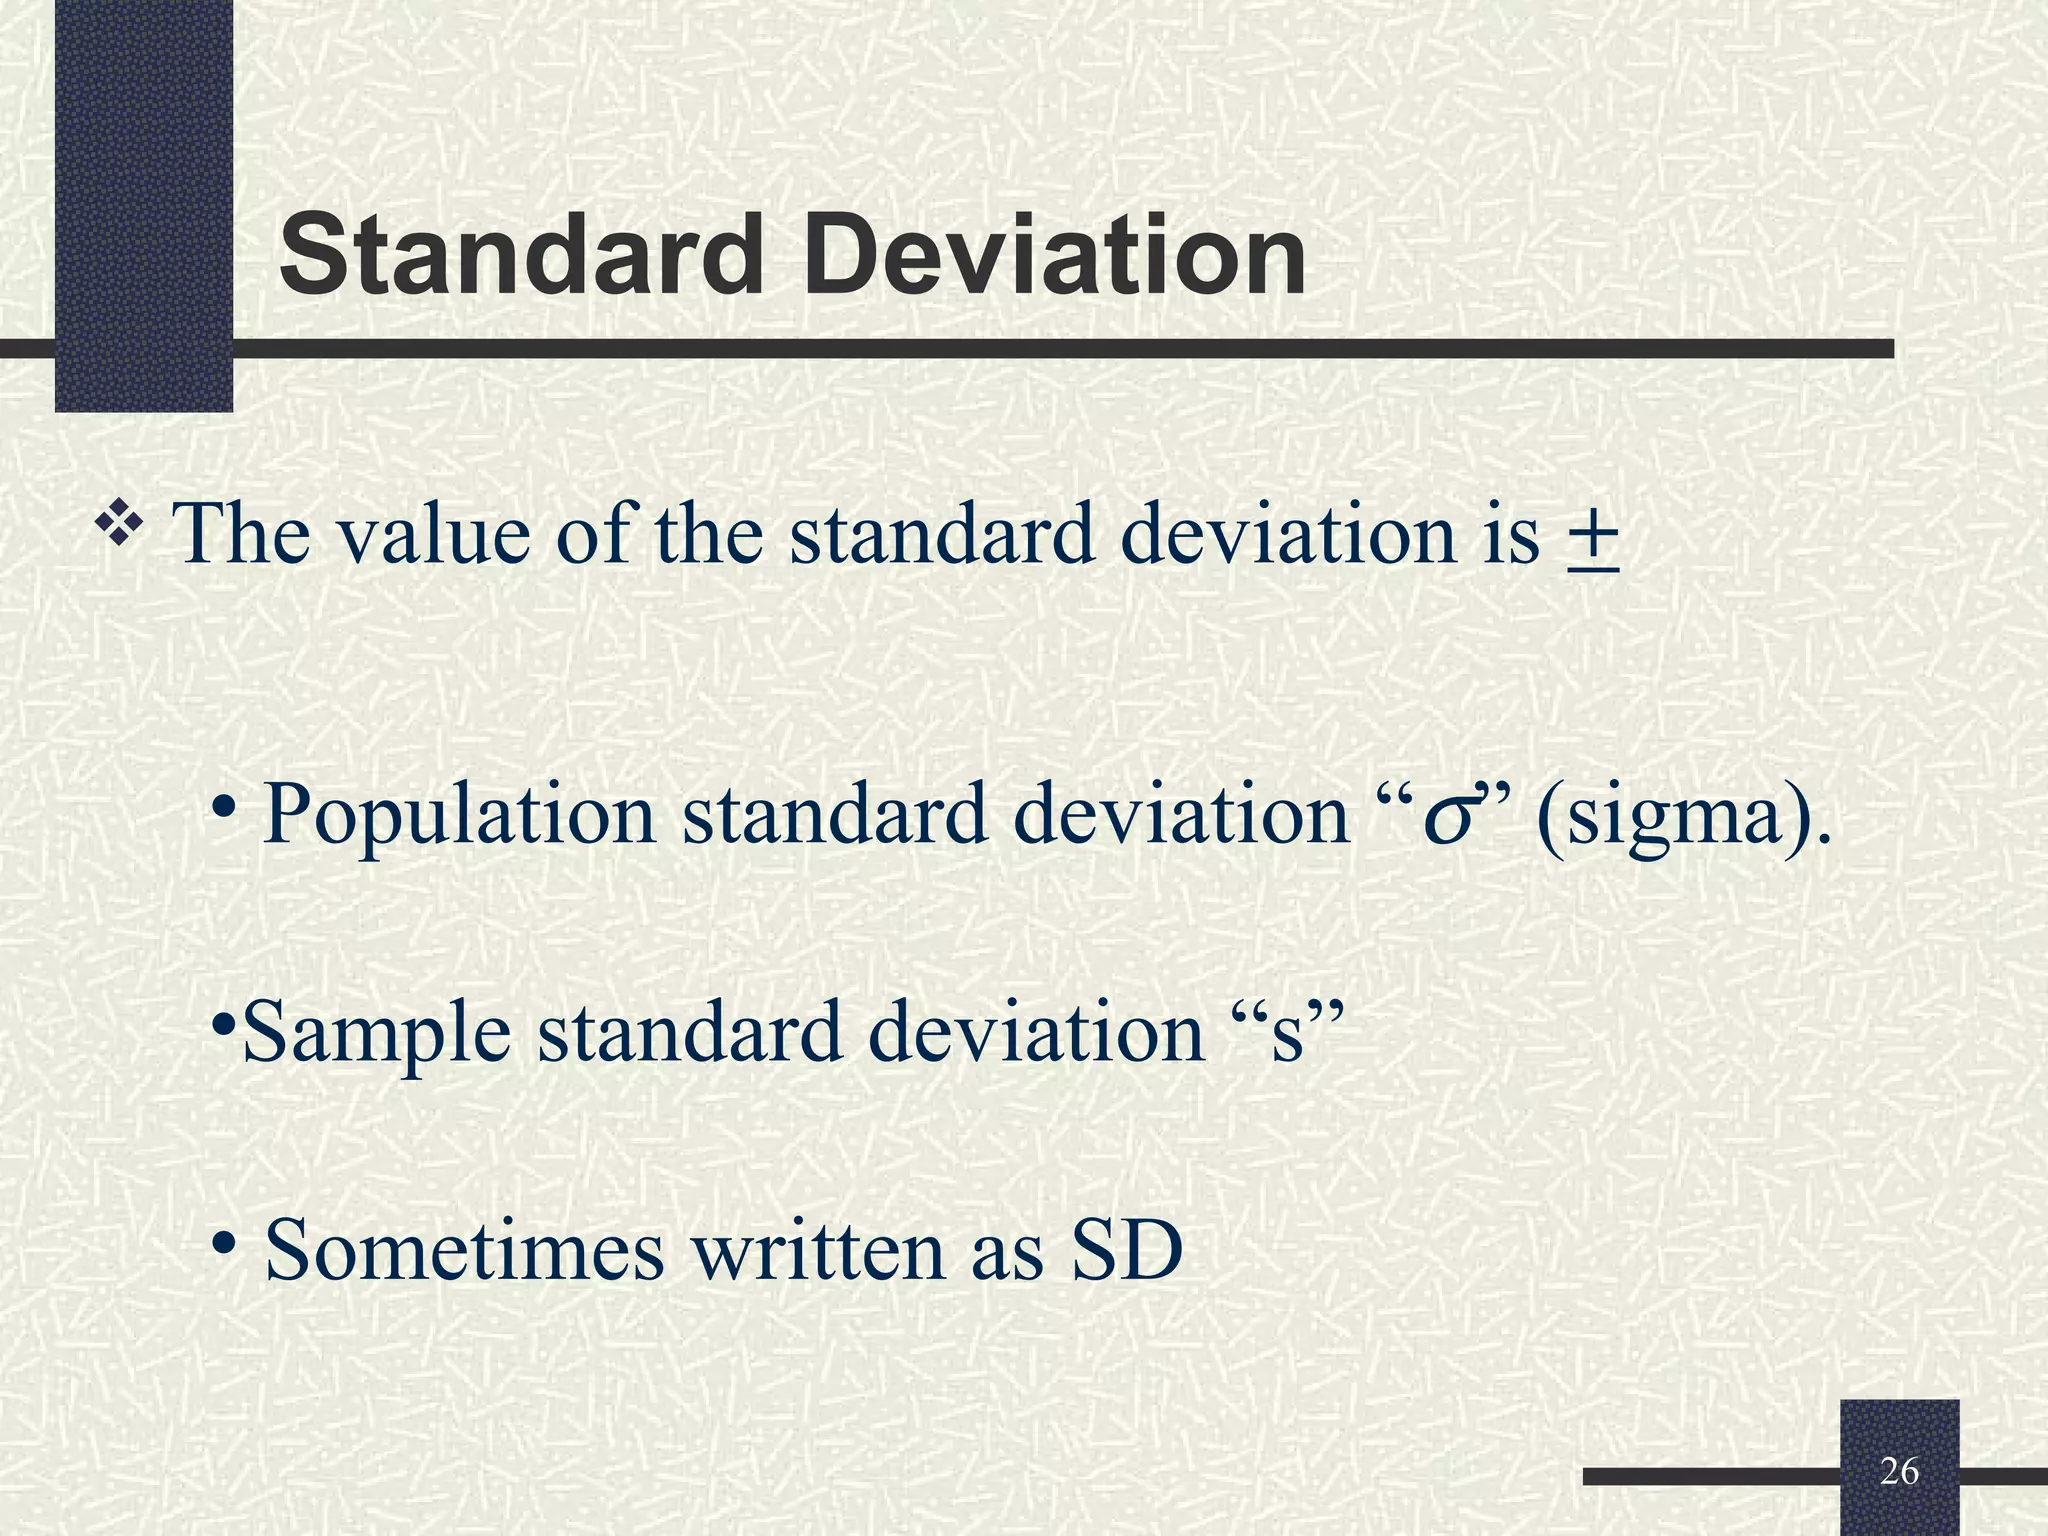
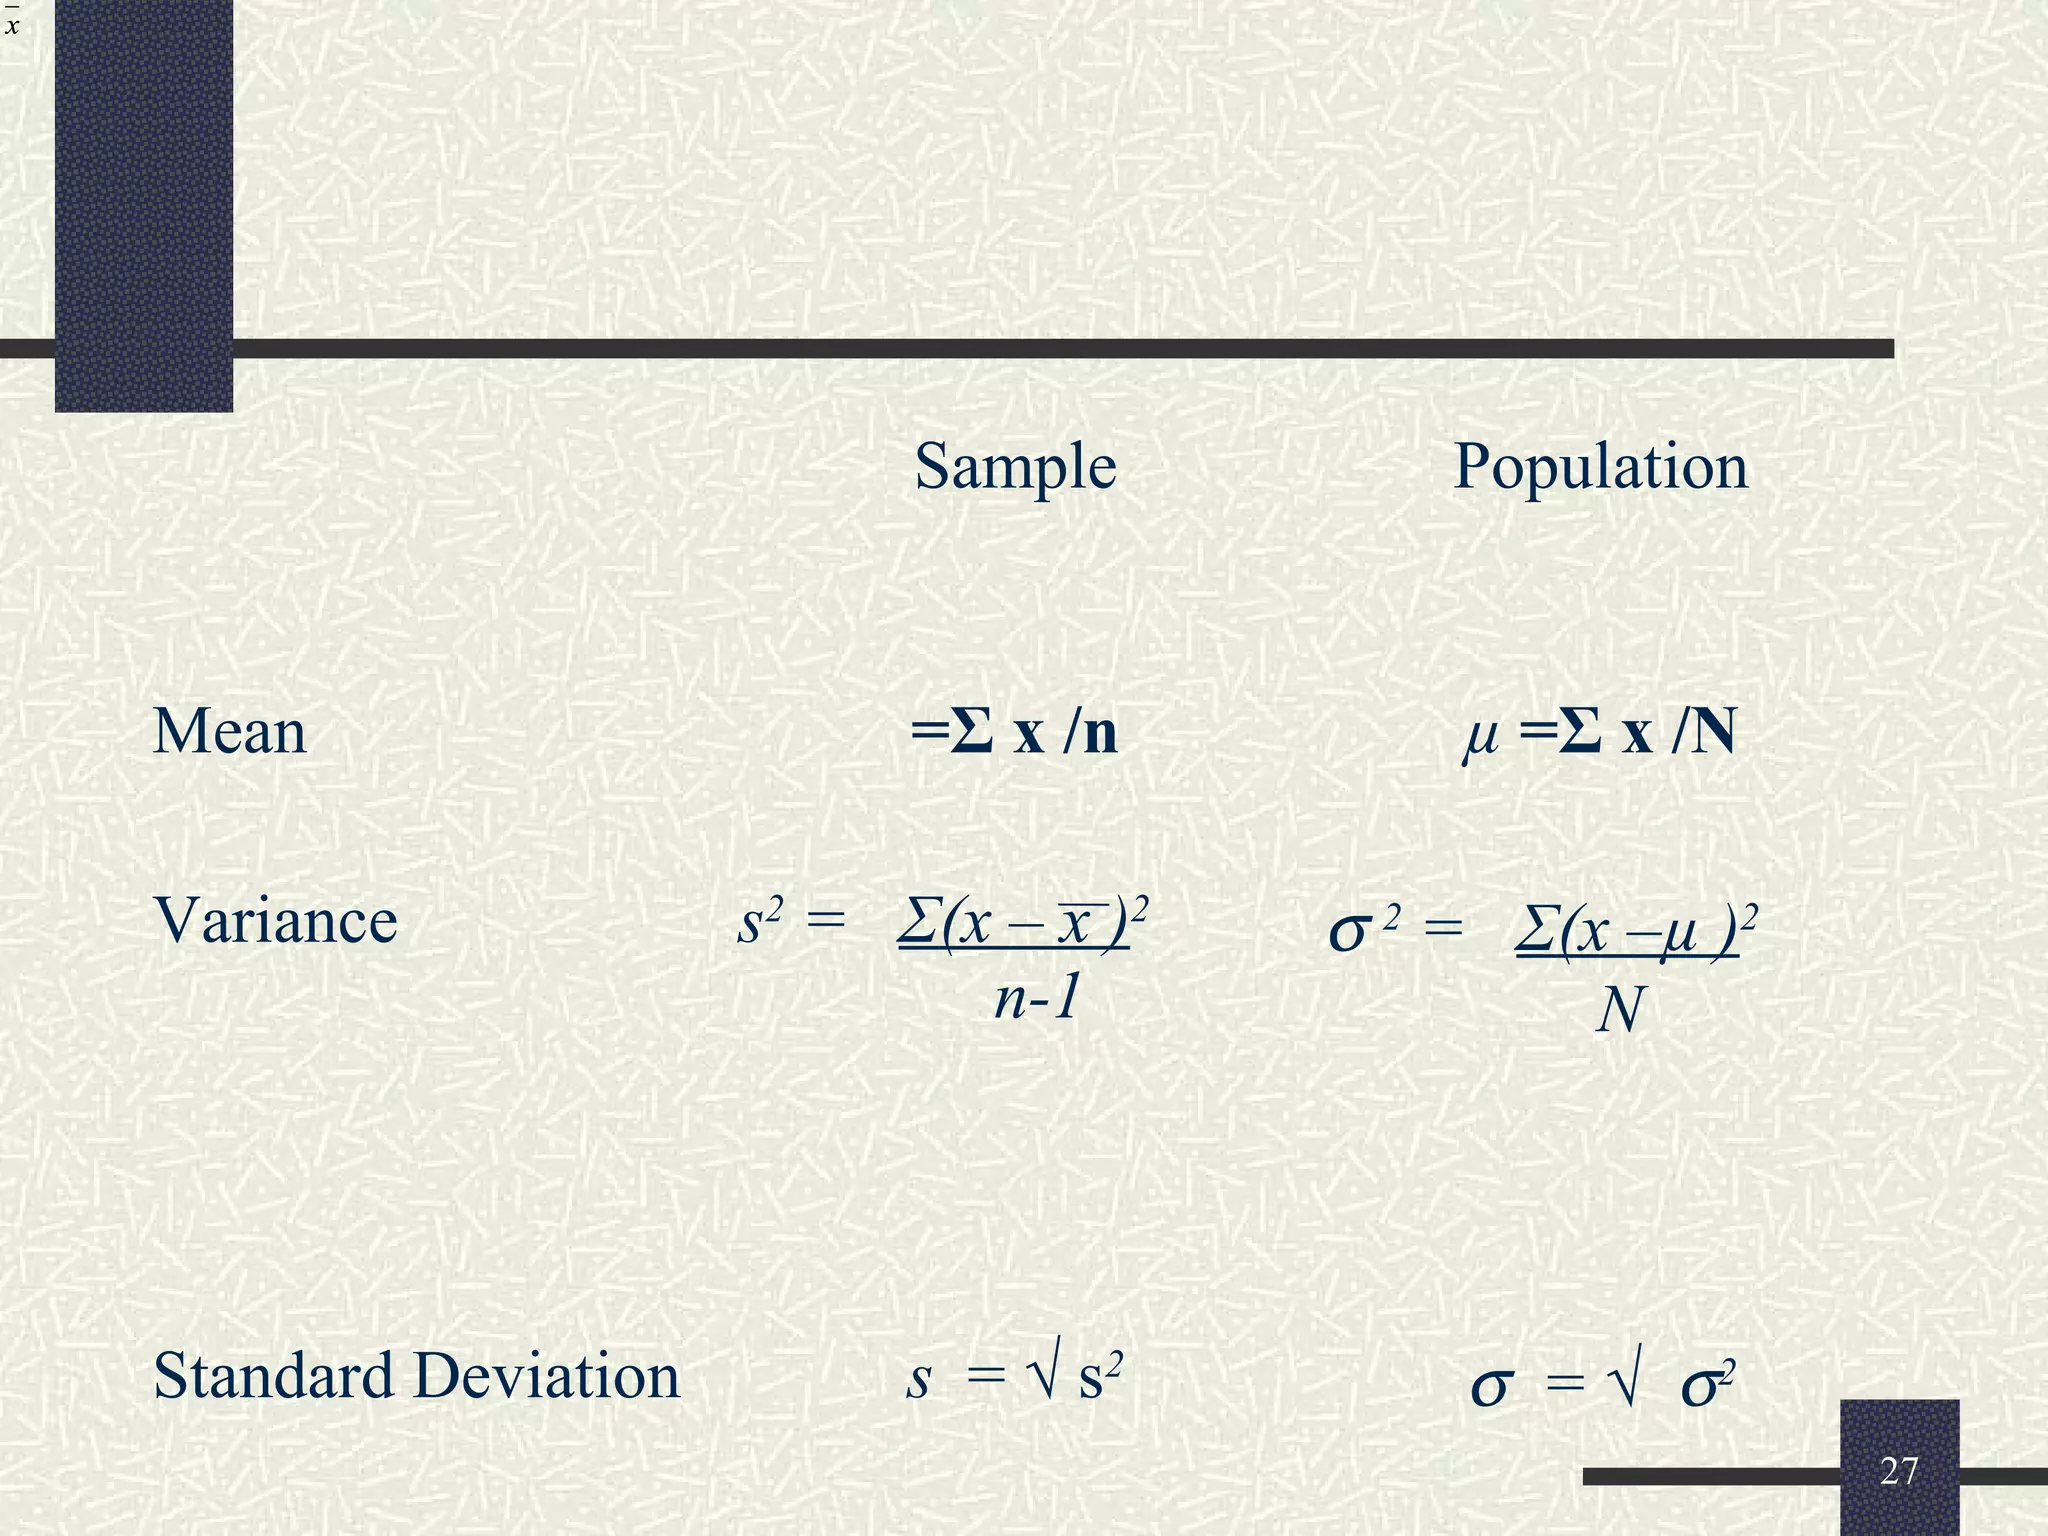
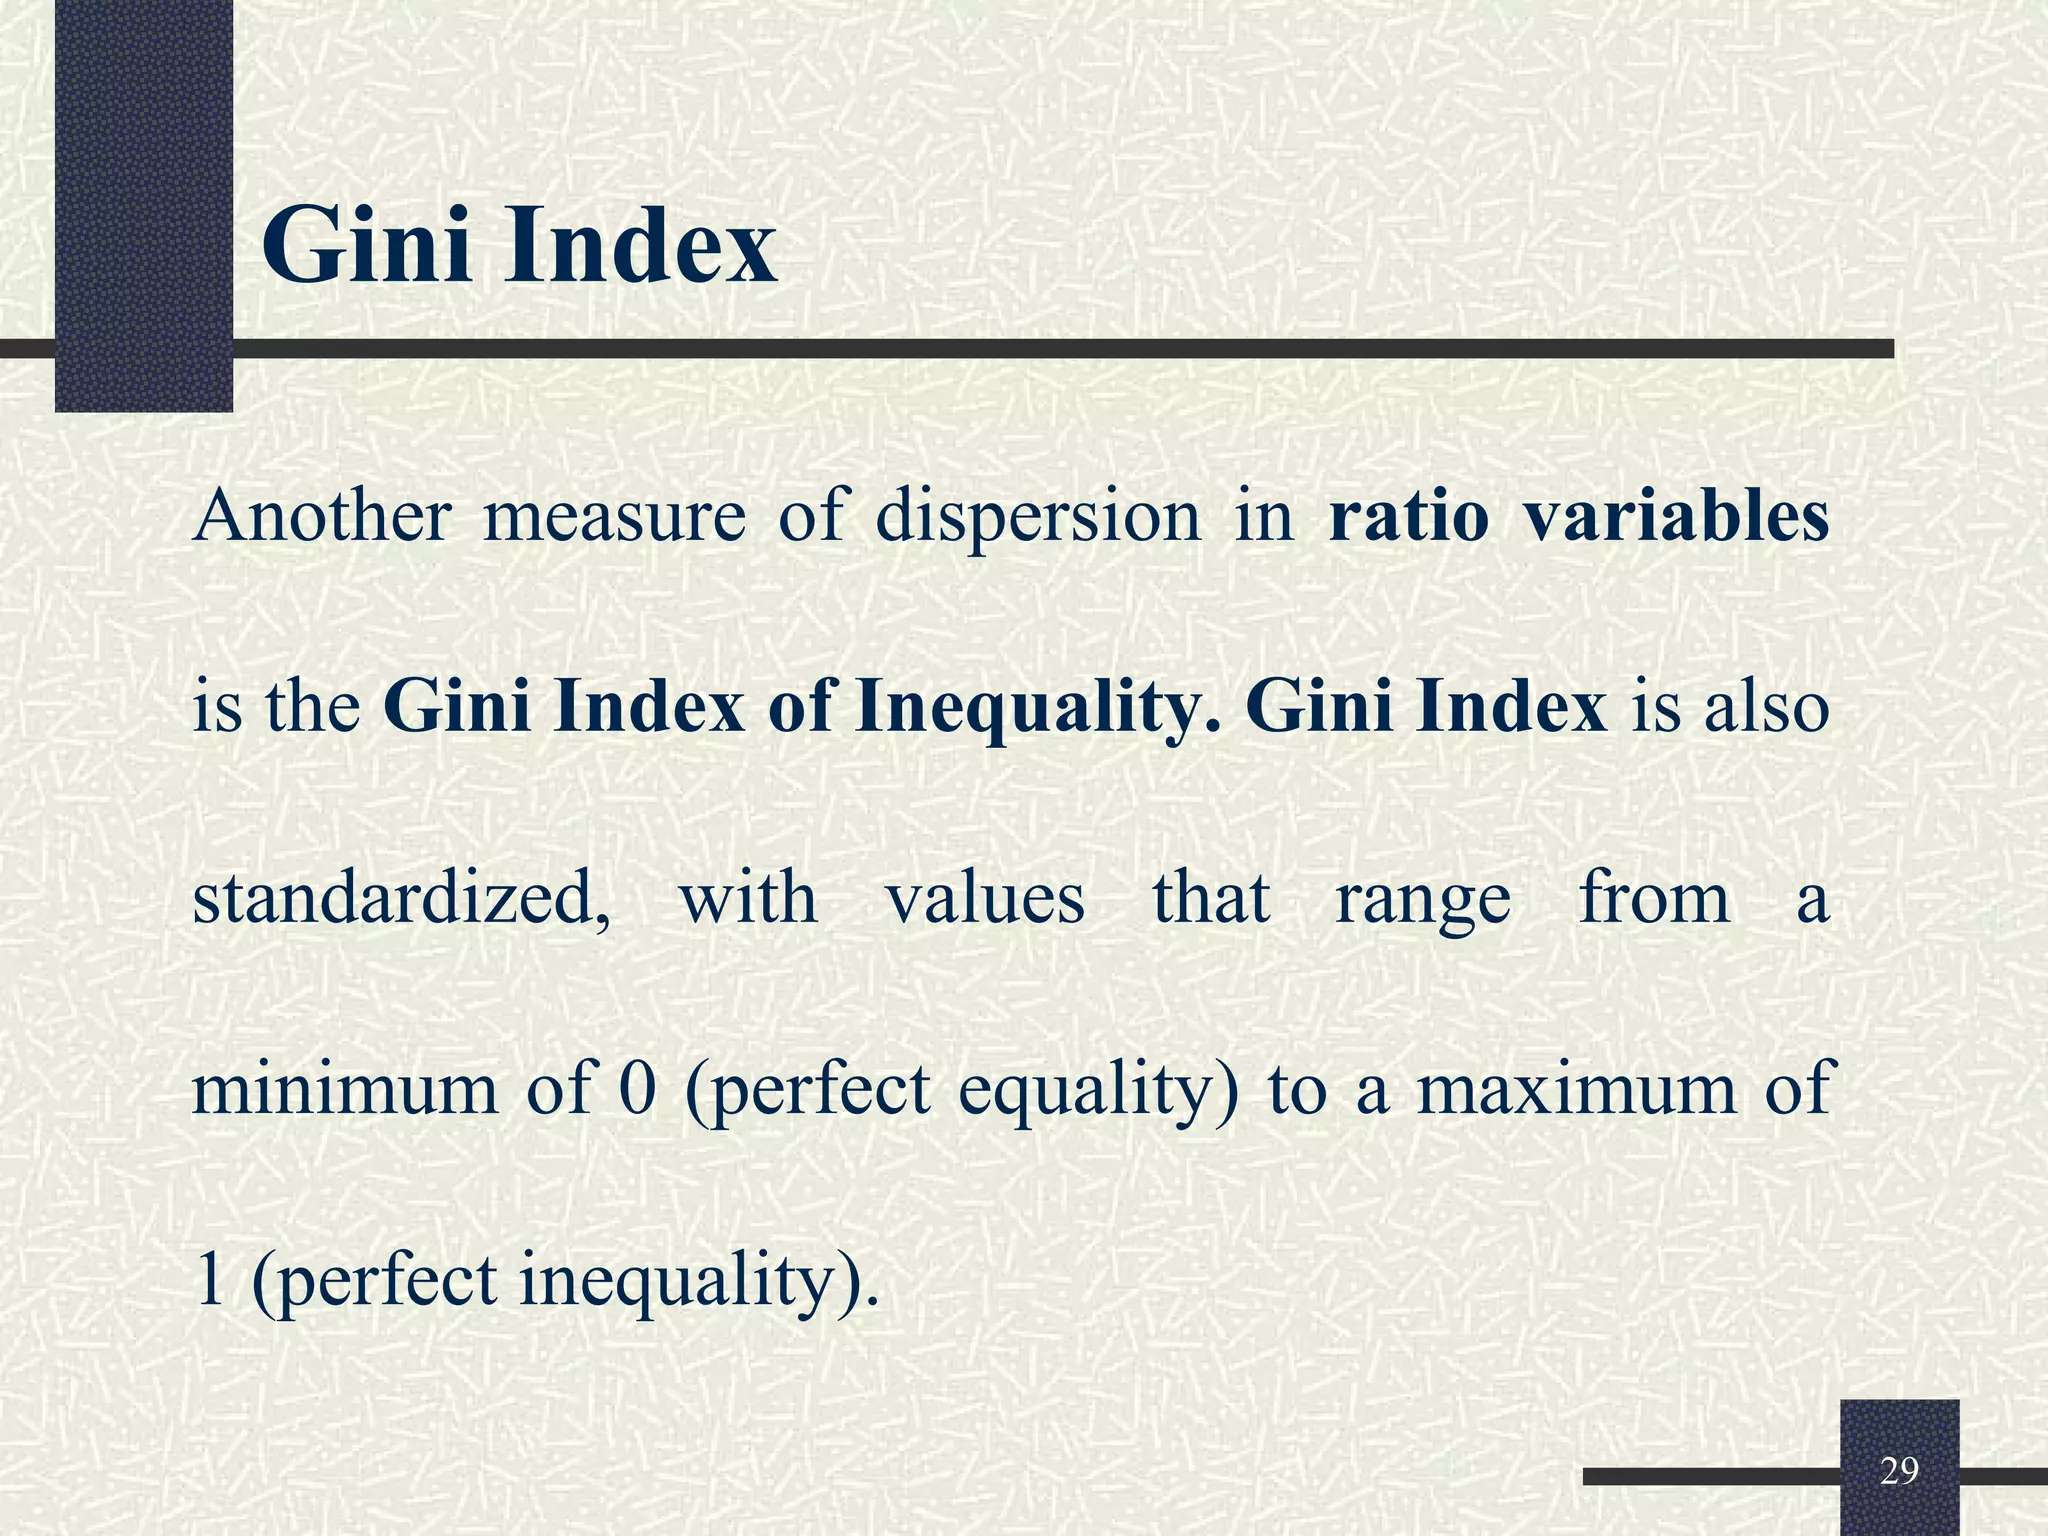
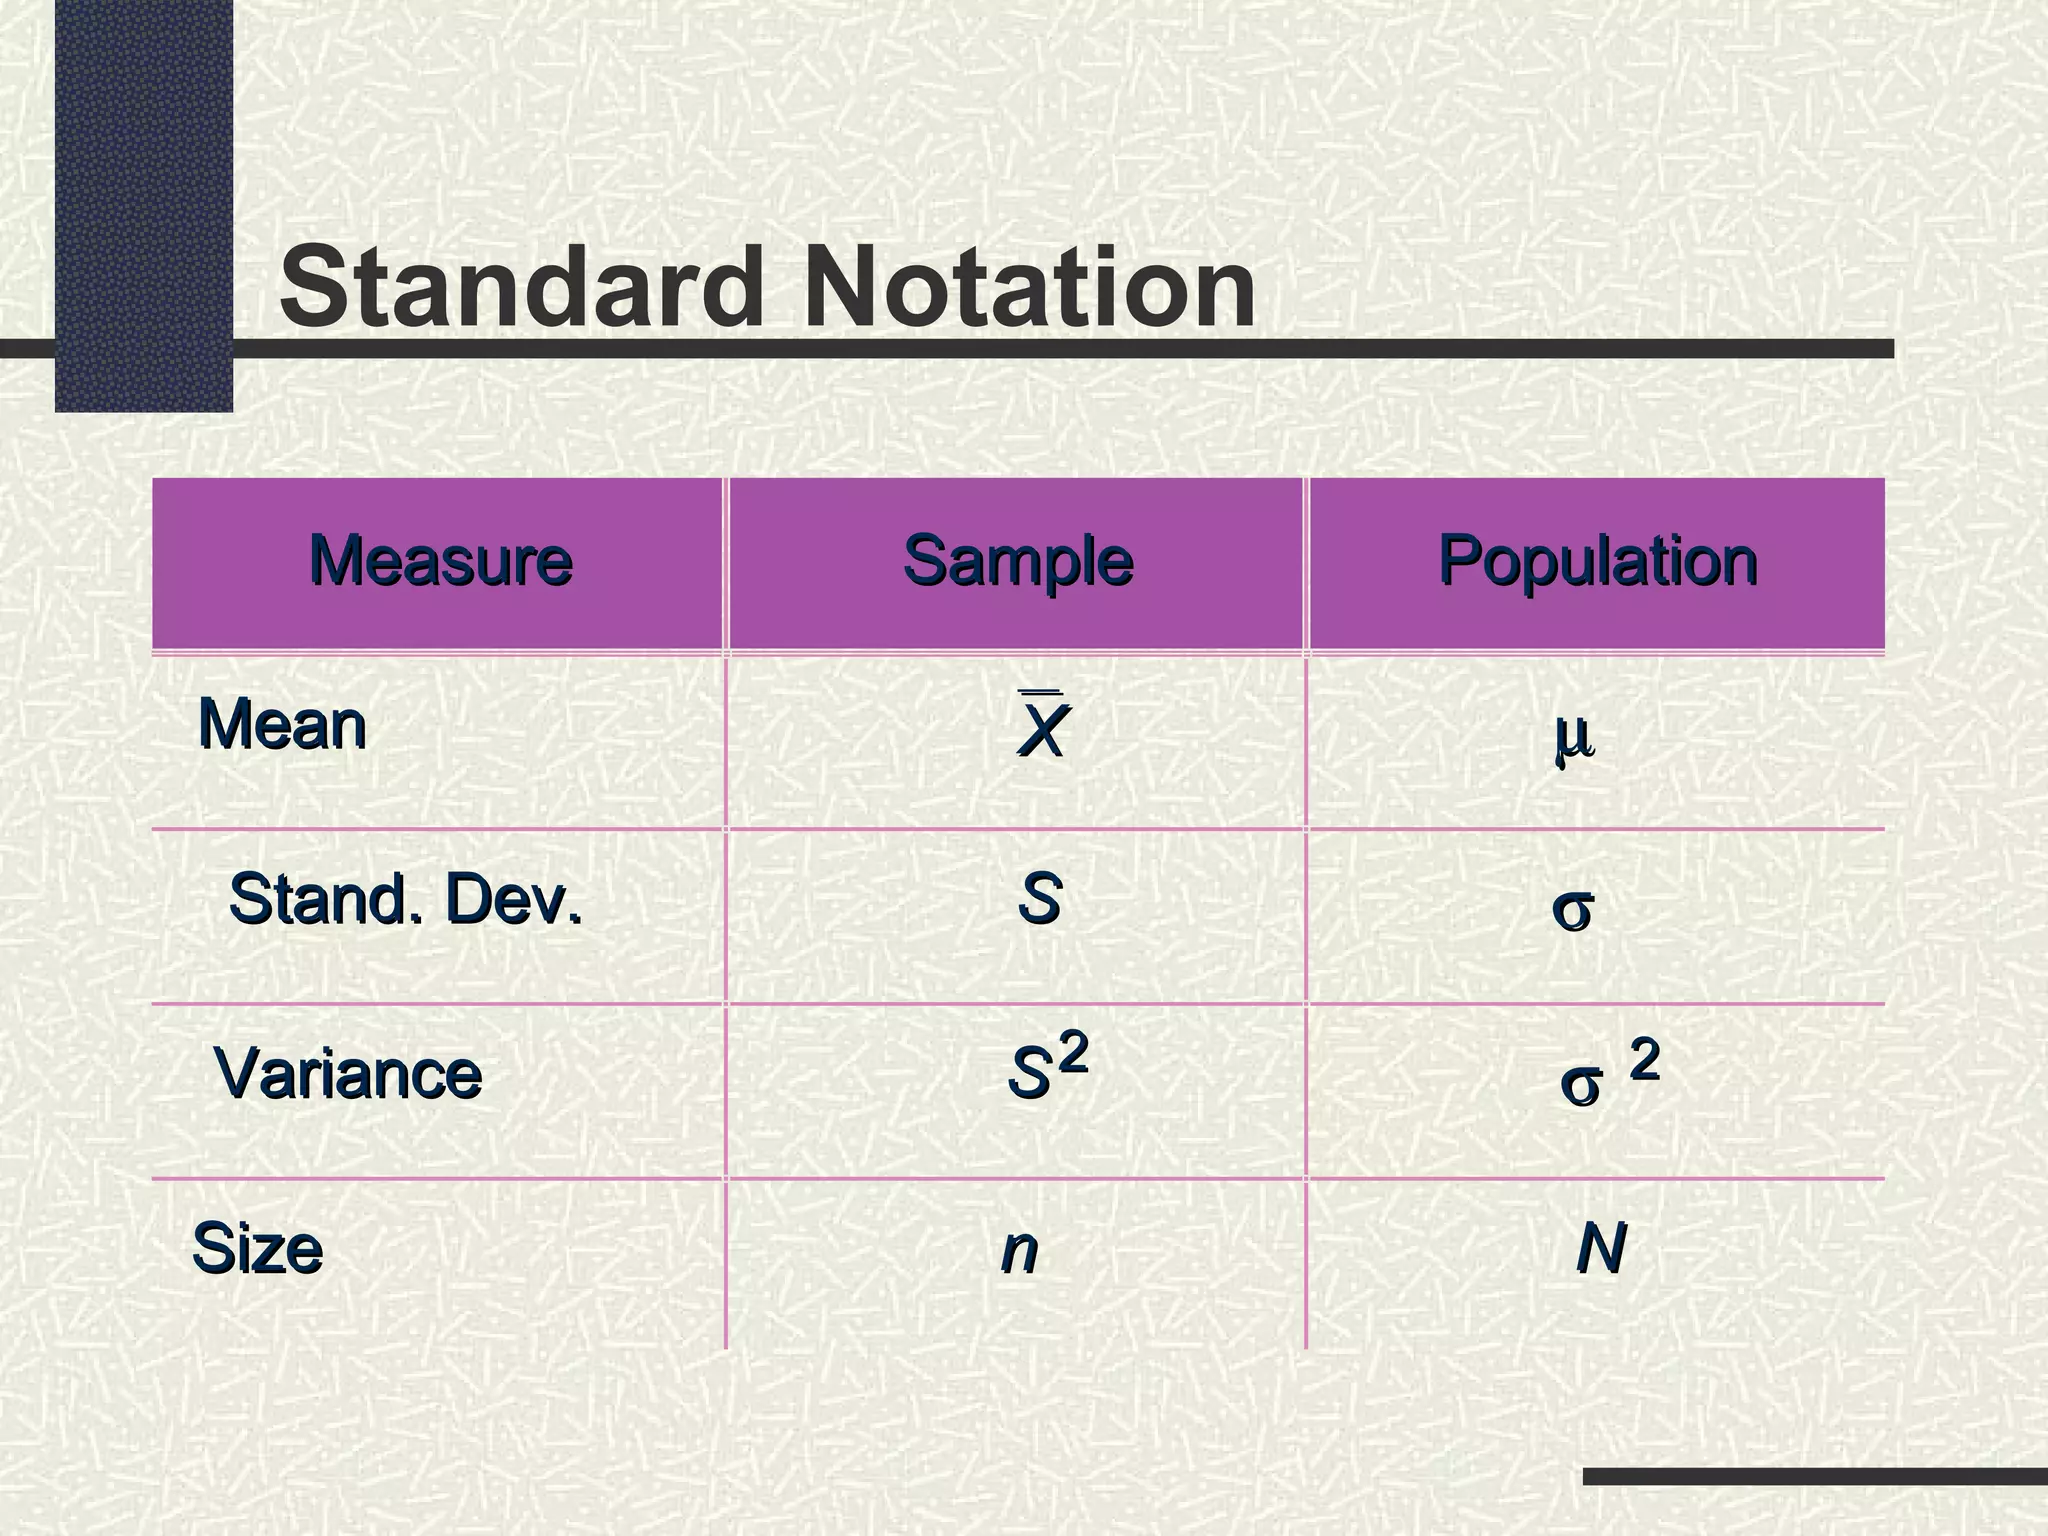
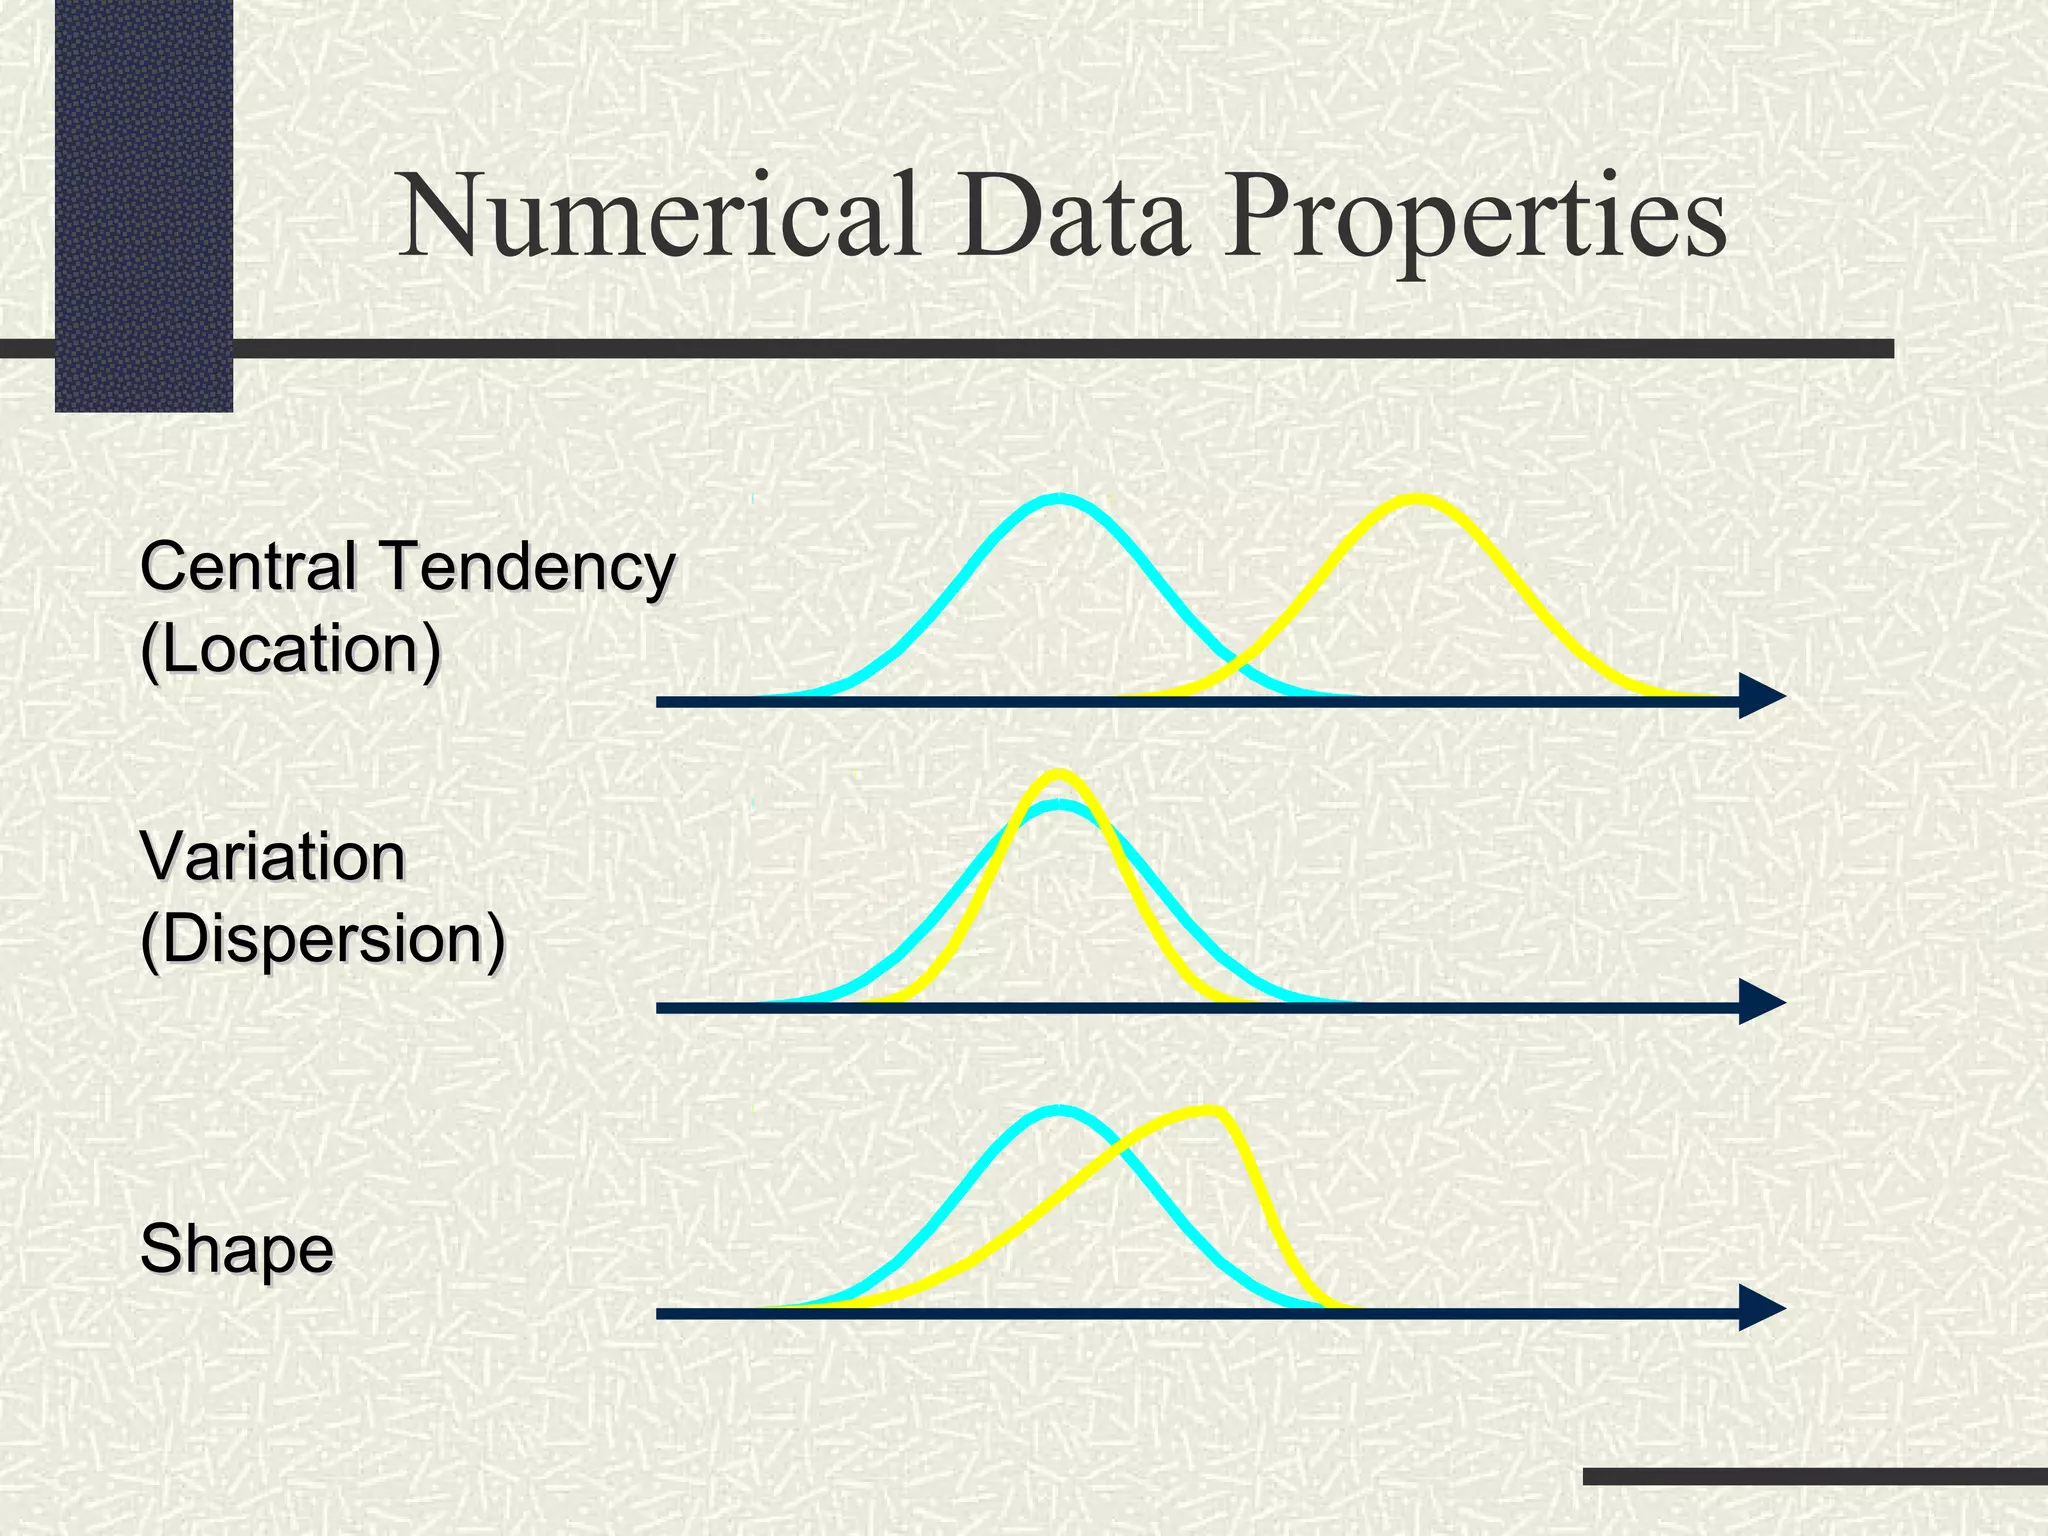
Measures of Dispersion/Variation/Spread
Dr. Athar KhanDr. Athar Khan
Associate ProfessorAssociate Professor
Department of Community MedicineDepartment of Community Medicine
Liaquat College of Medicine & DentistryLiaquat College of Medicine & Dentistry
Measures of Variation/Dispersion
2
Group A
10,20,30,40,50,60,70
MEAN = ?
Group B
25,30,40,40,45,50,50
MEAN = ?
3
4
Measure of Dispersion/Variability/Spread
• A measure of dispersion conveys information regarding the amount
of variability (heterogeneity) present in a set of data.
• OR
• In statistics, a measure of how much the data in a certain collection
are scattered around the mean.
• OR
• Measures of dispersion (or variability or spread) indicate the extent
to which the observed values are “spread out” around that
center OR how “far apart” observed values typically are from
each other and from some average(mean) ------ JSMU
5
6
Measures of dispersion are defined only for interval or
ratio(Quantitative) variables
7
8
Measure of Dispersion
There are two principal types of measures of
dispersion: RANGE measures and DEVIATION
measures.
Range measures are based on the distance between
pairs of (relatively) “extreme” values observed in the
data (MAXIMUM – MINIMUM).
Deviation measures are based on average deviations
from some average value.
9
Measure of Dispersion
• A measure of dispersion conveys information regarding the amount
of variability (heterogeneity) present in a set of data.
1. Range (R)
2. Inter Quartile Range (IQR)
3. Variance
4. Standard Deviation
5. Coefficient of variation (C.V)
 If all values different - Dispersion.
 If all values same No dispersion.
If values close to each other - Smaller
Dispersion.
 If values widely scattered - Greater
Dispersion. 10
Measures of Variation
11
• Range
•Variance
•Standard Deviation
•Mean or Average Deviation
•Coefficient of Variation
Range
 The difference in value between the
highest (maximum) and lowest
(minimum) observation
 Range =
 Quick measure of variability
 Greatly affected by extreme values
 Range is zero if all the values in a data set
are equal.
12
minmax xx −
Examples of Range
Distribution 1
32,35,36,36,37,38,40,42,42,43,43,45
Distribution 2
22,32,33,33,33,34,34,34,34,34,35,65
13
Inter Quartile Range (IQR)
• Distance between 1st
& 3rd
quartiles IQR
= Q3 - Q1
• Provides information about how much distance
is covered by middle 50% of the distribution.
14
INTERQUARTILE RANGE
The interquartile range is the value of the case that
stands at the 75th
percentile of the distribution
minus the value of the case that stands at the 25th
percentile (Q3 – Q1).
75th
percentile (Q3) - 25th
percentile (Q1)
15
16
Box
Plot
17
18
Interdecile Range
The interdecile range is the value of the case
that stands at the 90th
percentile of the
distribution minus the value of the case that
stands at the 10th
percentile.
90th
percentile - 10th
percentile
19
Margin of Error
 Margin of error specifies the range between the
value of the sample statistic that stands at the
97.5th percentile minus the sample statistic that
stands at the 2.5th
percentile.
 97.5th
percentile – 2.5th
percentile
20
21
Method
X X
X – X (X – X)2
Σ x =
X =Σ x /n Σ X - X= Σ (X – X)2 =
xxxxx
Mean Deviation
Defined as “average of the deviations from
the mean.”
M.D = Σ(x – x) (Ignoring+sign)
n
22
Variance
Defined as “squared difference of each
value from mean.” OR “the average of the
squared deviations from the mean”
s2
= Σ(x – x)2 SAMPLEVARIANCE
n-1 (n-1 is Degree of Freedom)
s2
= Σ(x – x)2 SAMPLEVARIANCE(Ifsample
n size is more than 30)
23
Variance - Notation
 s2
2
}Notation
Sample variance
Population variance
24
σ
Standard Deviation
•The standard deviation of a set of sample
values is a measure of variation of values
about the mean
•The square root of the variance is called the
standard deviation. ---- JSMU
• The SD is never less than the MD; the SD is
somewhat larger than the MD — typically
about 20-50%
25
Standard Deviation
 The value of the standard deviation is +
26
• Population standard deviation “σ” (sigma).
•Sample standard deviation “s”
• Sometimes written as SD
27
Sample Population
Mean =Σ x /n µ =Σ x /N
Variance s2
= Σ(x – x )2
n-1
σ 2
= Σ(x –µ )2
N
Standard Deviation s = √ s2
σ = √ σ2
xx
Coefficient of Variation
 Ratio measure of dispersion/inequality is called
the coefficient of variation, which is simply
the standard deviation divided by the mean.
 CV = SD/Mean
 The lower the CV, the greater the reliability of a
variable
•100%
s
xCV =
Sample
28
Gini Index
Another measure of dispersion in ratio variables
is the Gini Index of Inequality. Gini Index is also
standardized, with values that range from a
minimum of 0 (perfect equality) to a maximum of
1 (perfect inequality).
29
Standard Notation
MeasureMeasure SampleSample PopulationPopulation
MeanMean XX µµ
Stand. Dev.Stand. Dev. SS σσ
VarianceVariance SS 22
σσ 22
SizeSize nn NN
Numerical Data Properties
Central TendencyCentral Tendency
(Location)(Location)
VariationVariation
(Dispersion)(Dispersion)
ShapeShape
THANKS

Measures of Variation or Dispersion

  • 1.
    Measures of Dispersion/Variation/Spread Dr.Athar KhanDr. Athar Khan Associate ProfessorAssociate Professor Department of Community MedicineDepartment of Community Medicine Liaquat College of Medicine & DentistryLiaquat College of Medicine & Dentistry
  • 2.
  • 3.
    Group A 10,20,30,40,50,60,70 MEAN =? Group B 25,30,40,40,45,50,50 MEAN = ? 3
  • 4.
  • 5.
    Measure of Dispersion/Variability/Spread •A measure of dispersion conveys information regarding the amount of variability (heterogeneity) present in a set of data. • OR • In statistics, a measure of how much the data in a certain collection are scattered around the mean. • OR • Measures of dispersion (or variability or spread) indicate the extent to which the observed values are “spread out” around that center OR how “far apart” observed values typically are from each other and from some average(mean) ------ JSMU 5
  • 6.
    6 Measures of dispersionare defined only for interval or ratio(Quantitative) variables
  • 7.
  • 8.
  • 9.
    Measure of Dispersion Thereare two principal types of measures of dispersion: RANGE measures and DEVIATION measures. Range measures are based on the distance between pairs of (relatively) “extreme” values observed in the data (MAXIMUM – MINIMUM). Deviation measures are based on average deviations from some average value. 9
  • 10.
    Measure of Dispersion •A measure of dispersion conveys information regarding the amount of variability (heterogeneity) present in a set of data. 1. Range (R) 2. Inter Quartile Range (IQR) 3. Variance 4. Standard Deviation 5. Coefficient of variation (C.V)  If all values different - Dispersion.  If all values same No dispersion. If values close to each other - Smaller Dispersion.  If values widely scattered - Greater Dispersion. 10
  • 11.
    Measures of Variation 11 •Range •Variance •Standard Deviation •Mean or Average Deviation •Coefficient of Variation
  • 12.
    Range  The differencein value between the highest (maximum) and lowest (minimum) observation  Range =  Quick measure of variability  Greatly affected by extreme values  Range is zero if all the values in a data set are equal. 12 minmax xx −
  • 13.
    Examples of Range Distribution1 32,35,36,36,37,38,40,42,42,43,43,45 Distribution 2 22,32,33,33,33,34,34,34,34,34,35,65 13
  • 14.
    Inter Quartile Range(IQR) • Distance between 1st & 3rd quartiles IQR = Q3 - Q1 • Provides information about how much distance is covered by middle 50% of the distribution. 14
  • 15.
    INTERQUARTILE RANGE The interquartilerange is the value of the case that stands at the 75th percentile of the distribution minus the value of the case that stands at the 25th percentile (Q3 – Q1). 75th percentile (Q3) - 25th percentile (Q1) 15
  • 16.
  • 17.
  • 18.
  • 19.
    Interdecile Range The interdecilerange is the value of the case that stands at the 90th percentile of the distribution minus the value of the case that stands at the 10th percentile. 90th percentile - 10th percentile 19
  • 20.
    Margin of Error Margin of error specifies the range between the value of the sample statistic that stands at the 97.5th percentile minus the sample statistic that stands at the 2.5th percentile.  97.5th percentile – 2.5th percentile 20
  • 21.
    21 Method X X X –X (X – X)2 Σ x = X =Σ x /n Σ X - X= Σ (X – X)2 = xxxxx
  • 22.
    Mean Deviation Defined as“average of the deviations from the mean.” M.D = Σ(x – x) (Ignoring+sign) n 22
  • 23.
    Variance Defined as “squareddifference of each value from mean.” OR “the average of the squared deviations from the mean” s2 = Σ(x – x)2 SAMPLEVARIANCE n-1 (n-1 is Degree of Freedom) s2 = Σ(x – x)2 SAMPLEVARIANCE(Ifsample n size is more than 30) 23
  • 24.
    Variance - Notation s2 2 }Notation Sample variance Population variance 24 σ
  • 25.
    Standard Deviation •The standarddeviation of a set of sample values is a measure of variation of values about the mean •The square root of the variance is called the standard deviation. ---- JSMU • The SD is never less than the MD; the SD is somewhat larger than the MD — typically about 20-50% 25
  • 26.
    Standard Deviation  Thevalue of the standard deviation is + 26 • Population standard deviation “σ” (sigma). •Sample standard deviation “s” • Sometimes written as SD
  • 27.
    27 Sample Population Mean =Σx /n µ =Σ x /N Variance s2 = Σ(x – x )2 n-1 σ 2 = Σ(x –µ )2 N Standard Deviation s = √ s2 σ = √ σ2 xx
  • 28.
    Coefficient of Variation Ratio measure of dispersion/inequality is called the coefficient of variation, which is simply the standard deviation divided by the mean.  CV = SD/Mean  The lower the CV, the greater the reliability of a variable •100% s xCV = Sample 28
  • 29.
    Gini Index Another measureof dispersion in ratio variables is the Gini Index of Inequality. Gini Index is also standardized, with values that range from a minimum of 0 (perfect equality) to a maximum of 1 (perfect inequality). 29
  • 30.
    Standard Notation MeasureMeasure SampleSamplePopulationPopulation MeanMean XX µµ Stand. Dev.Stand. Dev. SS σσ VarianceVariance SS 22 σσ 22 SizeSize nn NN
  • 31.
    Numerical Data Properties CentralTendencyCentral Tendency (Location)(Location) VariationVariation (Dispersion)(Dispersion) ShapeShape
  • 32.

Editor's Notes

  • #31 Throughout this chapter, we will be using the following notation, which I will introduce now.
  • #32 Location (Position) Concerned with where values are concentrated. Variation (Dispersion) Concerned with the extent to which values vary. Shape Concerned with extent to which values are symmetrically distributed.