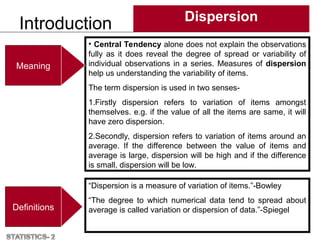
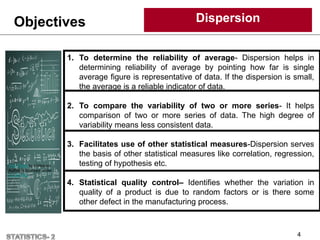
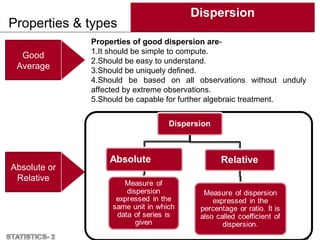
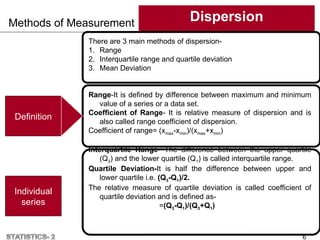
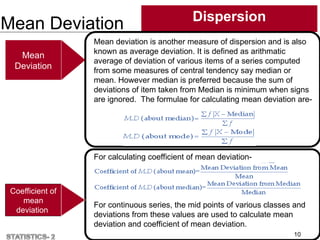
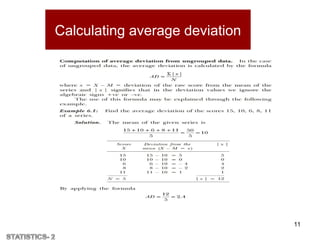
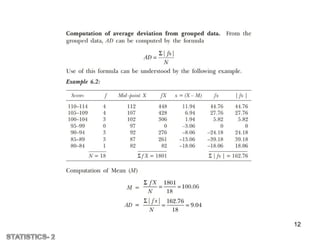
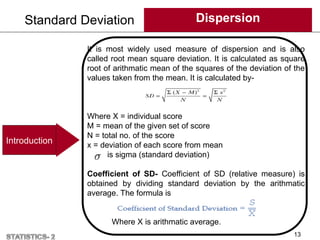
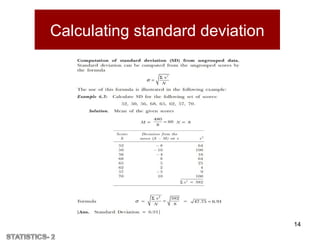
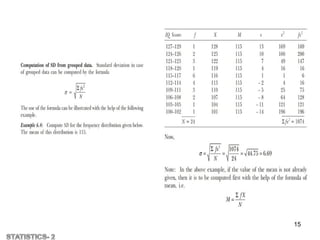
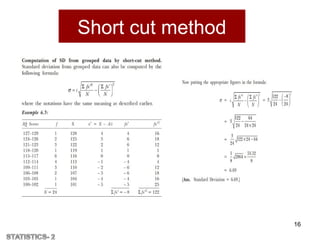
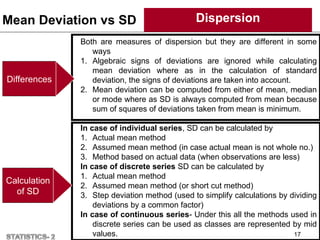
1
MAHATMA GANDHI UNIVERSITY
OF
MEDICAL SCIENCES AND TECHNOLOGY
DEPARTMENT OF CLINICAL PSYCHOLOGY
ASSIGNMENT
PRESENTATION TITLE : VARIABILITY AND IT’S MEASURES
SUBMITTED BY: SUBMITED TO:
JAHNVI RAJPAL DR. SNEHA NATHAWAT
ENROLL.NO. U2402828 ASSISTANT PROFESSOR
DATE: OCTOBER 25, 2024
Content
• Variability
1. Meaning
2. Importance
• Measures of variability
• Range
1. Calculating range
2. Uses of range
• Average deviation
1. Calculating grouped
2. Calculating ungrouped
3. uses
• standard deviation
1. Calculating standard deviation
2. Grouped data
3. Ungrouped data
4. Uses of standard deviation 2
Introduction Dispersion
3
• Central Tendency alone does not explain the observations
fully as it does reveal the degree of spread or variability of
individual observations in a series. Measures of dispersion
help us understanding the variability of items.
The term dispersion is used in two senses-
1.Firstly dispersion refers to variation of items amongst
themselves. e.g. if the value of all the items are same, it will
have zero dispersion.
2.Secondly, dispersion refers to variation of items around an
average. If the difference between the value of items and
average is large, dispersion will be high and if the difference
is small, dispersion will be low.
“Dispersion is a measure of variation of items.”-Bowley
“The degree to which numerical data tend to spread about
average is called variation or dispersion of data.”-Spiegel
Meaning
Definitions
Objectives Dispersion
4
1. To determine the reliability of average- Dispersion helps in
determining reliability of average by pointing how far is single
average figure is representative of data. If the dispersion is small,
the average is a reliable indicator of data.
2. To compare the variability of two or more series- It helps
comparison of two or more series of data. The high degree of
variability means less consistent data.
3. Facilitates use of other statistical measures-Dispersion serves
the basis of other statistical measures like correlation, regression,
testing of hypothesis etc.
4. Statistical quality control– Identifies whether the variation in
quality of a product is due to random factors or is there some
other defect in the manufacturing process.
This Photo by Unknown
Author is licensed under
CC BY-NC
Properties & types
Dispersion
5
Good
Average
Absolute or
Relative
Properties of good dispersion are-
1.It should be simple to compute.
2.Should be easy to understand.
3.Should be uniquely defined.
4.Should be based on all observations without unduly
affected by extreme observations.
5.Should be capable for further algebraic treatment.
Methods of Measurement Dispersion
6
Individual
series
There are 3 main methods of dispersion-
1. Range
2. Interquartile range and quartile deviation
3. Mean Deviation
Range-It is defined by difference between maximum and minimum
value of a series or a data set.
Coefficient of Range- It is relative measure of dispersion and is
also called range coefficient of dispersion.
Coefficient of range= (xmax-xmin)/(xmax+xmin)
Interquartile Range- The difference between the upper quartile
(Q3) and the lower quartile (Q1) is called interquartile range.
Quartile Deviation-It is half the difference between upper and
lower quartile i.e. (Q3-Q1)/2.
The relative measure of quartile deviation is called coefficient of
quartile deviation and is defined as-
=(Q3-Q1)/(Q3+Q1)
Definition
Calculating range
The difference between the largest X value and the smallest X
value
RANGE = X(MAX) – X(MIN)
FOR EXAMPLE
IF X = 2, 4, 6, 1, 8, 10
THEN RANGE =
REMEMBER THE REAL LIMITS!
RANGE = 10.5 - 0.5 = 10
IF WE DON’T ACCOUNT FOR REAL LIMITS
RANGE = 10 – 1 + 1 = 10
7
Calculating quartile deviation
8
9
Mean Deviation Dispersion
10
Coefficient of
mean
deviation
Mean
Deviation
Mean deviation is another measure of dispersion and is also
known as average deviation. It is defined as arithmatic
average of deviation of various items of a series computed
from some measures of central tendency say median or
mean. However median is preferred because the sum of
deviations of item taken from Median is minimum when signs
are ignored. The formulae for calculating mean deviation are-
For calculating coefficient of mean deviation-
For continuous series, the mid points of various classes and
deviations from these values are used to calculate mean
deviation and coefficient of mean deviation.
Calculating average deviation
11
12
Standard Deviation Dispersion
13
Introduction
It is most widely used measure of dispersion and is also
called root mean square deviation. It is calculated as square
root of arithmatic mean of the squares of the deviation of the
values taken from the mean. It is calculated by-
Where X = individual score
M = mean of the given set of score
N = total no. of the score
x = deviation of each score from mean
is sigma (standard deviation)
Coefficient of SD- Coefficient of SD (relative measure) is
obtained by dividing standard deviation by the arithmatic
average. The formula is
Where X is arithmatic average.
Calculating standard deviation
14
15
Short cut method
16
Mean Deviation vs SD Dispersion
17
Both are measures of dispersion but they are different in some
ways
1. Algebraic signs of deviations are ignored while calculating
mean deviation where as in the calculation of standard
deviation, the signs of deviations are taken into account.
2. Mean deviation can be computed from either of mean, median
or mode where as SD is always computed from mean because
sum of squares of deviations taken from mean is minimum.
In case of individual series, SD can be calculated by
1. Actual mean method
2. Assumed mean method (in case actual mean is not whole no.)
3. Method based on actual data (when observations are less)
In case of discrete series SD can be calculated by
1. Actual mean method
2. Assumed mean method (or short cut method)
3. Step deviation method (used to simplify calculations by dividing
deviations by a common factor)
In case of continuous series- Under this all the methods used in
discrete series can be used as classes are represented by mid
values.
Differences
Calculation
of SD
Uses of range
• We need to know simply the highest and lowest
scores of total spread
• The group or distribution is too small
• We want to know about the variability within the
group within no time
• We require speed and ease in the computation of
a measure of variability
• The distribution of the scores of the group is such
that the computation of other measures of
variability is not much useful
18
Uses of quartile deviation
• The distribution is skewed, containing a few very
extreme scores
• The measure of central tendency is available in
the form of median
• The distribution is truncated (irregular) or has
some indeterminate end values
• We have to determine the concentration around
the middle 50 percent of the cases
• The various percentiles and quartiles have been
already computed
19
Uses of average deviation
• Distribution of the scores is normal or near
to normal
• The standard deviation is unduly
influenced by the presence of extreme
deviation
• It is needed to weigh all deviations from the
mean according to their size
• A less reliable measure of variability can
be employed
20
Uses of standard deviation
• We need a most reliable measure of
variability
• There is a need of computation of
correlation coefficients, significance of
difference between means and the like
• Measure of central tendency is available in
the form of mean
• The distribution is normal or near to normal
21
22

dispersion...............................

  • 1.
    1 MAHATMA GANDHI UNIVERSITY OF MEDICALSCIENCES AND TECHNOLOGY DEPARTMENT OF CLINICAL PSYCHOLOGY ASSIGNMENT PRESENTATION TITLE : VARIABILITY AND IT’S MEASURES SUBMITTED BY: SUBMITED TO: JAHNVI RAJPAL DR. SNEHA NATHAWAT ENROLL.NO. U2402828 ASSISTANT PROFESSOR DATE: OCTOBER 25, 2024
  • 2.
    Content • Variability 1. Meaning 2.Importance • Measures of variability • Range 1. Calculating range 2. Uses of range • Average deviation 1. Calculating grouped 2. Calculating ungrouped 3. uses • standard deviation 1. Calculating standard deviation 2. Grouped data 3. Ungrouped data 4. Uses of standard deviation 2
  • 3.
    Introduction Dispersion 3 • CentralTendency alone does not explain the observations fully as it does reveal the degree of spread or variability of individual observations in a series. Measures of dispersion help us understanding the variability of items. The term dispersion is used in two senses- 1.Firstly dispersion refers to variation of items amongst themselves. e.g. if the value of all the items are same, it will have zero dispersion. 2.Secondly, dispersion refers to variation of items around an average. If the difference between the value of items and average is large, dispersion will be high and if the difference is small, dispersion will be low. “Dispersion is a measure of variation of items.”-Bowley “The degree to which numerical data tend to spread about average is called variation or dispersion of data.”-Spiegel Meaning Definitions
  • 4.
    Objectives Dispersion 4 1. Todetermine the reliability of average- Dispersion helps in determining reliability of average by pointing how far is single average figure is representative of data. If the dispersion is small, the average is a reliable indicator of data. 2. To compare the variability of two or more series- It helps comparison of two or more series of data. The high degree of variability means less consistent data. 3. Facilitates use of other statistical measures-Dispersion serves the basis of other statistical measures like correlation, regression, testing of hypothesis etc. 4. Statistical quality control– Identifies whether the variation in quality of a product is due to random factors or is there some other defect in the manufacturing process. This Photo by Unknown Author is licensed under CC BY-NC
  • 5.
    Properties & types Dispersion 5 Good Average Absoluteor Relative Properties of good dispersion are- 1.It should be simple to compute. 2.Should be easy to understand. 3.Should be uniquely defined. 4.Should be based on all observations without unduly affected by extreme observations. 5.Should be capable for further algebraic treatment.
  • 6.
    Methods of MeasurementDispersion 6 Individual series There are 3 main methods of dispersion- 1. Range 2. Interquartile range and quartile deviation 3. Mean Deviation Range-It is defined by difference between maximum and minimum value of a series or a data set. Coefficient of Range- It is relative measure of dispersion and is also called range coefficient of dispersion. Coefficient of range= (xmax-xmin)/(xmax+xmin) Interquartile Range- The difference between the upper quartile (Q3) and the lower quartile (Q1) is called interquartile range. Quartile Deviation-It is half the difference between upper and lower quartile i.e. (Q3-Q1)/2. The relative measure of quartile deviation is called coefficient of quartile deviation and is defined as- =(Q3-Q1)/(Q3+Q1) Definition
  • 7.
    Calculating range The differencebetween the largest X value and the smallest X value RANGE = X(MAX) – X(MIN) FOR EXAMPLE IF X = 2, 4, 6, 1, 8, 10 THEN RANGE = REMEMBER THE REAL LIMITS! RANGE = 10.5 - 0.5 = 10 IF WE DON’T ACCOUNT FOR REAL LIMITS RANGE = 10 – 1 + 1 = 10 7
  • 8.
  • 9.
  • 10.
    Mean Deviation Dispersion 10 Coefficientof mean deviation Mean Deviation Mean deviation is another measure of dispersion and is also known as average deviation. It is defined as arithmatic average of deviation of various items of a series computed from some measures of central tendency say median or mean. However median is preferred because the sum of deviations of item taken from Median is minimum when signs are ignored. The formulae for calculating mean deviation are- For calculating coefficient of mean deviation- For continuous series, the mid points of various classes and deviations from these values are used to calculate mean deviation and coefficient of mean deviation.
  • 11.
  • 12.
  • 13.
    Standard Deviation Dispersion 13 Introduction Itis most widely used measure of dispersion and is also called root mean square deviation. It is calculated as square root of arithmatic mean of the squares of the deviation of the values taken from the mean. It is calculated by- Where X = individual score M = mean of the given set of score N = total no. of the score x = deviation of each score from mean is sigma (standard deviation) Coefficient of SD- Coefficient of SD (relative measure) is obtained by dividing standard deviation by the arithmatic average. The formula is Where X is arithmatic average.
  • 14.
  • 15.
  • 16.
  • 17.
    Mean Deviation vsSD Dispersion 17 Both are measures of dispersion but they are different in some ways 1. Algebraic signs of deviations are ignored while calculating mean deviation where as in the calculation of standard deviation, the signs of deviations are taken into account. 2. Mean deviation can be computed from either of mean, median or mode where as SD is always computed from mean because sum of squares of deviations taken from mean is minimum. In case of individual series, SD can be calculated by 1. Actual mean method 2. Assumed mean method (in case actual mean is not whole no.) 3. Method based on actual data (when observations are less) In case of discrete series SD can be calculated by 1. Actual mean method 2. Assumed mean method (or short cut method) 3. Step deviation method (used to simplify calculations by dividing deviations by a common factor) In case of continuous series- Under this all the methods used in discrete series can be used as classes are represented by mid values. Differences Calculation of SD
  • 18.
    Uses of range •We need to know simply the highest and lowest scores of total spread • The group or distribution is too small • We want to know about the variability within the group within no time • We require speed and ease in the computation of a measure of variability • The distribution of the scores of the group is such that the computation of other measures of variability is not much useful 18
  • 19.
    Uses of quartiledeviation • The distribution is skewed, containing a few very extreme scores • The measure of central tendency is available in the form of median • The distribution is truncated (irregular) or has some indeterminate end values • We have to determine the concentration around the middle 50 percent of the cases • The various percentiles and quartiles have been already computed 19
  • 20.
    Uses of averagedeviation • Distribution of the scores is normal or near to normal • The standard deviation is unduly influenced by the presence of extreme deviation • It is needed to weigh all deviations from the mean according to their size • A less reliable measure of variability can be employed 20
  • 21.
    Uses of standarddeviation • We need a most reliable measure of variability • There is a need of computation of correlation coefficients, significance of difference between means and the like • Measure of central tendency is available in the form of mean • The distribution is normal or near to normal 21
  • 22.