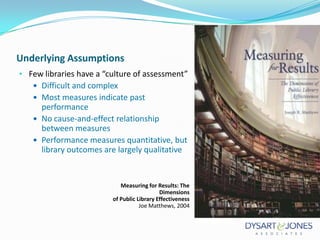
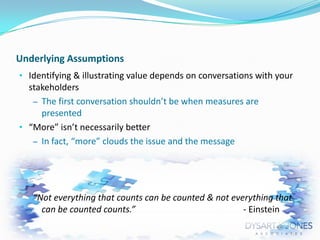
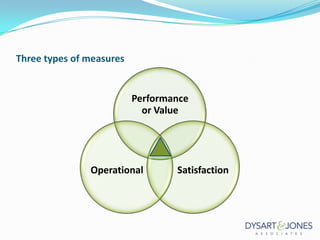
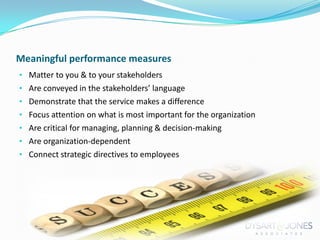
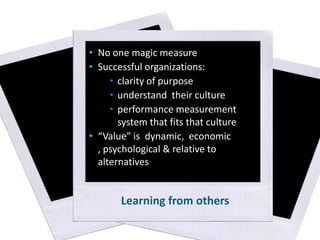
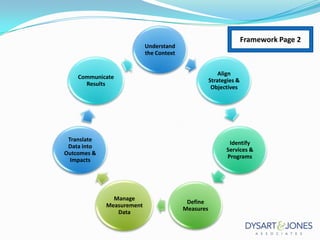
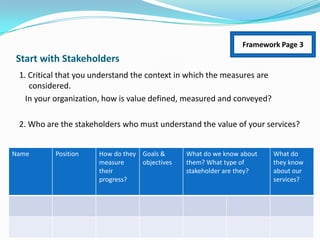
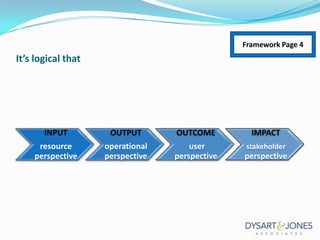
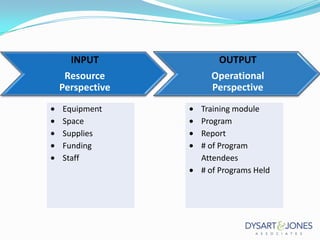
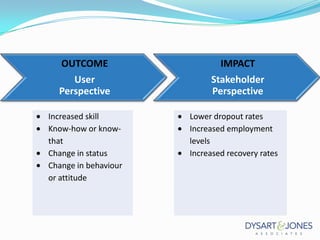
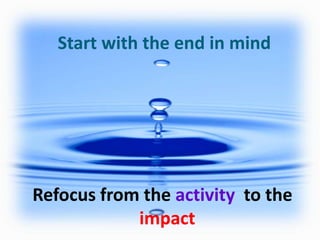
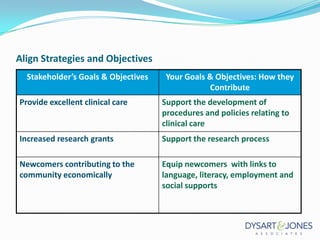
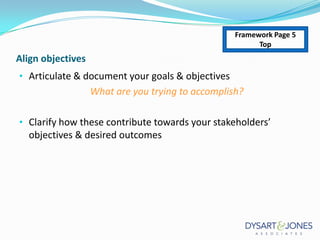
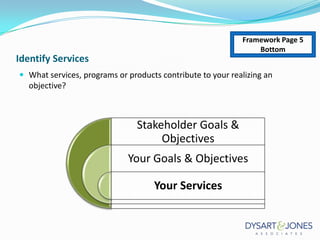
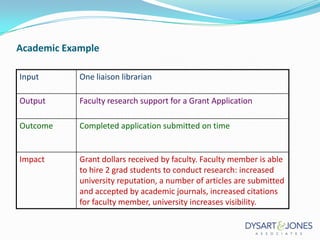
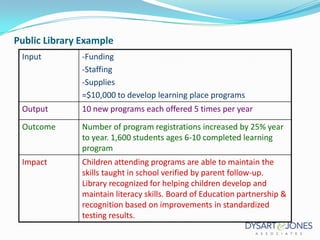
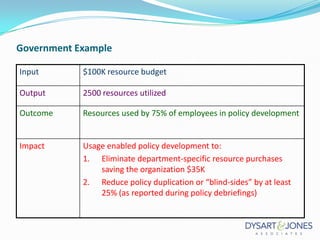
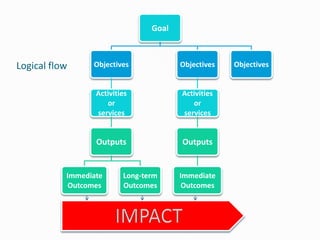
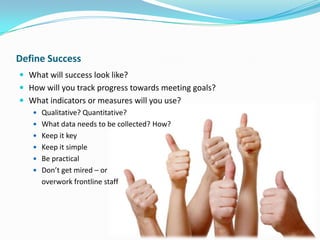
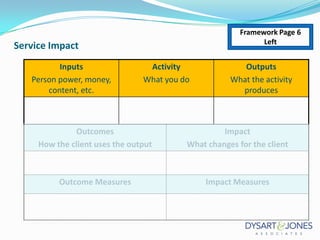
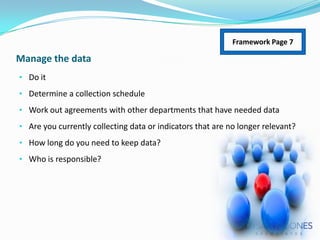
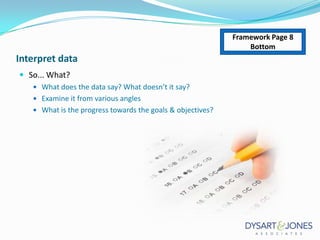
Rebecca Jones, MLS
rebecca@dysartjones.com
www.dysartjones.com

Rebecca Jones, MLS
rebecca@dysartjones.com
www.dysartjones.com
Underlying Assumptions
• Few libraries have a “culture of assessment”
 Difficult and complex
 Most measures indicate past

performance
 No cause-and-effect relationship
between measures
 Performance measures quantitative, but
library outcomes are largely qualitative

Measuring for Results: The
Dimensions
of Public Library Effectiveness
Joe Matthews, 2004
Underlying Assumptions
• Identifying & illustrating value depends on conversations with your

stakeholders
– The first conversation shouldn’t be when measures are
presented
• “More” isn’t necessarily better
– In fact, “more” clouds the issue and the message

“Not everything that counts can be counted & not everything that
can be counted counts.”
- Einstein
Three types of measures

Performance
or Value

Operational

Satisfaction
Measures…
 are, by definition, based on a “beginning” or monitor results against an

agreed-to objective or value
Questions driving measures
• What’s the library or information centre doing?
• How much is it doing?
• How well is it doing it?
• Who is it doing it for?
• What positive impact is the service

having for them?

What action will you take as a result of
knowing this?
Usage Statistics
• We’ve long tracked “how much”
• We also need to look at differences:
• Peaks?
• Dips?

• Switches?

• What are these statistics really telling us?
– And not?

• Are they highlighting where we should dig deeper?
Customer Satisfaction
• Tends to focus on existing products and/or services
• Usually measured through surveys
The performance question
Framework Page 1

What
measures do
you keep?
Meaningful performance measures
• Matter to you & to your stakeholders
• Are conveyed in the stakeholders’ language
• Demonstrate that the service makes a difference
• Focus attention on what is most important for the organization
• Are critical for managing, planning & decision-making

• Are organization-dependent
• Connect strategic directives to employees
• No one magic measure
• Successful organizations:
• clarity of purpose
• understand their culture
• performance measurement
system that fits that culture
• “Value” is dynamic, economic
, psychological & relative to
alternatives

Learning from others
Framework Page 2

Understand
the Context
Align
Strategies &
Objectives

Communicate
Results

Translate
Data into
Outcomes &
Impacts

Identify
Services &
Programs

Manage
Measurement
Data

Define
Measures
Understand
the Context
Know the context and contextors

How is value
defined, measu
red, and
communicated?

Name your
stakeholders

How do they
measure their
progress?
 Healthy living advocate

Councilor
Good Cause

 Endorses physical activities
 Spend for bike

lanes, pools, rinks, etc
 The library is just a community
centre anyway
 Says more people are impacted
by his stuff than by the library

Board Member:
Ms. Expert
 Does reconnaissance work on other library systems and

reports back to Board
 May not have a good grasp on what libraries do
 Feels money is no object when it comes to something she
sees as a trend
 Wants to compete in the library industry
The Provost of Doom
 Libraries days are numbered
 Libraries aren’t relevant
 Everyone has computers and internet
 need information? Just google it
 Starbucks has wireless

 With eBooks and research online believes facilities can

be made smaller

Dean of Humanities
Dr. Kee Paper
 Influential in university & broader academic circles
 Focus on research
 Has deep seated beliefs in traditional library services
 Quiet
 No technology

 Libraries are institutions for reading & research
Framework Page 3

Start with Stakeholders
1. Critical that you understand the context in which the measures are
considered.
In your organization, how is value defined, measured and conveyed?
2. Who are the stakeholders who must understand the value of your services?
Name

Position

How do they Goals &
measure
objectives
their
progress?

What do we know about
them? What type of
stakeholder are they?

What do
they know
about our
services?
Logic Model
• Popular in non-profit sector & increasingly in libraries and culture
• Based on “logical links” cause & effect
• Logical links:

– IF teens believe that the Library sees them as valuable, equal
community members & takes their needs seriously THEN teens are
more likely to engage in discussions & programs in the Library that
will positively impact their studies & their lives
– IF the information professional ensures current, relevant content is
easily available on employees’ desktops THEN the organization will
save $X in lost “hunt” time
Framework Page 4

It’s logical that

INPUT

OUTPUT

OUTCOME

IMPACT

resource
perspective

operational
perspective

user
perspective

stakeholder

perspective
INPUT
Resource
Perspective

OUTPUT
Operational
Perspective

Equipment
Space
Supplies
Funding
Staff

Training module
Program
Report
# of Program
Attendees
# of Programs Held
OUTCOME
User
Perspective
Increased skill
Know-how or knowthat
Change in status
Change in behaviour
or attitude

IMPACT
Stakeholder
Perspective
Lower dropout rates
Increased employment
levels
Increased recovery rates
Start with the end in mind

Refocus from the activity to the
impact
Align
Strategies &
Objectives
Align Strategies and Objectives
Stakeholder’s Goals & Objectives

Your Goals & Objectives: How they
Contribute

Provide excellent clinical care

Support the development of
procedures and policies relating to
clinical care

Increased research grants

Support the research process

Newcomers contributing to the
community economically

Equip newcomers with links to
language, literacy, employment and
social supports
Framework Page 5
Top

Align objectives
• Articulate & document your goals & objectives

What are you trying to accomplish?
• Clarify how these contribute towards your stakeholders’

objectives & desired outcomes
Identify
Services &
Programs
Framework Page 5
Bottom

Identify Services

 What services, programs or products contribute to your realizing an

objective?

Stakeholder Goals &
Objectives
Your Goals & Objectives

Your Services
Academic Example
Input

One liaison librarian

Output

Faculty research support for a Grant Application

Outcome

Completed application submitted on time

Impact

Grant dollars received by faculty. Faculty member is able
to hire 2 grad students to conduct research: increased
university reputation, a number of articles are submitted
and accepted by academic journals, increased citations
for faculty member, university increases visibility.
Public Library Example
Input

-Funding
-Staffing
-Supplies
=$10,000 to develop learning place programs

Output

10 new programs each offered 5 times per year

Outcome

Number of program registrations increased by 25% year
to year. 1,600 students ages 6-10 completed learning
program

Impact

Children attending programs are able to maintain the
skills taught in school verified by parent follow-up.
Library recognized for helping children develop and
maintain literacy skills. Board of Education partnership &
recognition based on improvements in standardized
testing results.
Government Example
Input

$100K resource budget

Output

2500 resources utilized

Outcome

Resources used by 75% of employees in policy development

Impact

Usage enabled policy development to:
1. Eliminate department-specific resource purchases
saving the organization $35K
2. Reduce policy duplication or “blind-sides” by at least
25% (as reported during policy debriefings)
Goal

Objectives

Objectives

Activities
or
services

Activities
or
services

Outputs

Logical flow

Outputs

Immediate
Outcomes

Long-term
Outcomes

Immediate
Outcomes

Objectives
Define
Measures
Define Success
 What will success look like?
 How will you track progress towards meeting goals?
 What indicators or measures will you use?
 Qualitative? Quantitative?
 What data needs to be collected? How?

 Keep it key
 Keep it simple
 Be practical
 Don’t get mired – or

overwork frontline staff
Framework Page 6
Left

Service Impact
Inputs
Person power, money,
content, etc.

Activity
What you do

Outputs
What the activity
produces

Outcomes
How the client uses the output

Impact
What changes for the client

Outcome Measures

Impact Measures
Define Outcomes and Impact
 What will success look like?

 And how will you “get” there?

INPUT

OUTPUT

OUTCOME

IMPACT
Define Outcomes and Impact
OUTCOME
User
Perspective
Increased skill
Know-how or
know-that
Change in status
Change in
behaviour or
attitude

IMPACT
Stakeholder
Perspective

Lower dropout
rates
Increased
employment
levels
Increased
recovery rates
Define measures by success being sought
Inputs
Person
power, money, content,
etc.

Activity
What you do

Outcomes
How the client uses the output

Outputs
What the activity
produces

Impact
What changes for the client
Framework Page 6
Bottom

So – what data will you need to collect?
What data or measures do you What data or measures do you to collect
to collect about Outcomes?
about Impact?
Manage
Measurement
Data
Framework Page 7

Manage the data
• Do it
• Determine a collection schedule
• Work out agreements with other departments that have needed data
• Are you currently collecting data or indicators that are no longer relevant?

• How long do you need to keep data?
• Who is responsible?
Translate
Data into
Outcomes &
Impacts
Framework Page 8
Bottom

Interpret data
 So... What?
 What does the data say? What doesn’t it say?
 Examine it from various angles
 What is the progress towards the goals & objectives?
Communicate
Results
Framework Page 8

Communicate results
• Actually begins when you are understanding the context
• Your message: “we have contributed towards your goals by……”
• If your goals & objectives are meaningful for your planning & decision-

making, your measures will be indispensable
http://www.shapingoutcomes.org
The real question
How have we impacted your project, work or decisions today?
Thanks!
Rebecca Jones
With special thanks to...

Moe Hosseini-Ara
@ Markham Public Library

Meaningful Measures: Why size (and volume) doesn't matter

  • 1.
    Rebecca Jones, MLS rebecca@dysartjones.com www.dysartjones.com RebeccaJones, MLS rebecca@dysartjones.com www.dysartjones.com
  • 2.
    Underlying Assumptions • Fewlibraries have a “culture of assessment”  Difficult and complex  Most measures indicate past performance  No cause-and-effect relationship between measures  Performance measures quantitative, but library outcomes are largely qualitative Measuring for Results: The Dimensions of Public Library Effectiveness Joe Matthews, 2004
  • 3.
    Underlying Assumptions • Identifying& illustrating value depends on conversations with your stakeholders – The first conversation shouldn’t be when measures are presented • “More” isn’t necessarily better – In fact, “more” clouds the issue and the message “Not everything that counts can be counted & not everything that can be counted counts.” - Einstein
  • 4.
    Three types ofmeasures Performance or Value Operational Satisfaction
  • 5.
    Measures…  are, bydefinition, based on a “beginning” or monitor results against an agreed-to objective or value
  • 6.
    Questions driving measures •What’s the library or information centre doing? • How much is it doing? • How well is it doing it? • Who is it doing it for? • What positive impact is the service having for them? What action will you take as a result of knowing this?
  • 7.
    Usage Statistics • We’velong tracked “how much” • We also need to look at differences: • Peaks? • Dips? • Switches? • What are these statistics really telling us? – And not? • Are they highlighting where we should dig deeper?
  • 8.
    Customer Satisfaction • Tendsto focus on existing products and/or services • Usually measured through surveys
  • 9.
  • 10.
  • 11.
    Meaningful performance measures •Matter to you & to your stakeholders • Are conveyed in the stakeholders’ language • Demonstrate that the service makes a difference • Focus attention on what is most important for the organization • Are critical for managing, planning & decision-making • Are organization-dependent • Connect strategic directives to employees
  • 12.
    • No onemagic measure • Successful organizations: • clarity of purpose • understand their culture • performance measurement system that fits that culture • “Value” is dynamic, economic , psychological & relative to alternatives Learning from others
  • 13.
    Framework Page 2 Understand theContext Align Strategies & Objectives Communicate Results Translate Data into Outcomes & Impacts Identify Services & Programs Manage Measurement Data Define Measures
  • 14.
  • 15.
    Know the contextand contextors How is value defined, measu red, and communicated? Name your stakeholders How do they measure their progress?
  • 16.
     Healthy livingadvocate Councilor Good Cause  Endorses physical activities  Spend for bike lanes, pools, rinks, etc  The library is just a community centre anyway  Says more people are impacted by his stuff than by the library Board Member: Ms. Expert  Does reconnaissance work on other library systems and reports back to Board  May not have a good grasp on what libraries do  Feels money is no object when it comes to something she sees as a trend  Wants to compete in the library industry
  • 17.
    The Provost ofDoom  Libraries days are numbered  Libraries aren’t relevant  Everyone has computers and internet  need information? Just google it  Starbucks has wireless  With eBooks and research online believes facilities can be made smaller Dean of Humanities Dr. Kee Paper  Influential in university & broader academic circles  Focus on research  Has deep seated beliefs in traditional library services  Quiet  No technology  Libraries are institutions for reading & research
  • 18.
    Framework Page 3 Startwith Stakeholders 1. Critical that you understand the context in which the measures are considered. In your organization, how is value defined, measured and conveyed? 2. Who are the stakeholders who must understand the value of your services? Name Position How do they Goals & measure objectives their progress? What do we know about them? What type of stakeholder are they? What do they know about our services?
  • 19.
    Logic Model • Popularin non-profit sector & increasingly in libraries and culture • Based on “logical links” cause & effect • Logical links: – IF teens believe that the Library sees them as valuable, equal community members & takes their needs seriously THEN teens are more likely to engage in discussions & programs in the Library that will positively impact their studies & their lives – IF the information professional ensures current, relevant content is easily available on employees’ desktops THEN the organization will save $X in lost “hunt” time
  • 20.
    Framework Page 4 It’slogical that INPUT OUTPUT OUTCOME IMPACT resource perspective operational perspective user perspective stakeholder perspective
  • 21.
  • 22.
    OUTCOME User Perspective Increased skill Know-how orknowthat Change in status Change in behaviour or attitude IMPACT Stakeholder Perspective Lower dropout rates Increased employment levels Increased recovery rates
  • 23.
    Start with theend in mind Refocus from the activity to the impact
  • 24.
  • 25.
    Align Strategies andObjectives Stakeholder’s Goals & Objectives Your Goals & Objectives: How they Contribute Provide excellent clinical care Support the development of procedures and policies relating to clinical care Increased research grants Support the research process Newcomers contributing to the community economically Equip newcomers with links to language, literacy, employment and social supports
  • 26.
    Framework Page 5 Top Alignobjectives • Articulate & document your goals & objectives What are you trying to accomplish? • Clarify how these contribute towards your stakeholders’ objectives & desired outcomes
  • 27.
  • 28.
    Framework Page 5 Bottom IdentifyServices  What services, programs or products contribute to your realizing an objective? Stakeholder Goals & Objectives Your Goals & Objectives Your Services
  • 29.
    Academic Example Input One liaisonlibrarian Output Faculty research support for a Grant Application Outcome Completed application submitted on time Impact Grant dollars received by faculty. Faculty member is able to hire 2 grad students to conduct research: increased university reputation, a number of articles are submitted and accepted by academic journals, increased citations for faculty member, university increases visibility.
  • 30.
    Public Library Example Input -Funding -Staffing -Supplies =$10,000to develop learning place programs Output 10 new programs each offered 5 times per year Outcome Number of program registrations increased by 25% year to year. 1,600 students ages 6-10 completed learning program Impact Children attending programs are able to maintain the skills taught in school verified by parent follow-up. Library recognized for helping children develop and maintain literacy skills. Board of Education partnership & recognition based on improvements in standardized testing results.
  • 31.
    Government Example Input $100K resourcebudget Output 2500 resources utilized Outcome Resources used by 75% of employees in policy development Impact Usage enabled policy development to: 1. Eliminate department-specific resource purchases saving the organization $35K 2. Reduce policy duplication or “blind-sides” by at least 25% (as reported during policy debriefings)
  • 34.
  • 35.
  • 36.
    Define Success  Whatwill success look like?  How will you track progress towards meeting goals?  What indicators or measures will you use?  Qualitative? Quantitative?  What data needs to be collected? How?  Keep it key  Keep it simple  Be practical  Don’t get mired – or overwork frontline staff
  • 37.
    Framework Page 6 Left ServiceImpact Inputs Person power, money, content, etc. Activity What you do Outputs What the activity produces Outcomes How the client uses the output Impact What changes for the client Outcome Measures Impact Measures
  • 38.
    Define Outcomes andImpact  What will success look like?  And how will you “get” there? INPUT OUTPUT OUTCOME IMPACT
  • 39.
    Define Outcomes andImpact OUTCOME User Perspective Increased skill Know-how or know-that Change in status Change in behaviour or attitude IMPACT Stakeholder Perspective Lower dropout rates Increased employment levels Increased recovery rates
  • 40.
    Define measures bysuccess being sought Inputs Person power, money, content, etc. Activity What you do Outcomes How the client uses the output Outputs What the activity produces Impact What changes for the client
  • 41.
    Framework Page 6 Bottom So– what data will you need to collect? What data or measures do you What data or measures do you to collect to collect about Outcomes? about Impact?
  • 42.
  • 43.
    Framework Page 7 Managethe data • Do it • Determine a collection schedule • Work out agreements with other departments that have needed data • Are you currently collecting data or indicators that are no longer relevant? • How long do you need to keep data? • Who is responsible?
  • 44.
  • 45.
    Framework Page 8 Bottom Interpretdata  So... What?  What does the data say? What doesn’t it say?  Examine it from various angles  What is the progress towards the goals & objectives?
  • 46.
  • 47.
    Framework Page 8 Communicateresults • Actually begins when you are understanding the context • Your message: “we have contributed towards your goals by……” • If your goals & objectives are meaningful for your planning & decision- making, your measures will be indispensable
  • 48.
  • 49.
    The real question Howhave we impacted your project, work or decisions today?
  • 50.
    Thanks! Rebecca Jones With specialthanks to... Moe Hosseini-Ara @ Markham Public Library

Editor's Notes

  • #4 Need to connect all data – usage stats, outcomesWhat is usage telling you? Anything?Percentage of community that are card holders, borrowers, e-resource users – what assumptions do we need to make (if 90K are borrowing, can we assume that 100K are using the facilities?)What is the cost of the usage?
  • #6 There is lots of work ongoing in the area of measurement. Not wanting to reinvent the wheel, we looked at the various measurement tools & systems in place &what we can learn from these. These included the traditional metrics of usage or activity-based statistics,
  • #7 Press the easy button
  • #8 Problem is these demonstrate what we do, -- or the “impact” on the library, NOT the impact on clients or patrons – what do circ stats or website hits say? – they indicate an effect on the library, not on the communityPeaks?Dips?Switches? - of services – or of certain client groups? Using select services more? Less? Recently on listserv DigLib – story in newspaper about “library services – it’s through the roof” – about a library’s website patron logon’s – going from 770,000 in 2005 to 930,000 in 2006 – library expects this to go over a million by 2008 – ppl from 20 states, Cdn provinces & Asia & Australia -- & that reference questions are way down & continue to fall – that they attritube this to the fact that the info is on the webNow – is that a good metric or a dangerous metric? Can’t judge unless u know what they are trying to achieve
  • #11 What measures do you currently keep?List out into 3 columns
  • #13 To initiate ideas and provide a framework for developing a meaningful measurement system that focuses on your value, and enables strong planning & decision-making for you, your function and all employees.Having said that, the overall objective for this course is to provide a blue-print for you to use in designing your measurement system. Every library – every information center - is different and the measurement systems for each should reflect the individual environment and situation. It would be so ideal if a course could tell you exactly what to do in your organization. But, it can’t. What it can do is guide you through the necessary steps to formulating a robust, reliable, reasonable and meaningful plan for measuring your value.The definition of a meaningful measurement system is that it demonstrates value that is acknowledged by clients & stakeholders, Is easily communicated, & it facilitates planning & decision-making.The purpose of all courses – not just this one – is to give you a different way of viewing measures and some ideas – to look at what other organizations are doing & let you decide what seems right for you.
  • #14 There are 2 performance measurement systems that I know of that fit this framework, the Balanced Scorecard and the Logic Model.
  • #16 This is where u spend the most time – requires conversations with councillors, local government “superiors”, community “partners” – basically stakeholders – stake or support?These stakeholders use the following indicators to measure their progress:In our environment, it is critical that we measure:Ask yourself, in our environment, what is it critical for us to measure? What “counts”?What are the overall goals and objectives?This is where you invest the most timeRequires conversations with superiors, colleagues in other functions & clients, constituentsWho are your stakeholders? That may not be as obvious an answer as you think. There may be 1 or a small group of people who determine your budget. Who influences these people? Is there a council, committee that impacts those decisions? Who’s on them? Who are the key opinion leaders in your organization?It’s never too early in any process to envisage how you’ll communicate the results
  • #26 Test these goals & objectives with your stakeholdersDiscuss these with staff to ensure their understanding are in keeping with your purpose & will aid with planning & decisions
  • #27 Clearly define this alignment by articulating & documenting your goals & objectivesClarify how these contribute towards your stakeholders’ objectives & desired outcomesTest these goals & objectives with your stakeholdersStaff need to be involved too – preferably in the first stage in understanding the context, but if that’s not possible, then certainly at this stage; they need to understand the goals & objectives both to ensure they are in keeping with where your organization is headed, and because their own personal objectives will flow from your organizational objectives – all employees need to be working towards these objectives to aid with planning & decisions - & to keep everyone pulling in the same direction
  • #34 Another finding of the OCLC report was that stakeholders are more supportive of the library if they see the library as a transformational force rather than as source of information. We have shifted from reporting numbers and activities to measuring the difference we actually make. How? Say hello to our friend the logic model
  • #37 Try to balance the qualitative & quantitativeBe careful to limit key measures to 4 or 5In balanced scorecard, organizations focus on about 4 measures for each of the four perspectives
  • #39 Try to balance the qualitative & quantitativeBe careful to limit key measures to 4 or 5In balanced scorecard, organizations focus on about 4 measures for each of the four perspectives
  • #40 Try to balance the qualitative & quantitativeBe careful to limit key measures to 4 or 5In balanced scorecard, organizations focus on about 4 measures for each of the four perspectives
  • #44 And then…you need to start collecting data We use the term ‘manage’ the collection because it is more than just collecting the data for your measures – you need a collection schedule
  • #46 One of the best things to do here is to ask people outside the information function or library to discuss the data with you; how do they see it? What does it tell them?
  • #48 If your goals & objectives are meaningful for stakeholders, your measures will be tooIf your goals & objectives are meaningful for your planning & decision-making, your measures will be indispensableWe talked a few minutes ago about the need to think about how you’ll communicate the measures when you are designing the systemWill you do quarterly stewardship reviews? Bi-annual? Annual? How will you keep on the radar screen of key stakeholders? Presentations? Reports? Short conversations?