Download as PDF, PPTX


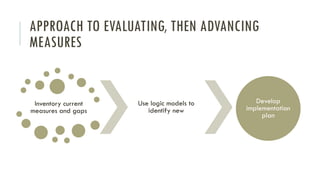
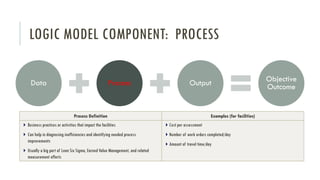
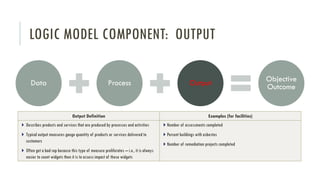
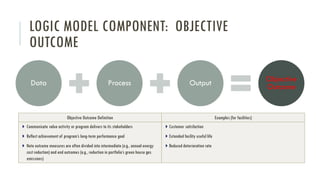
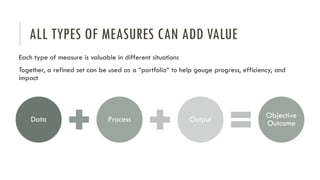
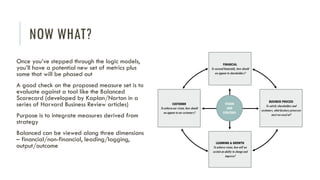
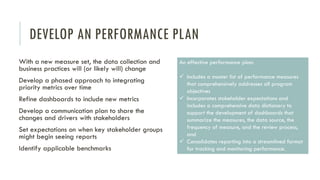

The document emphasizes the importance of aligning organizational metrics with strategic objectives to enhance decision-making and impact within organizations. It identifies the need to refine performance measures through logic models and suggests a phased approach for integrating and reporting metrics that accurately reflect program goals. Additionally, it highlights the role of stakeholder engagement and effective communication in implementing these performance measures.


