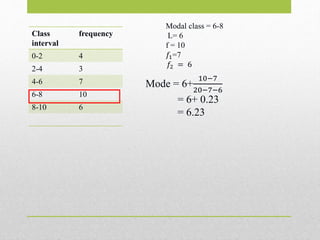
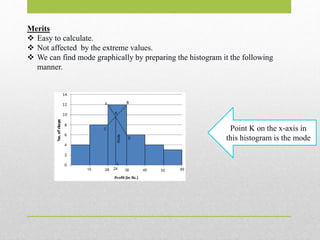
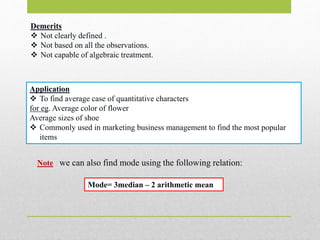
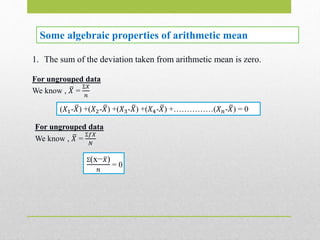
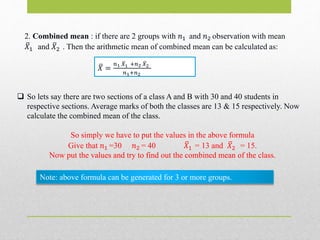
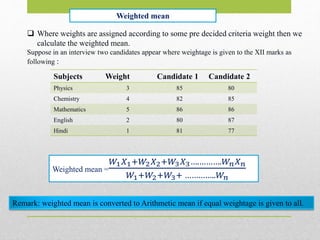
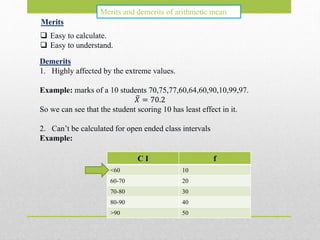
The document discusses the concept of central tendency in statistics, which refers to the tendency of data to concentrate around a central value, often represented by the mean, median, or mode. It explores various measures of central tendency including their definitions, calculations, advantages, and disadvantages, providing guidelines on how to choose the most suitable measure based on specific data characteristics. Additionally, it outlines the importance of considering extreme values and provides examples to illustrate the application of these measures in different scenarios.
![Geometric mean
Geometric mean of N variate values is the Nth root of their product.
Suppose 𝑋1, 𝑋2, 𝑋3, 𝑋4 … … … … … … … … 𝑋 𝑁 are N variate values, then the
geometric mean or average is given as,
G= 𝑁
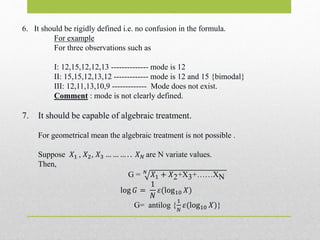
𝑋1. 𝑋2. 𝑋3. 𝑋4 … … … … … … … … 𝑋 𝑁
G= antilog [
Ʃ𝑋
𝑁
]
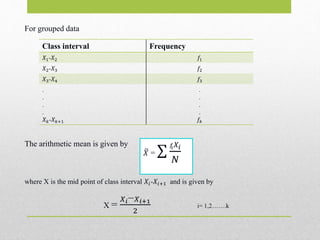
In case 𝑋1, 𝑋2, 𝑋3, 𝑋4 … … … … … … … … 𝑋 𝑁 have corresponding frequencies 𝑓1,
𝑓2, 𝑓3……. 𝑓𝑁 then
G= antilog {Ʃ(𝑓 𝑋)
𝑁
}](https://image.slidesharecdn.com/measuresofcentraltendency-200507142344/85/3Measures-of-central-tendency-14-320.jpg)