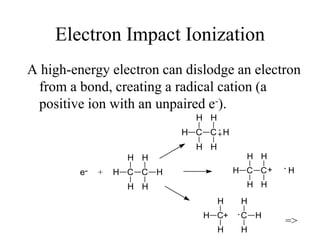
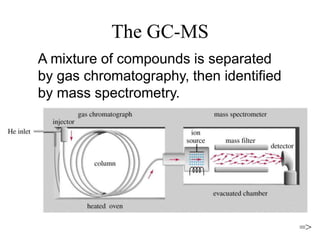
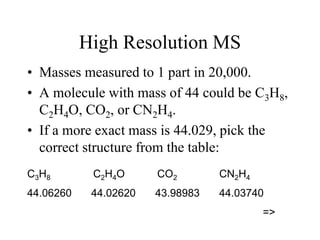
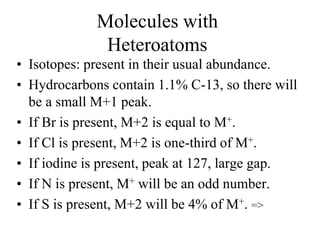
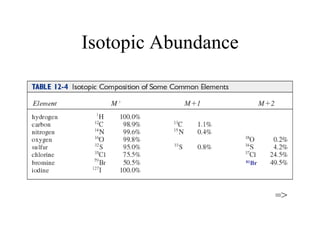
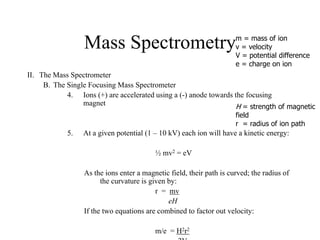
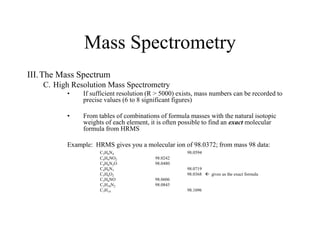
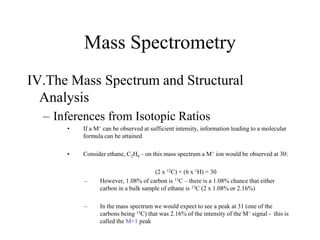
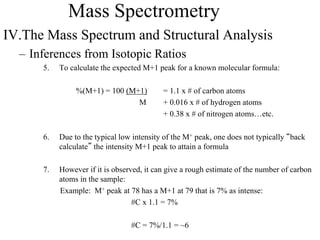
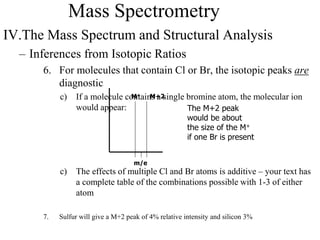
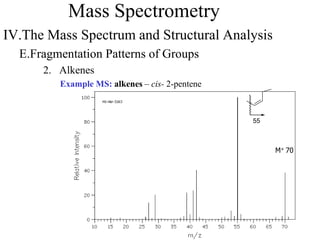
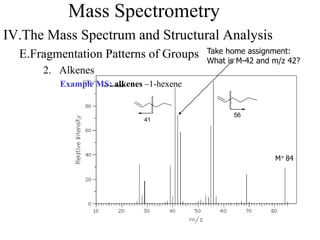
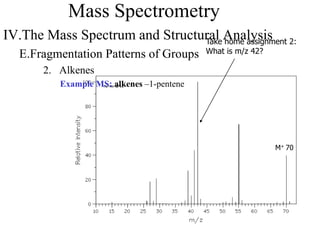
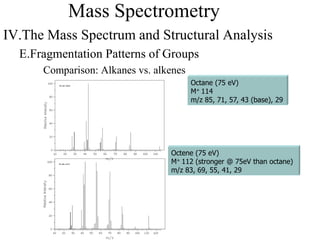
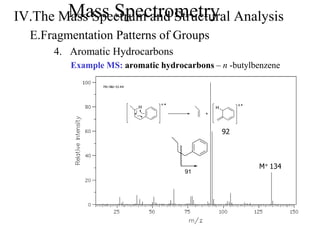
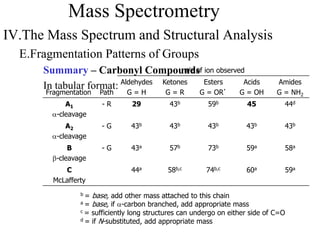
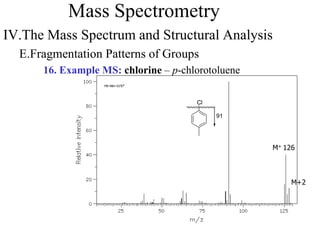
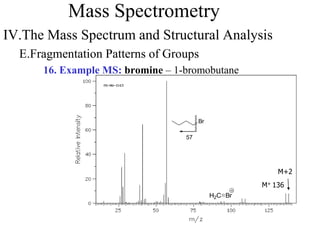
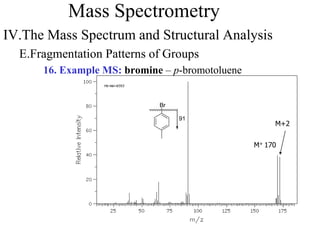
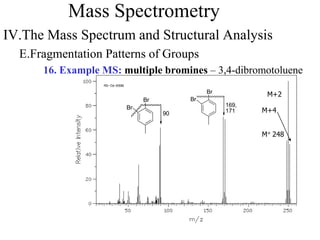
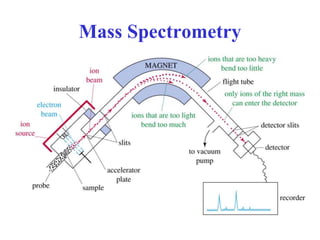
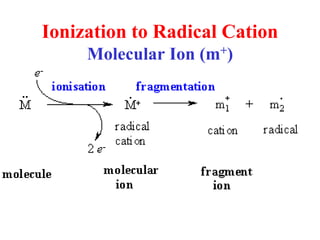
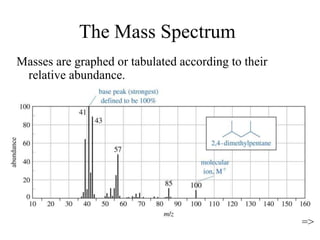
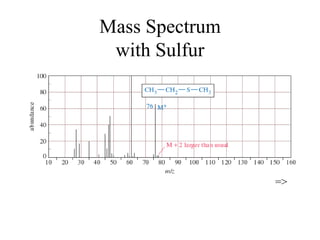
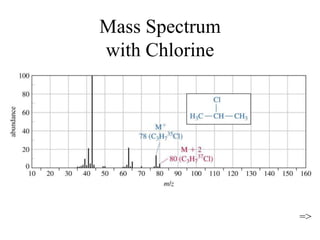
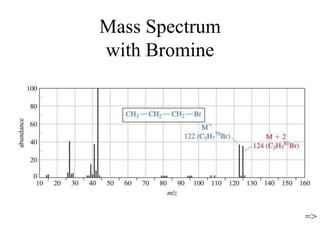
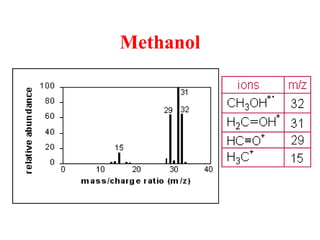
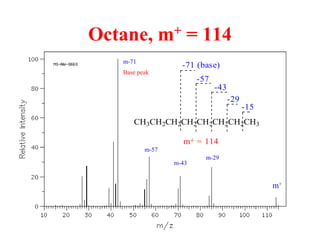
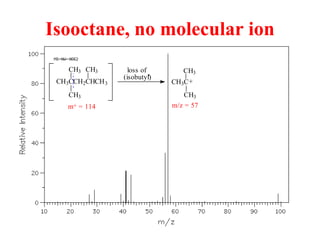
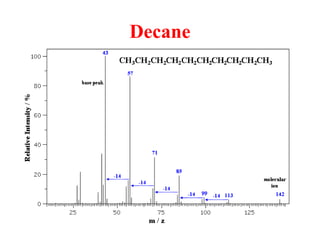
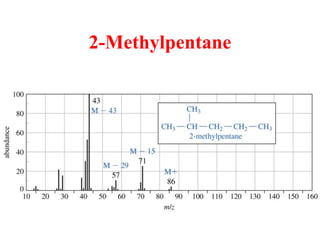
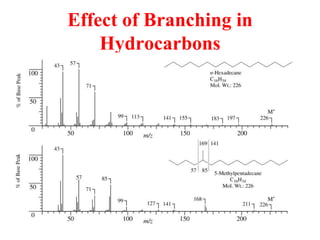
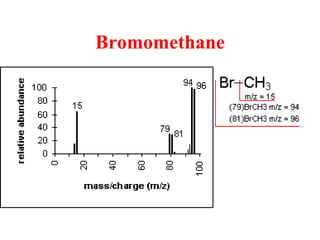
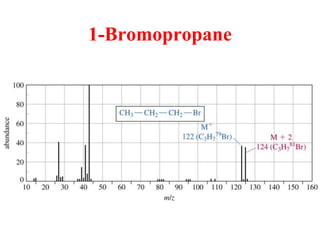
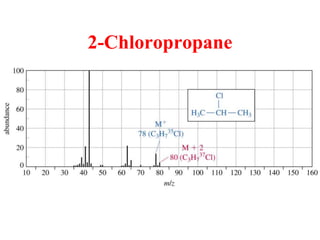
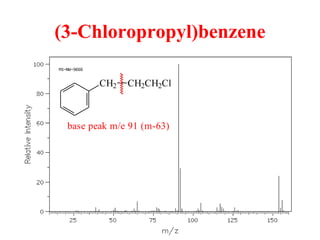
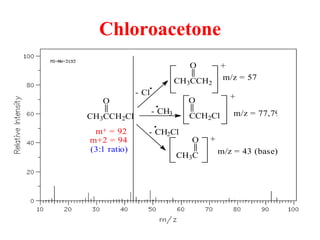
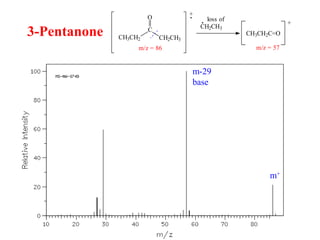
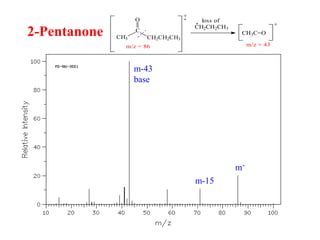
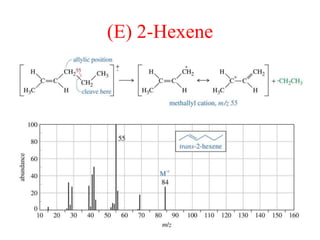
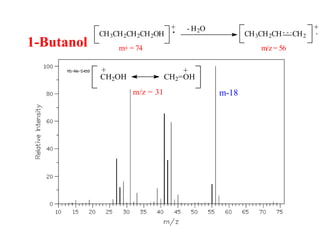
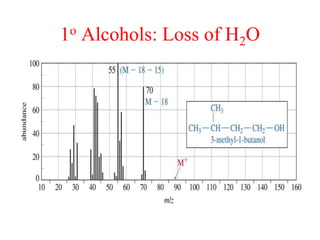
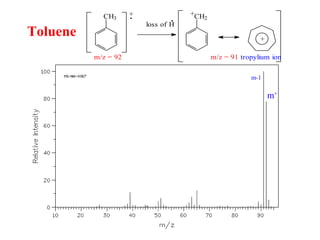
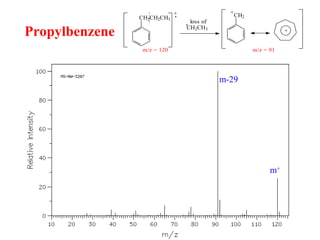
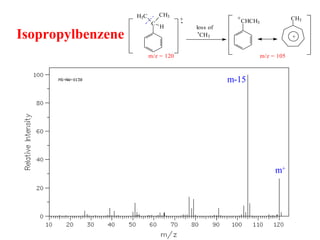
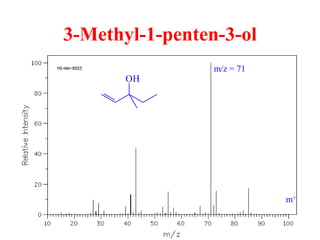
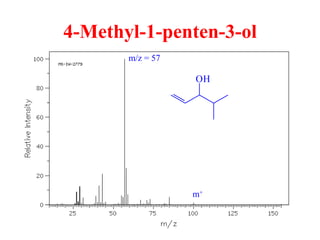
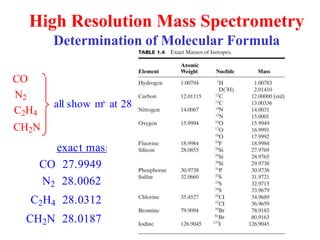
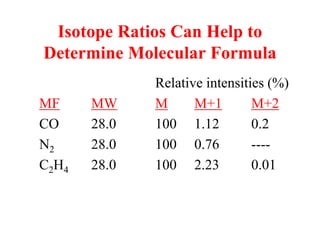
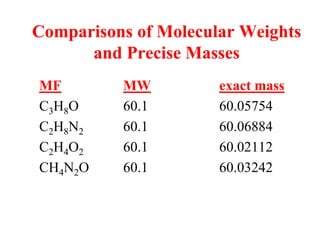
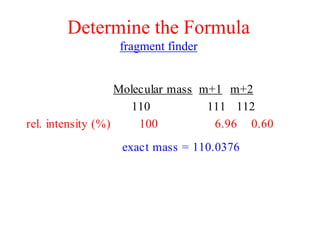
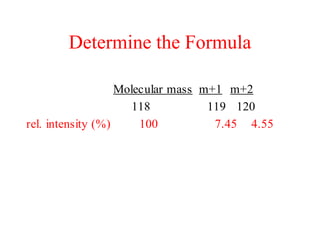
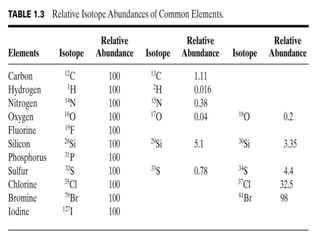
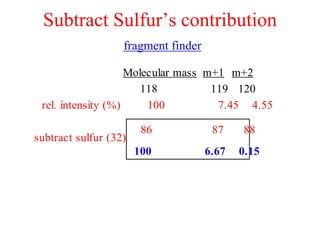
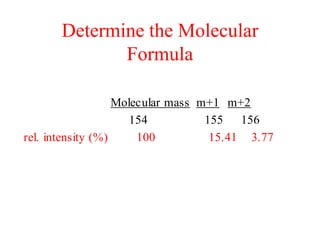
Mass spectroscopy
SHOUVIK KR NANDY
Mass Spectrometry
• Molecular weight can be obtained from a
very small sample.
• It does not involve the absorption or emission
of light.
• A beam of high-energy electrons breaks the
molecule apart.
• The masses of the fragments and their
relative abundance reveal information about
the structure of the molecule.
Mass Spectrometry
THE MAIN USE OF MS IN ORG CHEM IS:
• DETERMINE THE MOLECULAR MASS OF
ORGANIC COMPOUNDS
• DETERMINE THE MOLECULAR FORMULA OF
ORGANIC COMPOUNDS
HOW DO WE ACHIEVE THIS?
• PERSUADE THE MOLECULE TO ENTER
THE VAPOR PHASE (CAN BE DIFFICULT)
• PRODUCE IONS FROM THE MOLECULES THAT ENTER
THE GAS PHASE
• SEPARATE THE IONS ACCORDING TO THEIR
MASS-TO-CHARGE RATIOS (m/z))
• MEASURE AND RECORD THESE IONS
IONIZING METHODS
• ELECTRON IMPACT - HIGH ENERGY
ELECTRONS ABOUT 70 EV!!
• CHEMICAL IONIZATION LOW ENERGY
ELECTRON IMPACT
RADICAL CATION
ONLY CATIONS ARE CARRIED TO DETECTOR
BOND-BREAKING
Electron Impact Ionization
A high-energy electron can dislodge an electron
from a bond, creating a radical cation (a
positive ion with an unpaired e-).
e- + H C
H
H
C
H
H
H
H C
H
H
C
H
H
H
H C
H
H
C
H
H
+ H
H C
H
H
C
H
H
H
+
=>
Separation of Ions
• Only the cations are deflected by the
magnetic field.
• Amount of deflection depends on m/z.
• The detector signal is proportional to the
number of ions hitting it.
• By varying the magnetic field, ions of all
masses are collected and counted. =>
The GC-MS
=>
A mixture of compounds is separated
by gas chromatography, then identified
by mass spectrometry.
High Resolution MS
• Masses measured to 1 part in 20,000.
• A molecule with mass of 44 could be C3H8,
C2H4O, CO2, or CN2H4.
• If a more exact mass is 44.029, pick the
correct structure from the table:
C3H8 C2H4O CO2 CN2H4
44.06260 44.02620 43.98983 44.03740
=>
Molecules with
Heteroatoms
• Isotopes: present in their usual abundance.
• Hydrocarbons contain 1.1% C-13, so there will
be a small M+1 peak.
• If Br is present, M+2 is equal to M+.
• If Cl is present, M+2 is one-third of M+.
• If iodine is present, peak at 127, large gap.
• If N is present, M+ will be an odd number.
• If S is present, M+2 will be 4% of M+. =>
Isotopic Abundance
=>
81Br
Mass Spectrometry
• Introduction
– General overview
• Mass Spectrometry is the generation, separation and
characterization of gas phase ions according to their
relative mass as a function of charge
• Previously, the requirement was that the sample be
able to be vaporized (similar limitation to GC), but
modern ionization techniques allow the study of
such non-volatile molecules as proteins and
nucleotides
Mass Spectrometry
II.The Mass Spectrometer
– General Schematic
• A mass spectrometer needs to perform three
functions:
• Creation of ions – the sample molecules are subjected
to a high energy beam of electrons, converting some
of them to ions
• Separation of ions – as they are accelerated in an
electric field, the ions are separated according to
mass-to-charge ratio (m/z)
• Detection of ions – as each separated population of
ions is generated, the spectrometer needs to qualify
and quantify them
Mass Spectrometry
II.The Mass Spectrometer
B.Single Focusing Mass Spectrometer
• A small quantity of sample is injected and
vaporized under high vacuum
• The sample is then bombarded with electrons
having 25-80 eV of energy
• A valence electron is “punched” off of the
molecule, and an ion is formed
Mass Spectrometry
II. The Mass Spectrometer
B. The Single Focusing Mass Spectrometer
4. Ions (+) are accelerated using a (-) anode towards the focusing
magnet
5. At a given potential (1 – 10 kV) each ion will have a kinetic energy:
½ mv2 = eV
As the ions enter a magnetic field, their path is curved; the radius of
the curvature is given by:
r = mv
eH
If the two equations are combined to factor out velocity:
m/e = H2r2
m = mass of ion
v = velocity
V = potential difference
e = charge on ion
H = strength of magnetic
field
r = radius of ion path
Mass Spectrometry
II.The Mass Spectrometer
B.Single Focusing Mass Spectrometer
6. At a given potential, only one mass would have
the correct radius path to pass through the
magnet towards the detector
7. “Incorrect” mass particles would strike the
magnet
Mass Spectrometry
II.The Mass Spectrometer
B.Single Focusing Mass Spectrometer
8. By varying the applied potential difference that
accelerates each ion, different masses can be
discerned by the focusing magnet
9. The detector is basically a counter, that produces
a current proportional to the number of ions that
strike it
10. This data is sent to a computer interface for
graphical analysis of the mass spectrum
Mass Spectrometry
II.The Mass Spectrometer
C.Double Focusing Mass Spectrometer
Resolution of mass is an important consideration for MS
Resolution is defined as R = M/DM, where M is the mass of the particle observed and
DM is the difference in mass between M and the next higher particle that can be observed
Suppose you are observing the mass spectrum of a typical terpene (MW 136) and you
would like to observe integer values of the fragments:
For a large fragment: R = 136 / (135 – 136) = 136
For a smaller fragment: R = 31 / (32 – 31) = 31
Even a low resolution instrument can produce R values of ~2000!
4. If higher resolution is required, the crude separation of ions by a single focusing
MS can be further separated by a double-focusing instrument
Mass Spectrometry
II.The Mass Spectrometer
C.Double Focusing Mass Spectrometer
4. Here, the beam of sorted ions from the focusing
magnet are focused again by an electrostatic
analyzer where the ions of identical mass are
separated on the basis of differences in energy
5. The “cost” of increased resolution is that more
ions are “lost” in the second focusing, so there is
a decrease in sensitivity
Mass Spectrometry
II.The Mass Spectrometer
D.Quadrupole Mass Spectrometer
• Four magnets, hyperbolic in cross section are
arranged ; one pair has an applied direct current,
the other an alternating current
• Only a particular mass ion can “resonate”
properly and reach the detector
Mass Spectrometry
II.The Mass Spectrometer
D.Quadrupole Mass Spectrometer
3. The compact size and speed of the quadrupole
instruments lends them to be efficient and
powerful detectors for gas chromatography (GC)
4. Since the compounds are already vaporized,
only the carrier gas needs to be eliminated for
the process to take place
5. The interface between the GC and MS is shown;
Mass Spectrometry
III.The Mass Spectrum
– Presentation of data
• The mass spectrum is presented in terms of ion
abundance vs. m/e ratio (mass)
• The most abundant ion formed in ionization
gives rise to the tallest peak on the mass
spectrum – this is the base peak
Mass Spectrometry
III.The Mass Spectrum
– Presentation of data
3. All other peak intensities are relative to the base
peak as a percentage
4. If a molecule loses only one electron in the
ionization process, a molecular ion is observed
that gives its molecular weight – this is
designated as M+ on the spectrum M+, m/e 114
Mass Spectrometry
III.The Mass Spectrum
– Presentation of data
5. In most cases, when a molecule loses a valence
electron, bonds are broken, or the ion formed
quickly fragment to lower energy ions
6. The masses of charged ions are recorded as
fragment ions by the spectrometer – neutral
fragments are not recorded !
fragment ions
Mass Spectrometry
III.The Mass Spectrum
B.Determination of Molecular Mass
• When a M+ peak is observed it gives the molecular mass – assuming
that every atom is in its most abundant isotopic form
• Remember that carbon is a mixture of 98.9% 12C (mass 12), 1.1% 13C
(mass 13) and <0.1% 14C (mass 14)
• We look at a periodic table and see the atomic weight of carbon as
12.011 – an average molecular weight
• The mass spectrometer, by its very nature would see a peak at mass 12
for atomic carbon and a M + 1 peak at 13 that would be 1.1% as high
Mass Spectrometry
III.The Mass Spectrum
B.Determination of Molecular Mass
5. Some molecules are highly fragile and M+ peaks are not observed – one
method used to confirm the presence of a proper M+ peak is to lower the
ionizing voltage – lower energy ions do not fragment as readily
6. Three facts must apply for a molecular ion peak:
1) The peak must correspond to the highest mass ion on the spectrum
excluding the isotopic peaks
2) The ion must have an odd number of electrons – usually a radical
cation
3) The ion must be able to form the other fragments on the spectrum
by loss of logical neutral fragments
Mass Spectrometry
III.The Mass Spectrum
B.Determination of Molecular Mass
5. The Nitrogen Rule is another means of confirming the observance of a
molecular ion peak
6. If a molecule contains an even number of nitrogen atoms (only
“common” organic atom with an odd valence) or no nitrogen atoms the
molecular ion will have an even mass value
7. If a molecule contains an odd number of nitrogen atoms, the molecular
ion will have an odd mass value
8. If the molecule contains chlorine or bromine, each with two common
isotopes, the determination of M+ can be made much easier, or much
more complex as we will see
Molecular Formulas – What can be learned from them
Remember and Review!
The Rule of Thirteen – Molecular Formulas from Molecular Mass –
When a molecular mass, M+, is known, a base formula can be generated from the
following equation:
M = n + r
13 13
the base formula being: CnHn + r
For this formula, the HDI can be calculated from the following formula:
HDI = ( n – r + 2 )
2
Molecular Formulas – What can be learned from them
Remember and Review!
The Rule of Thirteen
The following table gives the carbon-hydrogen equivalents and change in HDI for
elements also commonly found in organic compounds:
Element
added
Subtrac
t:
D HDI
(DU in
text)
Element
added
Subtract: D HDI
(DU in text)
C H12 7 35Cl C2H11 3
H12 C -7 79Br C6H7 -3
O CH4 1 F CH7 2
N CH2 1/2 Si C2H4 1
S C2H8 2 P C2H7 2
I C9H19 0
Mass Spectrometry
III.The Mass Spectrum
C. High Resolution Mass Spectrometry
• If sufficient resolution (R > 5000) exists, mass numbers can be recorded to
precise values (6 to 8 significant figures)
• From tables of combinations of formula masses with the natural isotopic
weights of each element, it is often possible to find an exact molecular
formula from HRMS
Example: HRMS gives you a molecular ion of 98.0372; from mass 98 data:
C3H6N4 98.0594
C4H4NO2 98.0242
C4H6N2O 98.0480
C4H8N3 98.0719
C5H6O2 98.0368  gives us the exact formula
C5H8NO 98.0606
C5H10N2 98.0845
C7H14 98.1096
Mass Spectrometry
IV.The Mass Spectrum and Structural
Analysis
– Inferences from Isotopic Ratios
• If a M+ can be observed at sufficient intensity, information leading to a molecular
formula can be attained
• Consider ethane, C2H6 – on this mass spectrum a M+ ion would be observed at 30:
(2 x 12C) + (6 x 1H) = 30
– However, 1.08% of carbon is 13C – there is a 1.08% chance that either
carbon in a bulk sample of ethane is 13C (2 x 1.08% or 2.16%)
– In the mass spectrum we would expect to see a peak at 31 (one of the
carbons being 13C) that was 2.16% of the intensity of the M+ signal - this is
called the M+1 peak
Mass Spectrometry
IV.The Mass Spectrum and Structural Analysis
– Inferences from Isotopic Ratios
5. To calculate the expected M+1 peak for a known molecular formula:
%(M+1) = 100 (M+1) = 1.1 x # of carbon atoms
M + 0.016 x # of hydrogen atoms
+ 0.38 x # of nitrogen atoms…etc.
6. Due to the typical low intensity of the M+ peak, one does not typically “back
calculate” the intensity M+1 peak to attain a formula
7. However if it is observed, it can give a rough estimate of the number of carbon
atoms in the sample:
Example: M+ peak at 78 has a M+1 at 79 that is 7% as intense:
#C x 1.1 = 7%
#C = 7%/1.1 = ~6
Mass Spectrometry
IV.The Mass Spectrum and Structural Analysis
– Inferences from Isotopic Ratios
5. For very large molecules the M+1, M+2, M+3… bands
become very important
The M+2, 3, … peaks become even more prominent and
molecules that contain nothing but the most common
isotopes become rare!
Mass Spectrometry
IV.The Mass Spectrum and Structural Analysis
– Inferences from Isotopic Ratios
5. For very large molecules the M+1, M+2, M+3… bands
become very important
Remarkably, here is the molecular ion(s) of insulin (257
carbon atoms):
Molecules that
are completely
12C are now
rare
Mass Spectrometry
IV.The Mass Spectrum and Structural Analysis
– Inferences from Isotopic Ratios
6. For molecules that contain Cl or Br, the isotopic peaks are
diagnostic
– In both cases the M+2 isotope is prevalent:
 35Cl is 75.77% and 37Cl is 24.23% of naturally occurring
chlorine atoms
 79Br is 50.52% and 81Br is 49.48% of naturally occurring
bromine atoms
a) If a molecule contains a single chlorine atom, the molecular ion
would appear:
m/e
M+
M+2
Mass Spectrometry
IV.The Mass Spectrum and Structural Analysis
– Inferences from Isotopic Ratios
6. For molecules that contain Cl or Br, the isotopic peaks are
diagnostic
c) If a molecule contains a single bromine atom, the molecular ion
would appear:
c) The effects of multiple Cl and Br atoms is additive – your text has
a complete table of the combinations possible with 1-3 of either
atom
7. Sulfur will give a M+2 peak of 4% relative intensity and silicon 3%
m/e
M+ M+2
The M+2 peak
would be about
the size of the M+
if one Br is present
Mass Spectrometry
IV.The Mass Spectrum and Structural Analysis
B.Inferences from M+ - (A summary before moving on…)
• If M+ is visible be sure to test for its validity:
1) The peak must correspond to the highest mass ion on the spectrum
excluding the isotopic peaks
2) The ion must have an odd number of electrons – test with an HDI
calculation
» If the HDI is a whole number the ion is an odd-electron ion
and therefore could be M+
» If the HDI is not a whole number, it suggests that the ion is an
even-electron ion and cannot be a molecular ion.
3) The ion must be able to form the other fragments on the spectrum
by loss of logical neutral fragments
Mass Spectrometry
IV.The Mass Spectrum and Structural Analysis
B.Inferences from M+ - (A summary before moving on…)
2. Using the the M+ peak, make any inferences about the
approximate formula
– Nitrogen Rule
– Rule of Thirteen
– HDI
3. Using the M+1 peak (if visible) make some inference as to
the number of carbon atoms (for small molecules this
works as H, N and O give very low contributions to M+1)
4. If M+2 becomes apparent, analyze for the presence of one
or more Cl or Br atoms (sulfur and silicon can also give
prominent M+2s)
Mass Spectrometry
IV.The Mass Spectrum and Structural Analysis
C.Fragmentation - General
• The collision of a high energy electron with a molecule not
only causes the loss of a valence electron, it imparts some
of the kinetic energy of collision into the remaining ion
• This energy typically resides in an increased vibrational
energy state for the molecule – this energy may be lost by
the molecule breaking into fragments
• The time between ionization and detection in most mass
spectrometer is 10-5 sec.
– If a particular ionized molecule can “hold together” for greater
than 10-5 sec. a M+ ion is observed
Mass Spectrometry
IV.The Mass Spectrum and Structural Analysis
C.Fragmentation - General
4. Due to the low concentration of molecules in the ionization
chamber, all fragmentation processes are unimolecular
5. Fragmentation of a molecule that is missing one electron in
most cases results in a covalent bond breaking
homolytically – one fragment is then missing a full pair of
electrons and has a + charge and the other fragment is a
neutral radical
6. Only the + charged ions will be observed; but the loss of
a neutral fragment is inferred by the difference of the
M+ and the m/e of the fragment
Mass Spectrometry
IV.The Mass Spectrum and Structural Analysis
D.Fragmentation – Chemistry of Ions
• One bond s-cleavages:
a. cleavage of C-C
b. cleavage of C-heteroatom
C C C C+
C Z C Z+
Mass Spectrometry
IV.The Mass Spectrum and Structural Analysis
D.Fragmentation – Chemistry of Ions
• One bond s-cleavages:
c. a-cleavage of C-heteroatom
C C Z C C Z+
C C Z C C Z+
C C Z C Z+ C
Mass Spectrometry
IV.The Mass Spectrum and Structural Analysis
D.Fragmentation – Chemistry of Ions
2. Two bond s-cleavages/rearrangements:
a. Elimination of a vicinal H and heteroatom:
b. Retro-Diels-Alder
C C Z Z+ H
H
C C
+
+
Full mechanism
Abbreviated:
Mass Spectrometry
IV.The Mass Spectrum and Structural Analysis
D.Fragmentation – Chemistry of Ions
2. Two bond s-cleavages/rearrangements:
c. McLafferty Rearrangement
3. Other types of fragmentation are less common, but in specific cases are dominant
processes
These include: fragmentations from rearrangement, migrations, and fragmentation of
fragments
Full mechanism
Abbreviated:
H
+
H
H
+
H
Mass Spectrometry
IV.The Mass Spectrum and Structural Analysis
D.Fragmentation – Chemistry of Ions
4. When deducing any fragmentation scheme:
– The even-odd electron rule applies: “thermodynamics dictates that
even electron ions cannot cleave to a pair of odd electron
fragments”
– Mass losses of 14 are rare
– The order of carbocation/radical stability is
benzyl/3° > allyl/2° > 1° > methyl > H
* the loss of the longest carbon chain is preferred
– Fragment ion stability is more important than fragment radical
stability
Mass Spectrometry
IV.The Mass Spectrum and Structural Analysis
E.Fragmentation Patterns of Groups
Aside: Some nomenclature – rather than explicitly writing out
single bond cleavages each time:
CH2
+ H2C
CH3
57
Fragment
obs. by MS
Neutral fragment
inferred by its loss
– not observedIs written as:
Mass Spectrometry
IV.The Mass Spectrum and Structural Analysis
E.Fragmentation Patterns of Groups
• Alkanes
– Very predictable – apply the lessons of the stability of carbocations
(or radicals) to predict or explain the observation of the fragments
– Method of fragmentation is single bond cleavage in most cases
– This is governed by Stevenson’s Rule – the fragment with the
lowest ionization energy will take on the + charge – the other
fragment will still have an unpaired electron
Example: iso-butane
CH3+
CH3+
Mass Spectrometry
IV.The Mass Spectrum and Structural Analysis
E.Fragmentation Patterns of Groups
• Alkanes
Fragment Ions : n-alkanes
» For straight chain alkanes, a M+ is often observed
» Ions observed: clusters of peaks CnH2n+1 apart from the loss of
–CH3, -C2H5, -C3H7, etc.
» Fragments lost: ·CH3, ·C2H5, ·C3H7, etc.
» In longer chains – peaks at 43 and 57 are the most common
Mass Spectrometry
IV.The Mass Spectrum and Structural Analysis
E.Fragmentation Patterns of Groups
• Alkanes
Example MS: n-alkanes – n-heptane
43
M+
57
Mass Spectrometry
IV.The Mass Spectrum and Structural Analysis
E.Fragmentation Patterns of Groups
• Alkanes
Fragment Ions : branched alkanes
» Where the possibility of forming 2° and 3° carbocations is
high, the molecule is susceptible to fragmentation
» Whereas in straight chain alkanes, a 1° carbocation is always
formed, its appearance is of lowered intensity with branched
structures
» M+ peaks become weak to non-existent as the size and
branching of the molecule increase
» Peaks at 43 and 57 are the most common as these are the iso-
propyl and tert-butyl cations
Mass Spectrometry
IV.The Mass Spectrum and Structural Analysis
E.Fragmentation Patterns of Groups
• Alkanes
Example MS: branched alkanes – 2,2-dimethylhexane
57 M+ 114
Mass Spectrometry
IV.The Mass Spectrum and Structural Analysis
E.Fragmentation Patterns of Groups
• Alkanes
Fragment Ions : cycloalkanes
» Molecular ions strong and commonly observed – cleavage of
the ring still gives same mass value
» A two-bond cleavage to form ethene (C2H4) is common – loss
of 28
» Side chains are easily fragmented
H2C CH2
+
HC C R
H H
H2C CH2
C
H2
n
Mass Spectrometry
IV.The Mass Spectrum and Structural Analysis
E.Fragmentation Patterns of Groups
Alkanes
Example MS: cycloalkanes – cyclohexane
M+ 84
+
M - 28 = 56
Mass Spectrometry
IV.The Mass Spectrum and Structural Analysis
E.Fragmentation Patterns of Groups
• Alkanes
Example MS: cycloalkanes – trans-p-menthane
97
M+ 140
Mass Spectrometry
IV.The Mass Spectrum and Structural Analysis
E.Fragmentation Patterns of Groups
2. Alkenes
– The p-bond of an alkene can absorb substantial energy – molecular
ions are commonly observed
– After ionization, double bonds can migrate readily – determination
of isomers is often not possible
– Ions observed: clusters of peaks CnH2n-1 apart from -C3H5, -C4H7, -
C5H9 etc. at 41, 55, 69, etc.
– Terminal alkenes readily form the allyl carbocation, m/z 41
R
H2
C
+RC
H
CH2 H2C C
H
CH2
Mass Spectrometry
IV.The Mass Spectrum and Structural Analysis
E.Fragmentation Patterns of Groups
2. Alkenes
Example MS: alkenes – cis- 2-pentene
M+ 70
55
Mass Spectrometry
IV.The Mass Spectrum and Structural Analysis
E.Fragmentation Patterns of Groups
2. Alkenes
Example MS: alkenes –1-hexene
M+ 84
41
56
Take home assignment:
What is M-42 and m/z 42?
Mass Spectrometry
IV.The Mass Spectrum and Structural Analysis
E.Fragmentation Patterns of Groups
2. Alkenes
Example MS: alkenes –1-pentene
M+ 70
Take home assignment 2:
What is m/z 42?
Mass Spectrometry
IV.The Mass Spectrum and Structural Analysis
E.Fragmentation Patterns of Groups
Comparison: Alkanes vs. alkenes
Octane (75 eV)
M+ 114
m/z 85, 71, 57, 43 (base), 29
Octene (75 eV)
M+ 112 (stronger @ 75eV than octane)
m/z 83, 69, 55, 41, 29
Mass Spectrometry
IV.The Mass Spectrum and Structural Analysis
E.Fragmentation Patterns of Groups
2. Alkenes
Fragment Ions : cycloalkenes
» Molecular ions strong and commonly observed – cleavage of
the ring still gives same mass value
» Retro-Diels-Alder is significant
observed loss of 28
» Side chains are easily fragmented
+
Mass SpectrometryIV.The Mass Spectrum and Structural Analysis
E.Fragmentation Patterns of Groups
2. Alkenes
Example MS: cycloalkenes –1-methyl-1-cyclohexene
M+ 96
81
68
Mass Spectrometry
IV.The Mass Spectrum and Structural Analysis
E.Fragmentation Patterns of Groups
3. Alkynes – Fragment Ions
– The p-bond of an alkyne can also absorb substantial energy –
molecular ions are commonly observed
– For terminal alkynes, the loss of terminal hydrogen is observed (M-
1) – this may occur at such intensity to be the base peak or
eliminate the presence of M+
– Terminal alkynes form the propargyl cation, m/z 39 (lower
intensity than the allyl cation)
R
H2
C
+RC CH H2C C CH
Mass SpectrometryIV.The Mass Spectrum and Structural Analysis
E.Fragmentation Patterns of Groups
3. Alkynes
Example MS: alkynes – 1-pentyne
M+ 68
H
67H
39
Mass SpectrometryIV.The Mass Spectrum and Structural Analysis
E.Fragmentation Patterns of Groups
3. Alkynes
Example MS: alkynes – 2-pentyne
M+ 68
53
Mass Spectrometry
IV.The Mass Spectrum and Structural Analysis
E.Fragmentation Patterns of Groups
4. Aromatic Hydrocarbons – Fragment Ions
– Very intense molecular ion peaks and little fragmentation of the
ring system are observed
– Where alkyl groups are attached to the ring, a favorable mode of
cleavage is to lose a H-radical to form the C7H7
+ ion (m/z 91)
– This ion is believed to be the tropylium ion; formed from
rearrangement of the benzyl cation
CH2CH3
75 eV e-
Mass Spectrometry
IV.The Mass Spectrum and Structural Analysis
E.Fragmentation Patterns of Groups
4. Aromatic Hydrocarbons – Fragment Ions
d) If a chain from the aromatic ring is sufficiently long, a McLafferty
rearrangement is possible
e) Substitution patterns for aromatic rings are able to be determined
by MS – with the exception of groups that have other ion chemistry
Mass Spectrometry
IV.The Mass Spectrum and Structural Analysis
E.Fragmentation Patterns of Groups
4. Aromatic Hydrocarbons
Example MS: aromatic hydrocarbons – p-xylene
M+ 106
CH3CH3
H3C
m/z 91
Mass SpectrometryIV.The Mass Spectrum and Structural Analysis
E.Fragmentation Patterns of Groups
4. Aromatic Hydrocarbons
Example MS: aromatic hydrocarbons – n -butylbenzene
M+ 134
H H
+
92
91
Mass Spectrometry
IV.The Mass Spectrum and Structural Analysis
E.Fragmentation Patterns of Groups
5. Alcohols– Fragment Ions
– Additional modes of fragmentation will cause lower M+ than for
the corresponding alkanes
1° and 2° alcohols have a low M+, 3° may be absent
b) The largest alkyl group is usually lost; the mode of cleavage
typically is similar for all alcohols:
primary
secondary
OH
H2C
O H+
O H
+
OH O H+
OH
m/z
31
59
45
Mass Spectrometry
IV.The Mass Spectrum and Structural Analysis
E.Fragmentation Patterns of Groups
5. Alcohols– Fragment Ions
c) Dehydration (M - 18) is a common mode of fragmentation –
importance increases with alkyl chain length (>4 carbons)
» 1,2-elimination – occurs from hot surface of ionization
chamber
» 1,4-elimination – occurs from ionization
» both modes give M - 18, with the appearance and possible
subsequent fragmentation of the remaining alkene
d) For longer chain alcohols, a McLafferty type rearrangement can
produce water and ethylene (M - 18, M - 28)
O
HR H O
H
R
H
+
Mass Spectrometry
IV.The Mass Spectrum and Structural Analysis
E.Fragmentation Patterns of Groups
5. Alcohols– Fragment Ions
e) Loss of H is not favored for alkanols (M – 1)
f) Cyclic alcohols fragment by similar pathways
» a-cleavage
» dehydration
OHH OHH
H
OHH
H
OHH
+
OHH
, + H2O
m/z 57
M - 18
Mass Spectrometry
IV.The Mass Spectrum and Structural Analysis
E.Fragmentation Patterns of Groups
5. Alcohols
Example MS: alcohols – n -pentanol
M+ 88
-H2O
70OH
31
OH
H OH
H
+
42
Mass Spectrometry
IV.The Mass Spectrum and Structural Analysis
E.Fragmentation Patterns of Groups
5. Alcohols
Example MS: alcohols – 2-pentanol
M+ 88
OH
45
Mass Spectrometry
IV.The Mass Spectrum and Structural Analysis
E.Fragmentation Patterns of Groups
5. Alcohols
Example MS: alcohols – 2-methyl-2-pentanol
M+ 102
87
OH
OH
59
Mass SpectrometryIV.The Mass Spectrum and Structural Analysis
E.Fragmentation Patterns of Groups
5. Alcohols
Example MS: alcohols – cyclopentanol
M+ 86
OHH OHH
+
57
Mass Spectrometry
IV.The Mass Spectrum and Structural Analysis
E.Fragmentation Patterns of Groups
6. Phenols– Fragment Ions
– Do not fully combine observations for aromatic + alcohol; treat as a
unique group
b) For example, loss of H· is observed (M – 1) – charge can be
delocalized by ring – most important for rings with EDGs
c) Loss of CO (extrusion) is commonly observed (M – 28); Net loss
of the formyl radical (HCO·, M – 29) is also observed from this
process O
H
O
H
H
O
C
O
-CO -H
Mass Spectrometry
IV.The Mass Spectrum and Structural Analysis
E.Fragmentation Patterns of Groups
5. Example MS: phenols – phenol
M+ 94
-CO 66
-HCO 65
Mass SpectrometryIV.The Mass Spectrum and Structural Analysis
E.Fragmentation Patterns of Groups
An interesting combination of functionalities: benzyl alcohols
Upon ring expansion to tropylium ions, they become
phenols!
M+ 108
77
M – 1, 107
“tropyliol”
HO
H H
+
“tropyliol” - CO
79
+ H2
OH
Mass Spectrometry
IV.The Mass Spectrum and Structural Analysis
E.Fragmentation Patterns of Groups
7. Ethers– Fragment Ions
– Slightly more intense M+ than for the corresponding alcohols or
alkanes
b) The largest alkyl group is usually lost to a-cleavage; the mode of
cleavage typically is similar to alcohols:
c) Cleavage of the C-O bond to give carbocations is observed where
favorable
R
H2
C O R R H2C O R+
R
H
C O R R CH O R
RR
+
Mass Spectrometry
IV.The Mass Spectrum and Structural Analysis
E.Fragmentation Patterns of Groups
7. Ethers– Fragment Ions
d) Rearrangement can occur of the following type, if a-carbon is
branched:
e) Aromatic ethers, similar to phenols can generate the C6H5O+ ion by
loss of the alkyl group rather than H; this can expel CO as in the
phenolic degradation
R C O C R C
HH
R
CH2
H
H
O
H
R
+
O
R
O
R + C O + C5H5
+
Mass Spectrometry
IV.The Mass Spectrum and Structural Analysis
E.Fragmentation Patterns of Groups
7. Example MS: ethers – butyl methyl ether
M+ 88
O
45
Mass Spectrometry
IV.The Mass Spectrum and Structural Analysis
E.Fragmentation Patterns of Groups
7. Example MS: ethers – anisole
M+ 108
O
93
M-28 (-CH3, -CO)
65
O
77
Take home – what is m/z 78?
Mass Spectrometry
IV.The Mass Spectrum and Structural Analysis
E.Fragmentation Patterns of Groups
8. Aldehydes - Fragment Ions
– Weak M+ for aliphatic, strong M+ for aromatic aldehydes
b) a-cleavage is characteristic and often diagnostic for aldehydes –
can occur on either side of the carbonyl
c) b-cleavage is an additional mode of fragmentation
R H
O
R C O + H
R H
O
H C O+R
M-1 peak
m/z 29
H
O
+RR
H
O
m/z R+
M - 41
can be R-subs.
Mass Spectrometry
IV.The Mass Spectrum and Structural Analysis
E.Fragmentation Patterns of Groups
8. Aldehydes - Fragment Ions
d) McLafferty rearrangement observed if g-Hs present
e) Aromatic aldehydes – a-cleavages are more favorable, both to lose
H· (M - 1) and HCO· (M – 29)
m/z 44
m/z R+
Remember:
aromatic ring can
be subs.
+
O
H
HR
O
HR
C O + H
H
O
O
H
+
O
H
Mass Spectrometry
IV.The Mass Spectrum and Structural Analysis
E.Fragmentation Patterns of Groups
8. Example MS: aldehydes (aliphatic) – pentanal
M+ 86
M-1
85
H
C
O
29
+
O
H
H
O
H
m/z 44
Mass Spectrometry
IV.The Mass Spectrum and Structural Analysis
E.Fragmentation Patterns of Groups
8. Example MS: aldehydes (aromatic) – m-tolualdehyde
M+ 120
M-1
119
O
H
91
Mass Spectrometry
IV.The Mass Spectrum and Structural Analysis
E.Fragmentation Patterns of Groups
9. Ketones - Fragment Ions
– Strong M+ for aliphatic and aromatic ketones
b) a-cleavage can occur on either side of the carbonyl – the larger
alkyl group is lost more often
c) b-cleavage is not as important of a fragmentation mode for ketones
compared to aldehydes – but sometimes observed
R R1
O
R C O + R1
R1 is larger than R
M – 15, 29, 43…
m/z 43, 58, 72, etc.
R1
O
+RR
R1
O
Mass Spectrometry
IV.The Mass Spectrum and Structural Analysis
E.Fragmentation Patterns of Groups
9. Ketones - Fragment Ions
d) McLafferty rearrangement observed if g-H’s present – if both alkyl
chains are sufficiently long – both can be observed
e) Aromatic ketones – a-cleavages are favorable primarily to lose R·
(M – 15, 29…) to form the C6H5CO+ ion, which can lose CO
Remember:
aromatic ring can
be subs.
+
O
R1
HR
O
HR
R1
C O + R
O
R
+ C O
m/z 105
Mass Spectrometry
IV.The Mass Spectrum and Structural Analysis
E.Fragmentation Patterns of Groups
9. Ketones - Fragment Ions
f) cyclic ketones degrade in a similar fashion to cycloalkanes and
cycloalkanols:
O
H
O
H
O
+
O
O O O
+
- CO
m/z 55
m/z 42
m/z 70
Mass Spectrometry
IV.The Mass Spectrum and Structural Analysis
E.Fragmentation Patterns of Groups
9. Example MS: ketones (aliphatic) – 2-pentanone
M+ 86
M-15
O
43
O
H
O
H
+
58
Mass Spectrometry
IV.The Mass Spectrum and Structural Analysis
E.Fragmentation Patterns of Groups
9. Example MS: ketones (aromatic) – propiophenone
M+ 134
C O
O
m/z 105
m/z 77
Mass Spectrometry
IV.The Mass Spectrum and Structural Analysis
E.Fragmentation Patterns of Groups
10. Esters - Fragment Ions
– M+ weak in most cases, aromatic esters give a stronger peak
b) Most important a-cleavage reactions involve loss of the alkoxy-
radical to leave the acylium ion
c) The other a-cleavage (most common with methyl esters, m/z 59)
involves the loss of the alkyl group
R
R1
O
R C O + OR1
O
R
R1
O
R C
O
+
O
O R1
Mass Spectrometry
IV.The Mass Spectrum and Structural Analysis
E.Fragmentation Patterns of Groups
10. Esters - Fragment Ions
d) McLafferty occurs with sufficiently long esters
e) Ethyl and longer (alkoxy chain) esters can undergo the McLafferty
rearrangement
R1
O
+
O
H
R1
O
O
H
R
O
+
O R
O
O
HH
Mass Spectrometry
IV.The Mass Spectrum and Structural Analysis
E.Fragmentation Patterns of Groups
10. Esters - Fragment Ions
f) The most common fragmentation route is to lose the alkyl group by
a-cleavage, to form the C6H5CO+ ion (m/z 105)
R
O
RO
C
O
+
Can lose CO to
give m/z 77
Mass Spectrometry
IV.The Mass Spectrum and Structural Analysis
E.Fragmentation Patterns of Groups
10. Esters - Fragment Ions
g) One interesting fragmentation is shared by both benzyloxy esters
and aromatic esters that have an ortho-alkyl group
O
O
H
OH
fragmentation
+
CH2
C
O
ketene
O
R
O
C
H2
H
C
HO
R
O
CH2
+
benzyloxy ester
ortho-alkylbenzoate ester
Mass Spectrometry
IV.The Mass Spectrum and Structural Analysis
E.Fragmentation Patterns of Groups
10. Example MS: esters (aliphatic) – ethyl butyrate
M+ 116
both McLafferty
(take home exercise)
m/z 88
O
O
71
O
O
43
O
O
29
Mass Spectrometry
IV.The Mass Spectrum and Structural Analysis
E.Fragmentation Patterns of Groups
10. Example MS: esters (aliphatic) – ethyl butyrate
M+ 116
both McLafferty
(take home exercise)
m/z 88
O
O
71
O
O
43
O
O
29
Mass Spectrometry
IV.The Mass Spectrum and Structural Analysis
E.Fragmentation Patterns of Groups
10. Example MS: esters (benzoic) – methyl ortho-toluate
M+ 150
C
O
CH2
O
O
119
O
O
91
m/z 118
Mass Spectrometry
IV.The Mass Spectrum and Structural Analysis
E.Fragmentation Patterns of Groups
11. Carboxylic Acids - Fragment Ions
– As with esters, M+ weak in most cases, aromatic acids give a
stronger peak
b) Most important a-cleavage reactions involve loss of the alkoxy-
radical to leave the acylium ion
c) The other a-cleavage (less common) involves the loss of the alkyl
radical. Although less common, the m/z 45 peak is somewhat
diagnostic for acids.
R
H
O
R C O + OH
O
R
H
O
R C
O
+
O
O H
Mass Spectrometry
IV.The Mass Spectrum and Structural Analysis
E.Fragmentation Patterns of Groups
11. Carboxylic Acids - Fragment Ions
d) McLafferty occurs with sufficiently long acids
e) aromatic acids degrade by a process similar to esters, loss of the
HO· gives the acylium ion which can lose CO:
H
O
+
O
H
H
O
O
H
m/z 60
H
O
HO
C
O
+
+ further loss of
CO to m/z 77
Mass Spectrometry
IV.The Mass Spectrum and Structural Analysis
E.Fragmentation Patterns of Groups
11. Carboxylic Acids - Fragment Ions
f) As with esters, those benzoic acids with an ortho-alkyl group will
lose water to give a ketene radical cation
O
H
O
C
H2
H
C
HO
H
O
CH2
+
ortho-alkylbenzoic acid
Mass Spectrometry
IV.The Mass Spectrum and Structural Analysis
E.Fragmentation Patterns of Groups
11. Example MS: carboxylic acids (aliphatic) – pentanoic
acid
M+ 102
O
OH
H
OH
OH
m/z 60
Mass Spectrometry
IV.The Mass Spectrum and Structural Analysis
E.Fragmentation Patterns of Groups
11. Example MS: carboxylic acids (aromatic) – p-toluic acid
M+ 136
OH
O
119
OH
O
91
Mass Spectrometry
IV.The Mass Spectrum and Structural Analysis
E.Fragmentation Patterns of Groups
Summary – Carbonyl Compounds
For carbonyl compounds – there are 4 common modes of
fragmentation:
 A1 & A2 -- two a-cleavages
 B -- b-cleavage
 C – McLafferty Rearrangement
O
G
R
O
G
R +
O
G
R H
O
G
R H
+
R
O
G O C G2 + R
OCR + G
R
O
G
Mass Spectrometry
IV.The Mass Spectrum and Structural Analysis
E.Fragmentation Patterns of Groups
Summary – Carbonyl Compounds
In tabular format:
m/z of ion observed
Fragmentation Path
Aldehydes
G = H
Ketones
G = R
Esters
G = OR’
Acids
G = OH
Amides
G = NH2
A1
a-cleavage
- R 29 43b 59b 45 44d
A2
a-cleavage
- G 43b 43b 43b 43b 43b
B
b-cleavage
- G 43a 57b 73b 59a 58a
C
McLafferty
44a 58b,c 74b,c 60a 59a
b = base, add other mass attached to this chain
a = base, if a-carbon branched, add appropriate mass
c = sufficiently long structures can undergo on either side of C=O
d = if N-substituted, add appropriate mass
Mass Spectrometry
IV.The Mass Spectrum and Structural Analysis
E.Fragmentation Patterns of Groups
12. Amines - Fragment Ions
– Follow nitrogen rule – odd M+, odd # of nitrogens; nonetheless, M+
weak in aliphatic amines
b) a-cleavage reactions are the most important fragmentations for
amines; for 1° n-aliphatic amines m/z 30 is diagnostic
c) McLafferty not often observed with amines, even with sufficiently
long alkyl chains
d) Loss of ammonia (M – 17) is not typically observed
R
C
N R
C
N+
Mass Spectrometry
IV.The Mass Spectrum and Structural Analysis
E.Fragmentation Patterns of Groups
12. Amines - Fragment Ions
e) Mass spectra of cyclic amines is complex and varies with ring size
f) Aromatic amines have intense M+
g) Loss of a hydrogen atom, followed by the expulsion of HCN is
typical for anilines
h) Pyridines have similar stability (strong M+, simple MS) to
aromatics, expulsion of HCN is similar to anilines
NH2 NH
+ H
H H
+ HCN
H
+ H
Mass Spectrometry
IV.The Mass Spectrum and Structural Analysis
E.Fragmentation Patterns of Groups
12. Example MS: amines, 1° – pentylamine
M+ 87
NH2
30
Mass Spectrometry
IV.The Mass Spectrum and Structural Analysis
E.Fragmentation Patterns of Groups
12. Example MS: amines, 2° – dipropylamine
M+ 101
N
H
72
N
H
H
Mass Spectrometry
IV.The Mass Spectrum and Structural Analysis
E.Fragmentation Patterns of Groups
12. Example MS: amines, 3° – tripropylamine
M+ 143
N
114
Mass Spectrometry
IV.The Mass Spectrum and Structural Analysis
E.Fragmentation Patterns of Groups
13. Amides - Fragment Ions
– Follow nitrogen rule – odd M+, odd # of nitrogens; observable M+
b) a-cleavage reactions afford a specific fragment of m/z 44 for
primary amides
c) McLafferty observed where g-hydrogens are present
R
C
NH2
O
R + O C NH2
m/z 44
O
NH2
H
O
NH2
H
+
Mass Spectrometry
IV.The Mass Spectrum and Structural Analysis
E.Fragmentation Patterns of Groups
13. Example MS: amides – butyramide
M+ 87
C
NH2
O
44
O
NH2
H
59
Mass Spectrometry
IV.The Mass Spectrum and Structural Analysis
E.Fragmentation Patterns of Groups
13. Example MS: amides (aromatic) – benzamide
M+ 121
C
NH2O
77
C
NH2O
105
Mass Spectrometry
IV.The Mass Spectrum and Structural Analysis
E.Fragmentation Patterns of Groups
14. Nitriles - Fragment Ions
– Follow nitrogen rule – odd M+, odd # of nitrogens; weak M+
b) Principle degradation is the loss of an H-atom (M – 1) from a-
carbon:
c) Loss of HCN observed (M – 27)
d) McLafferty observed where g-hydrogens are present
H +R
H2
C C N R C
H
C N
C
N
H
H2C
C
N
H
+
m/z 41
Mass Spectrometry
IV.The Mass Spectrum and Structural Analysis
E.Fragmentation Patterns of Groups
14. Example MS: nitriles – propionitrile
M+ 55
M-1 54
- HCN
Mass Spectrometry
IV.The Mass Spectrum and Structural Analysis
E.Fragmentation Patterns of Groups
14. Example MS: nitriles – valeronitrile (pentanenitrile)
M+ 83
H2C
C
N
H
m/z 41
C
N
43
C
N
54
Mass Spectrometry
IV.The Mass Spectrum and Structural Analysis
E.Fragmentation Patterns of Groups
15. Nitro - Fragment Ions
– Follow nitrogen rule – odd M+, odd # of nitrogens; M+ almost
never observed, unless aromatic
b) Principle degradation is loss of NO+ (m/z 30) and NO2
+ (m/z 46)
R N
O
O
R N
O
O
+
m/z 46
+
m/z 30
R N
O
O
R N
O
O
R O N O R O N O
Mass Spectrometry
IV.The Mass Spectrum and Structural Analysis
E.Fragmentation Patterns of Groups
15. Nitro - Fragment Ions
c) Aromatic nitro groups show these peaks as well as the fragments of
the loss of all or parts of the nitro groupNO2 O
+ NO + CO
NO2
+ NO2 + HC CHC4H3
m/z 93 m/z 65
m/z 77 m/z 51
Mass Spectrometry
IV.The Mass Spectrum and Structural Analysis
E.Fragmentation Patterns of Groups
15. Example MS: nitro – 1-nitropropane
M+ 89NO2
+ 46NO+ 30
NO2
43
Mass Spectrometry
IV.The Mass Spectrum and Structural Analysis
E.Fragmentation Patterns of Groups
15. Example MS: nitro (aromatic) – p-nitrotoluene
M+ 137
O
m/z 107
91
NO2
C5H5
+
Mass Spectrometry
IV.The Mass Spectrum and Structural Analysis
E.Fragmentation Patterns of Groups
16. Halogens - Fragment Ions
– Halogenated compounds often give good M+
– Fluoro- and iodo-compounds do not have appreciable contribution
from isotopes
– Chloro- and bromo-compounds are unique in that they will show
strong M+2 peaks for the contribution of higher isotopes
– For chlorinated compounds, the ratio of M+ to M+2 is about 3:1
– For brominated compounds, the ratio of M+ to M+2 is 1:1
– An appreciable M+4, 6, … peak is indicative of a combination of
Mass Spectrometry
IV.The Mass Spectrum and Structural Analysis
E.Fragmentation Patterns of Groups
16. Halogens - Fragment Ions
g) Principle fragmentation mode is to lose halogen atom, leaving a
carbocation – the intensity of the peak will increase with cation
stability
h) Leaving group ability contributes to the loss of halogen most
strongly for -I and -Br less so for -Cl, and least for –F
i) Loss of HX is the second most common mode of fragmentation –
here the conjugate basicity of the halogen contributes (HF > HCl >
HBr > HI)
R + XR X
R +C XCR
H
H H
H
C
H
CH2 H X
Mass Spectrometry
IV.The Mass Spectrum and Structural Analysis
E.Fragmentation Patterns of Groups
16. Halogens - Fragment Ions
j) Less often, a-cleavage will occur:
k) For longer chain halides, the expulsion of a >d carbon chain as the
radical is observed
l) Aromatic halides give stronger M+, and typically lose the halogen
atom to form C6H5
+
R +C X
H
H
H2C XR
R+
R
X X
Mass Spectrometry
IV.The Mass Spectrum and Structural Analysis
E.Fragmentation Patterns of Groups
16. Example MS: chlorine – 1-chloropropane
M+ 78m/z 49, 51
43
Cl
H2C Cl
M+2
Mass Spectrometry
IV.The Mass Spectrum and Structural Analysis
E.Fragmentation Patterns of Groups
16. Example MS: chlorine – p-chlorotoluene
M+ 126
M+2
91
Cl
Mass Spectrometry
IV.The Mass Spectrum and Structural Analysis
E.Fragmentation Patterns of Groups
16. Example MS: bromine – 1-bromobutane
M+ 136
M+2
57
Br
H2C Br
Mass Spectrometry
IV.The Mass Spectrum and Structural Analysis
E.Fragmentation Patterns of Groups
16. Example MS: bromine – p-bromotoluene
M+ 170
M+2
91
Br
Mass Spectrometry
IV.The Mass Spectrum and Structural Analysis
E.Fragmentation Patterns of Groups
16. Example MS: multiple bromines – 3,4-dibromotoluene
M+ 248
M+4
M+2
169,
171
Br
Br
90
Br
Br
Mass Spectrometry
IV.The Mass Spectrum and Structural Analysis
E.Fragmentation Patterns of Groups
16. Example MS: iodine – iodobenzene
M+ 204
77
I
Mass Spectrometry
IV.The Mass Spectrum and Structural Analysis
F.Approach to analyzing a mass spectrum
• As with IR, get a general feel for the spectrum before you
analyze anything – is it simple, complex, groups of peaks,
etc.
• Squeeze everything you can out of the M+ peak that you can
(once you have confirmed it is the M+)
– Strong or Weak?
– Isotopes? M+1? M+2, 4, …
– Apply the Nitrogen rule
– Apply the Rule of Thirteen to generate possible formulas (you can
quickly dispose of possibilities based on the absence of isotopic
peaks or the inference of the nitrogen rule)
– Use the HDI from the Rule of Thirteen to further reduce the
possibilities
Mass Spectrometry
IV.The Mass Spectrum and Structural Analysis
F.Approach to analyzing a mass spectrum
3. Squeeze everything you can out of the base peak
– What ions could give this peak? (m/z 43 doesn’t help much)
– What was lost from M+ to give this peak?
– When considering the base peak initially, only think of the most
common cleavages for each group
4. Look for the loss of small neutral molecules from M+
– H2C=CH2, HCCH, H2O, HOR, HCN, HX
5. Now consider the possible diagnostic peaks on the spectrum
(e.g.: 29, 30, 31, 45, 59, 77, 91, 105 etc.)
6. Lastly, once you have a hypothetical molecule that explains
Mass Spectrometry
Ionization to Radical Cation
Molecular Ion (m+)
Glossary
• Molecular ion - The ion obtained by the loss of
one electron from the molecule (m+)
• Base peak - The most intense peak in the MS,
assigned 100% intensity
• Radical cation - positively charged species with
an odd number of electrons
• Fragment ions - Lighter cations (and radical
cations) formed by the decomposition of the
molecular ion. These often correspond to stable
carbcations.
• m/z - mass to charge ratio
The Mass Spectrum
Masses are graphed or tabulated according to their
relative abundance.
=>
Mass Spectrum
with Sulfur
=>
Mass Spectrum
with Chlorine
=>
Mass Spectrum
with Bromine
=>
Mass Spectra
of Alkanes
More stable carbocations will be more
abundant.
=>
Mass Spectra
of Alkenes
Resonance-stabilized cations favored.
=>
Methanol
Octane, m+ = 114
CH3CH2CH2CH2CH2CH2CH2CH3
m+ = 114
-15
-29
-43
-57
-71 (base)
m-29
m-43
m-57
m-71
Base peak
m+
Isooctane, no molecular ion
CH3CCH2CHCH3
CH3
CH3
CH3
m+ = 114
loss of
(isobutyl)
.
CH3C
CH3
CH3
+
m/z = 57
Decane
2-Methylpentane
Effect of Branching in
Hydrocarbons
Isotopes
• Mass spectrometers are capable of separating and
detecting individual ions even those that only differ by
a single atomic mass unit.
• As a result molecules containing different isotopes can
be distinguished.
• This is most apparent when atoms such as bromine or
chlorine are present (79Br : 81Br, intensity 1:1 and 35Cl :
37Cl, intensity 3:1) where peaks at "M" and "M+2" are
obtained.
• The intensity ratios in the isotope patterns are due to
the natural abundance of the isotopes.
• "M+1" peaks are seen due the the presence of 13C in
the sample.
Bromomethane
1-Bromopropane
2-Chloropropane
(3-Chloropropyl)benzene
CH2 CH2CH2Cl
base peak m/e 91 (m-63)
Chloroacetone
CH3CCH2Cl
O
m+ = 92
m+2 = 94
- Cl
- CH3
- CH2Cl
.
.
.
O
CH3CCH2
O
CCH2Cl
O
CH3C
+
+
+
m/z = 57
m/z = 77,79
m/z = 43 (base)(3:1 ratio)
3-Pentanone C
O
CH2CH3CH3CH2
+
m/z = 86
.
CH2CH3
.
CH3CH2C=O
+
loss of
m/z = 57
m+
m-29
base
2-Pentanone C
O
CH2CH2CH3CH3
+
m/z = 86
.
CH2CH2CH3
.
CH3C=O
+
loss of
m/z = 43
m-43
base
m-15
m+
(E) 2-Hexene
2-methyl-2-pentene
and
2-hexene
1-Butanol
CH3CH2CH2CH2OH
+.
m+ = 74
- H2O
CH3CH2CH CH2
+
.
m/z= 56
CH2OH CH2=OH
++
m/z = 31 m-18
1o Alcohols: Loss of H2O
Toluene
CH3
+.
m/z = 92
loss of H
. CH2
m/z = 91
+
+
tropylium ion
m+
m-1
Propylbenzene
CH2CH2CH3
+.
loss of
CH2CH3
.
CH2
+
+
m/z = 91m/z = 120
m+
m-29
Isopropylbenzene
C
H3C CH3
H
+.
loss of
CH3
.
CHCH3
+ CH3
+
m/z = 105m/z = 120
m+
m-15
n-Butylbenzene
m/e 91
m/e 92
CH2CH2CH2CH3
3-Methyl-1-penten-3-ol
OH
m/z = 71
m+
4-Methyl-1-penten-3-ol
OH
m+
m/z = 57
McLafferty Rearrangement
link to SDBS
H
O
Hm+ = 86
+.
O
H
H
a
b
g
.+
O
H
H
.+
m/z = 44
+
H transfer from gcarbon
results in loss of a neutral alkene
McLafferty Rearrangements in
Alkyl Benzenes
g
b
a
CH2
CH2
CHCH3
H
m+ 134
loss of CH3CH=CH2
.+
CH2
H
H
+.
m/e 92
CH2
+
m/e 91
- propyl
.
Benzamide
2-Octanone
O
H
m+ = 128
O
+.
+
loss of
C6H13
.
m/z = 43
loss of pentene
O
H
.+
m/z = 58
via McLafferty
a
b
g
2-Octanone
O
H
m+ = 128
O
+.
+
loss of
C6H13
.
m/z = 43
loss of pentene
O
H
.+
m/z = 58
via McLafferty
a
b
g
Decanoic Acid
p-Chloroacetophenone
Methyl Octanoate
2,4-Dimethoxyacetophenone
Cyclohexanone
High Resolution Mass Spectrometry
Determination of Molecular Formula
CO
N2
C2H4
CH2N
all show m+ at 28
CO 27.9949
N2 28.0062
C2H4 28.0312
CH2N 28.0187
exact mass
Isotope Ratios Can Help to
Determine Molecular Formula
Relative intensities (%)
MF MW M M+1 M+2
CO 28.0 100 1.12 0.2
N2 28.0 100 0.76 ----
C2H4 28.0 100 2.23 0.01
Comparisons of Molecular Weights
and Precise Masses
MF MW exact mass
C3H8O 60.1 60.05754
C2H8N2 60.1 60.06884
C2H4O2 60.1 60.02112
CH4N2O 60.1 60.03242
Determine the Formula
fragment finder
Molecular mass m+1 m+2
110 111 112
rel. intensity (%) 100 6.96 0.60
exact mass = 110.0376
Determine the Formula
Molecular mass m+1 m+2
118 119 120
rel. intensity (%) 100 7.45 4.55
Subtract Sulfur’s contribution
fragment finder
Molecular mass m+1 m+2
118 119 120
rel. intensity (%) 100 7.45 4.55
subtract sulfur (32)
86 87 88
100 6.67 0.15
Determine the Molecular
Formula
Molecular mass m+1 m+2
154 155 156
rel. intensity (%) 100 15.41 3.77
Compound gives four signals in
the C-13 NMR spectrum
Molecular mass m+1 m+2 m+4
190 191 192 194
rel. intensity (%) 100 6.48 130.77 31.81

Mass spectrometry detail to up

  • 1.
  • 2.
    Mass Spectrometry • Molecularweight can be obtained from a very small sample. • It does not involve the absorption or emission of light. • A beam of high-energy electrons breaks the molecule apart. • The masses of the fragments and their relative abundance reveal information about the structure of the molecule.
  • 3.
    Mass Spectrometry THE MAINUSE OF MS IN ORG CHEM IS: • DETERMINE THE MOLECULAR MASS OF ORGANIC COMPOUNDS • DETERMINE THE MOLECULAR FORMULA OF ORGANIC COMPOUNDS
  • 4.
    HOW DO WEACHIEVE THIS? • PERSUADE THE MOLECULE TO ENTER THE VAPOR PHASE (CAN BE DIFFICULT) • PRODUCE IONS FROM THE MOLECULES THAT ENTER THE GAS PHASE • SEPARATE THE IONS ACCORDING TO THEIR MASS-TO-CHARGE RATIOS (m/z)) • MEASURE AND RECORD THESE IONS
  • 5.
    IONIZING METHODS • ELECTRONIMPACT - HIGH ENERGY ELECTRONS ABOUT 70 EV!! • CHEMICAL IONIZATION LOW ENERGY
  • 6.
    ELECTRON IMPACT RADICAL CATION ONLYCATIONS ARE CARRIED TO DETECTOR BOND-BREAKING
  • 7.
    Electron Impact Ionization Ahigh-energy electron can dislodge an electron from a bond, creating a radical cation (a positive ion with an unpaired e-). e- + H C H H C H H H H C H H C H H H H C H H C H H + H H C H H C H H H + =>
  • 8.
    Separation of Ions •Only the cations are deflected by the magnetic field. • Amount of deflection depends on m/z. • The detector signal is proportional to the number of ions hitting it. • By varying the magnetic field, ions of all masses are collected and counted. =>
  • 9.
    The GC-MS => A mixtureof compounds is separated by gas chromatography, then identified by mass spectrometry.
  • 10.
    High Resolution MS •Masses measured to 1 part in 20,000. • A molecule with mass of 44 could be C3H8, C2H4O, CO2, or CN2H4. • If a more exact mass is 44.029, pick the correct structure from the table: C3H8 C2H4O CO2 CN2H4 44.06260 44.02620 43.98983 44.03740 =>
  • 11.
    Molecules with Heteroatoms • Isotopes:present in their usual abundance. • Hydrocarbons contain 1.1% C-13, so there will be a small M+1 peak. • If Br is present, M+2 is equal to M+. • If Cl is present, M+2 is one-third of M+. • If iodine is present, peak at 127, large gap. • If N is present, M+ will be an odd number. • If S is present, M+2 will be 4% of M+. =>
  • 12.
  • 13.
    Mass Spectrometry • Introduction –General overview • Mass Spectrometry is the generation, separation and characterization of gas phase ions according to their relative mass as a function of charge • Previously, the requirement was that the sample be able to be vaporized (similar limitation to GC), but modern ionization techniques allow the study of such non-volatile molecules as proteins and nucleotides
  • 14.
    Mass Spectrometry II.The MassSpectrometer – General Schematic • A mass spectrometer needs to perform three functions: • Creation of ions – the sample molecules are subjected to a high energy beam of electrons, converting some of them to ions • Separation of ions – as they are accelerated in an electric field, the ions are separated according to mass-to-charge ratio (m/z) • Detection of ions – as each separated population of ions is generated, the spectrometer needs to qualify and quantify them
  • 15.
    Mass Spectrometry II.The MassSpectrometer B.Single Focusing Mass Spectrometer • A small quantity of sample is injected and vaporized under high vacuum • The sample is then bombarded with electrons having 25-80 eV of energy • A valence electron is “punched” off of the molecule, and an ion is formed
  • 16.
    Mass Spectrometry II. TheMass Spectrometer B. The Single Focusing Mass Spectrometer 4. Ions (+) are accelerated using a (-) anode towards the focusing magnet 5. At a given potential (1 – 10 kV) each ion will have a kinetic energy: ½ mv2 = eV As the ions enter a magnetic field, their path is curved; the radius of the curvature is given by: r = mv eH If the two equations are combined to factor out velocity: m/e = H2r2 m = mass of ion v = velocity V = potential difference e = charge on ion H = strength of magnetic field r = radius of ion path
  • 17.
    Mass Spectrometry II.The MassSpectrometer B.Single Focusing Mass Spectrometer 6. At a given potential, only one mass would have the correct radius path to pass through the magnet towards the detector 7. “Incorrect” mass particles would strike the magnet
  • 18.
    Mass Spectrometry II.The MassSpectrometer B.Single Focusing Mass Spectrometer 8. By varying the applied potential difference that accelerates each ion, different masses can be discerned by the focusing magnet 9. The detector is basically a counter, that produces a current proportional to the number of ions that strike it 10. This data is sent to a computer interface for graphical analysis of the mass spectrum
  • 19.
    Mass Spectrometry II.The MassSpectrometer C.Double Focusing Mass Spectrometer Resolution of mass is an important consideration for MS Resolution is defined as R = M/DM, where M is the mass of the particle observed and DM is the difference in mass between M and the next higher particle that can be observed Suppose you are observing the mass spectrum of a typical terpene (MW 136) and you would like to observe integer values of the fragments: For a large fragment: R = 136 / (135 – 136) = 136 For a smaller fragment: R = 31 / (32 – 31) = 31 Even a low resolution instrument can produce R values of ~2000! 4. If higher resolution is required, the crude separation of ions by a single focusing MS can be further separated by a double-focusing instrument
  • 20.
    Mass Spectrometry II.The MassSpectrometer C.Double Focusing Mass Spectrometer 4. Here, the beam of sorted ions from the focusing magnet are focused again by an electrostatic analyzer where the ions of identical mass are separated on the basis of differences in energy 5. The “cost” of increased resolution is that more ions are “lost” in the second focusing, so there is a decrease in sensitivity
  • 21.
    Mass Spectrometry II.The MassSpectrometer D.Quadrupole Mass Spectrometer • Four magnets, hyperbolic in cross section are arranged ; one pair has an applied direct current, the other an alternating current • Only a particular mass ion can “resonate” properly and reach the detector
  • 22.
    Mass Spectrometry II.The MassSpectrometer D.Quadrupole Mass Spectrometer 3. The compact size and speed of the quadrupole instruments lends them to be efficient and powerful detectors for gas chromatography (GC) 4. Since the compounds are already vaporized, only the carrier gas needs to be eliminated for the process to take place 5. The interface between the GC and MS is shown;
  • 23.
    Mass Spectrometry III.The MassSpectrum – Presentation of data • The mass spectrum is presented in terms of ion abundance vs. m/e ratio (mass) • The most abundant ion formed in ionization gives rise to the tallest peak on the mass spectrum – this is the base peak
  • 24.
    Mass Spectrometry III.The MassSpectrum – Presentation of data 3. All other peak intensities are relative to the base peak as a percentage 4. If a molecule loses only one electron in the ionization process, a molecular ion is observed that gives its molecular weight – this is designated as M+ on the spectrum M+, m/e 114
  • 25.
    Mass Spectrometry III.The MassSpectrum – Presentation of data 5. In most cases, when a molecule loses a valence electron, bonds are broken, or the ion formed quickly fragment to lower energy ions 6. The masses of charged ions are recorded as fragment ions by the spectrometer – neutral fragments are not recorded ! fragment ions
  • 26.
    Mass Spectrometry III.The MassSpectrum B.Determination of Molecular Mass • When a M+ peak is observed it gives the molecular mass – assuming that every atom is in its most abundant isotopic form • Remember that carbon is a mixture of 98.9% 12C (mass 12), 1.1% 13C (mass 13) and <0.1% 14C (mass 14) • We look at a periodic table and see the atomic weight of carbon as 12.011 – an average molecular weight • The mass spectrometer, by its very nature would see a peak at mass 12 for atomic carbon and a M + 1 peak at 13 that would be 1.1% as high
  • 27.
    Mass Spectrometry III.The MassSpectrum B.Determination of Molecular Mass 5. Some molecules are highly fragile and M+ peaks are not observed – one method used to confirm the presence of a proper M+ peak is to lower the ionizing voltage – lower energy ions do not fragment as readily 6. Three facts must apply for a molecular ion peak: 1) The peak must correspond to the highest mass ion on the spectrum excluding the isotopic peaks 2) The ion must have an odd number of electrons – usually a radical cation 3) The ion must be able to form the other fragments on the spectrum by loss of logical neutral fragments
  • 28.
    Mass Spectrometry III.The MassSpectrum B.Determination of Molecular Mass 5. The Nitrogen Rule is another means of confirming the observance of a molecular ion peak 6. If a molecule contains an even number of nitrogen atoms (only “common” organic atom with an odd valence) or no nitrogen atoms the molecular ion will have an even mass value 7. If a molecule contains an odd number of nitrogen atoms, the molecular ion will have an odd mass value 8. If the molecule contains chlorine or bromine, each with two common isotopes, the determination of M+ can be made much easier, or much more complex as we will see
  • 29.
    Molecular Formulas –What can be learned from them Remember and Review! The Rule of Thirteen – Molecular Formulas from Molecular Mass – When a molecular mass, M+, is known, a base formula can be generated from the following equation: M = n + r 13 13 the base formula being: CnHn + r For this formula, the HDI can be calculated from the following formula: HDI = ( n – r + 2 ) 2
  • 30.
    Molecular Formulas –What can be learned from them Remember and Review! The Rule of Thirteen The following table gives the carbon-hydrogen equivalents and change in HDI for elements also commonly found in organic compounds: Element added Subtrac t: D HDI (DU in text) Element added Subtract: D HDI (DU in text) C H12 7 35Cl C2H11 3 H12 C -7 79Br C6H7 -3 O CH4 1 F CH7 2 N CH2 1/2 Si C2H4 1 S C2H8 2 P C2H7 2 I C9H19 0
  • 31.
    Mass Spectrometry III.The MassSpectrum C. High Resolution Mass Spectrometry • If sufficient resolution (R > 5000) exists, mass numbers can be recorded to precise values (6 to 8 significant figures) • From tables of combinations of formula masses with the natural isotopic weights of each element, it is often possible to find an exact molecular formula from HRMS Example: HRMS gives you a molecular ion of 98.0372; from mass 98 data: C3H6N4 98.0594 C4H4NO2 98.0242 C4H6N2O 98.0480 C4H8N3 98.0719 C5H6O2 98.0368  gives us the exact formula C5H8NO 98.0606 C5H10N2 98.0845 C7H14 98.1096
  • 32.
    Mass Spectrometry IV.The MassSpectrum and Structural Analysis – Inferences from Isotopic Ratios • If a M+ can be observed at sufficient intensity, information leading to a molecular formula can be attained • Consider ethane, C2H6 – on this mass spectrum a M+ ion would be observed at 30: (2 x 12C) + (6 x 1H) = 30 – However, 1.08% of carbon is 13C – there is a 1.08% chance that either carbon in a bulk sample of ethane is 13C (2 x 1.08% or 2.16%) – In the mass spectrum we would expect to see a peak at 31 (one of the carbons being 13C) that was 2.16% of the intensity of the M+ signal - this is called the M+1 peak
  • 33.
    Mass Spectrometry IV.The MassSpectrum and Structural Analysis – Inferences from Isotopic Ratios 5. To calculate the expected M+1 peak for a known molecular formula: %(M+1) = 100 (M+1) = 1.1 x # of carbon atoms M + 0.016 x # of hydrogen atoms + 0.38 x # of nitrogen atoms…etc. 6. Due to the typical low intensity of the M+ peak, one does not typically “back calculate” the intensity M+1 peak to attain a formula 7. However if it is observed, it can give a rough estimate of the number of carbon atoms in the sample: Example: M+ peak at 78 has a M+1 at 79 that is 7% as intense: #C x 1.1 = 7% #C = 7%/1.1 = ~6
  • 34.
    Mass Spectrometry IV.The MassSpectrum and Structural Analysis – Inferences from Isotopic Ratios 5. For very large molecules the M+1, M+2, M+3… bands become very important The M+2, 3, … peaks become even more prominent and molecules that contain nothing but the most common isotopes become rare!
  • 35.
    Mass Spectrometry IV.The MassSpectrum and Structural Analysis – Inferences from Isotopic Ratios 5. For very large molecules the M+1, M+2, M+3… bands become very important Remarkably, here is the molecular ion(s) of insulin (257 carbon atoms): Molecules that are completely 12C are now rare
  • 36.
    Mass Spectrometry IV.The MassSpectrum and Structural Analysis – Inferences from Isotopic Ratios 6. For molecules that contain Cl or Br, the isotopic peaks are diagnostic – In both cases the M+2 isotope is prevalent:  35Cl is 75.77% and 37Cl is 24.23% of naturally occurring chlorine atoms  79Br is 50.52% and 81Br is 49.48% of naturally occurring bromine atoms a) If a molecule contains a single chlorine atom, the molecular ion would appear: m/e M+ M+2
  • 37.
    Mass Spectrometry IV.The MassSpectrum and Structural Analysis – Inferences from Isotopic Ratios 6. For molecules that contain Cl or Br, the isotopic peaks are diagnostic c) If a molecule contains a single bromine atom, the molecular ion would appear: c) The effects of multiple Cl and Br atoms is additive – your text has a complete table of the combinations possible with 1-3 of either atom 7. Sulfur will give a M+2 peak of 4% relative intensity and silicon 3% m/e M+ M+2 The M+2 peak would be about the size of the M+ if one Br is present
  • 38.
    Mass Spectrometry IV.The MassSpectrum and Structural Analysis B.Inferences from M+ - (A summary before moving on…) • If M+ is visible be sure to test for its validity: 1) The peak must correspond to the highest mass ion on the spectrum excluding the isotopic peaks 2) The ion must have an odd number of electrons – test with an HDI calculation » If the HDI is a whole number the ion is an odd-electron ion and therefore could be M+ » If the HDI is not a whole number, it suggests that the ion is an even-electron ion and cannot be a molecular ion. 3) The ion must be able to form the other fragments on the spectrum by loss of logical neutral fragments
  • 39.
    Mass Spectrometry IV.The MassSpectrum and Structural Analysis B.Inferences from M+ - (A summary before moving on…) 2. Using the the M+ peak, make any inferences about the approximate formula – Nitrogen Rule – Rule of Thirteen – HDI 3. Using the M+1 peak (if visible) make some inference as to the number of carbon atoms (for small molecules this works as H, N and O give very low contributions to M+1) 4. If M+2 becomes apparent, analyze for the presence of one or more Cl or Br atoms (sulfur and silicon can also give prominent M+2s)
  • 40.
    Mass Spectrometry IV.The MassSpectrum and Structural Analysis C.Fragmentation - General • The collision of a high energy electron with a molecule not only causes the loss of a valence electron, it imparts some of the kinetic energy of collision into the remaining ion • This energy typically resides in an increased vibrational energy state for the molecule – this energy may be lost by the molecule breaking into fragments • The time between ionization and detection in most mass spectrometer is 10-5 sec. – If a particular ionized molecule can “hold together” for greater than 10-5 sec. a M+ ion is observed
  • 41.
    Mass Spectrometry IV.The MassSpectrum and Structural Analysis C.Fragmentation - General 4. Due to the low concentration of molecules in the ionization chamber, all fragmentation processes are unimolecular 5. Fragmentation of a molecule that is missing one electron in most cases results in a covalent bond breaking homolytically – one fragment is then missing a full pair of electrons and has a + charge and the other fragment is a neutral radical 6. Only the + charged ions will be observed; but the loss of a neutral fragment is inferred by the difference of the M+ and the m/e of the fragment
  • 42.
    Mass Spectrometry IV.The MassSpectrum and Structural Analysis D.Fragmentation – Chemistry of Ions • One bond s-cleavages: a. cleavage of C-C b. cleavage of C-heteroatom C C C C+ C Z C Z+
  • 43.
    Mass Spectrometry IV.The MassSpectrum and Structural Analysis D.Fragmentation – Chemistry of Ions • One bond s-cleavages: c. a-cleavage of C-heteroatom C C Z C C Z+ C C Z C C Z+ C C Z C Z+ C
  • 44.
    Mass Spectrometry IV.The MassSpectrum and Structural Analysis D.Fragmentation – Chemistry of Ions 2. Two bond s-cleavages/rearrangements: a. Elimination of a vicinal H and heteroatom: b. Retro-Diels-Alder C C Z Z+ H H C C + + Full mechanism Abbreviated:
  • 45.
    Mass Spectrometry IV.The MassSpectrum and Structural Analysis D.Fragmentation – Chemistry of Ions 2. Two bond s-cleavages/rearrangements: c. McLafferty Rearrangement 3. Other types of fragmentation are less common, but in specific cases are dominant processes These include: fragmentations from rearrangement, migrations, and fragmentation of fragments Full mechanism Abbreviated: H + H H + H
  • 46.
    Mass Spectrometry IV.The MassSpectrum and Structural Analysis D.Fragmentation – Chemistry of Ions 4. When deducing any fragmentation scheme: – The even-odd electron rule applies: “thermodynamics dictates that even electron ions cannot cleave to a pair of odd electron fragments” – Mass losses of 14 are rare – The order of carbocation/radical stability is benzyl/3° > allyl/2° > 1° > methyl > H * the loss of the longest carbon chain is preferred – Fragment ion stability is more important than fragment radical stability
  • 47.
    Mass Spectrometry IV.The MassSpectrum and Structural Analysis E.Fragmentation Patterns of Groups Aside: Some nomenclature – rather than explicitly writing out single bond cleavages each time: CH2 + H2C CH3 57 Fragment obs. by MS Neutral fragment inferred by its loss – not observedIs written as:
  • 48.
    Mass Spectrometry IV.The MassSpectrum and Structural Analysis E.Fragmentation Patterns of Groups • Alkanes – Very predictable – apply the lessons of the stability of carbocations (or radicals) to predict or explain the observation of the fragments – Method of fragmentation is single bond cleavage in most cases – This is governed by Stevenson’s Rule – the fragment with the lowest ionization energy will take on the + charge – the other fragment will still have an unpaired electron Example: iso-butane CH3+ CH3+
  • 49.
    Mass Spectrometry IV.The MassSpectrum and Structural Analysis E.Fragmentation Patterns of Groups • Alkanes Fragment Ions : n-alkanes » For straight chain alkanes, a M+ is often observed » Ions observed: clusters of peaks CnH2n+1 apart from the loss of –CH3, -C2H5, -C3H7, etc. » Fragments lost: ·CH3, ·C2H5, ·C3H7, etc. » In longer chains – peaks at 43 and 57 are the most common
  • 50.
    Mass Spectrometry IV.The MassSpectrum and Structural Analysis E.Fragmentation Patterns of Groups • Alkanes Example MS: n-alkanes – n-heptane 43 M+ 57
  • 51.
    Mass Spectrometry IV.The MassSpectrum and Structural Analysis E.Fragmentation Patterns of Groups • Alkanes Fragment Ions : branched alkanes » Where the possibility of forming 2° and 3° carbocations is high, the molecule is susceptible to fragmentation » Whereas in straight chain alkanes, a 1° carbocation is always formed, its appearance is of lowered intensity with branched structures » M+ peaks become weak to non-existent as the size and branching of the molecule increase » Peaks at 43 and 57 are the most common as these are the iso- propyl and tert-butyl cations
  • 52.
    Mass Spectrometry IV.The MassSpectrum and Structural Analysis E.Fragmentation Patterns of Groups • Alkanes Example MS: branched alkanes – 2,2-dimethylhexane 57 M+ 114
  • 53.
    Mass Spectrometry IV.The MassSpectrum and Structural Analysis E.Fragmentation Patterns of Groups • Alkanes Fragment Ions : cycloalkanes » Molecular ions strong and commonly observed – cleavage of the ring still gives same mass value » A two-bond cleavage to form ethene (C2H4) is common – loss of 28 » Side chains are easily fragmented H2C CH2 + HC C R H H H2C CH2 C H2 n
  • 54.
    Mass Spectrometry IV.The MassSpectrum and Structural Analysis E.Fragmentation Patterns of Groups Alkanes Example MS: cycloalkanes – cyclohexane M+ 84 + M - 28 = 56
  • 55.
    Mass Spectrometry IV.The MassSpectrum and Structural Analysis E.Fragmentation Patterns of Groups • Alkanes Example MS: cycloalkanes – trans-p-menthane 97 M+ 140
  • 56.
    Mass Spectrometry IV.The MassSpectrum and Structural Analysis E.Fragmentation Patterns of Groups 2. Alkenes – The p-bond of an alkene can absorb substantial energy – molecular ions are commonly observed – After ionization, double bonds can migrate readily – determination of isomers is often not possible – Ions observed: clusters of peaks CnH2n-1 apart from -C3H5, -C4H7, - C5H9 etc. at 41, 55, 69, etc. – Terminal alkenes readily form the allyl carbocation, m/z 41 R H2 C +RC H CH2 H2C C H CH2
  • 57.
    Mass Spectrometry IV.The MassSpectrum and Structural Analysis E.Fragmentation Patterns of Groups 2. Alkenes Example MS: alkenes – cis- 2-pentene M+ 70 55
  • 58.
    Mass Spectrometry IV.The MassSpectrum and Structural Analysis E.Fragmentation Patterns of Groups 2. Alkenes Example MS: alkenes –1-hexene M+ 84 41 56 Take home assignment: What is M-42 and m/z 42?
  • 59.
    Mass Spectrometry IV.The MassSpectrum and Structural Analysis E.Fragmentation Patterns of Groups 2. Alkenes Example MS: alkenes –1-pentene M+ 70 Take home assignment 2: What is m/z 42?
  • 60.
    Mass Spectrometry IV.The MassSpectrum and Structural Analysis E.Fragmentation Patterns of Groups Comparison: Alkanes vs. alkenes Octane (75 eV) M+ 114 m/z 85, 71, 57, 43 (base), 29 Octene (75 eV) M+ 112 (stronger @ 75eV than octane) m/z 83, 69, 55, 41, 29
  • 61.
    Mass Spectrometry IV.The MassSpectrum and Structural Analysis E.Fragmentation Patterns of Groups 2. Alkenes Fragment Ions : cycloalkenes » Molecular ions strong and commonly observed – cleavage of the ring still gives same mass value » Retro-Diels-Alder is significant observed loss of 28 » Side chains are easily fragmented +
  • 62.
    Mass SpectrometryIV.The MassSpectrum and Structural Analysis E.Fragmentation Patterns of Groups 2. Alkenes Example MS: cycloalkenes –1-methyl-1-cyclohexene M+ 96 81 68
  • 63.
    Mass Spectrometry IV.The MassSpectrum and Structural Analysis E.Fragmentation Patterns of Groups 3. Alkynes – Fragment Ions – The p-bond of an alkyne can also absorb substantial energy – molecular ions are commonly observed – For terminal alkynes, the loss of terminal hydrogen is observed (M- 1) – this may occur at such intensity to be the base peak or eliminate the presence of M+ – Terminal alkynes form the propargyl cation, m/z 39 (lower intensity than the allyl cation) R H2 C +RC CH H2C C CH
  • 64.
    Mass SpectrometryIV.The MassSpectrum and Structural Analysis E.Fragmentation Patterns of Groups 3. Alkynes Example MS: alkynes – 1-pentyne M+ 68 H 67H 39
  • 65.
    Mass SpectrometryIV.The MassSpectrum and Structural Analysis E.Fragmentation Patterns of Groups 3. Alkynes Example MS: alkynes – 2-pentyne M+ 68 53
  • 66.
    Mass Spectrometry IV.The MassSpectrum and Structural Analysis E.Fragmentation Patterns of Groups 4. Aromatic Hydrocarbons – Fragment Ions – Very intense molecular ion peaks and little fragmentation of the ring system are observed – Where alkyl groups are attached to the ring, a favorable mode of cleavage is to lose a H-radical to form the C7H7 + ion (m/z 91) – This ion is believed to be the tropylium ion; formed from rearrangement of the benzyl cation CH2CH3 75 eV e-
  • 67.
    Mass Spectrometry IV.The MassSpectrum and Structural Analysis E.Fragmentation Patterns of Groups 4. Aromatic Hydrocarbons – Fragment Ions d) If a chain from the aromatic ring is sufficiently long, a McLafferty rearrangement is possible e) Substitution patterns for aromatic rings are able to be determined by MS – with the exception of groups that have other ion chemistry
  • 68.
    Mass Spectrometry IV.The MassSpectrum and Structural Analysis E.Fragmentation Patterns of Groups 4. Aromatic Hydrocarbons Example MS: aromatic hydrocarbons – p-xylene M+ 106 CH3CH3 H3C m/z 91
  • 69.
    Mass SpectrometryIV.The MassSpectrum and Structural Analysis E.Fragmentation Patterns of Groups 4. Aromatic Hydrocarbons Example MS: aromatic hydrocarbons – n -butylbenzene M+ 134 H H + 92 91
  • 70.
    Mass Spectrometry IV.The MassSpectrum and Structural Analysis E.Fragmentation Patterns of Groups 5. Alcohols– Fragment Ions – Additional modes of fragmentation will cause lower M+ than for the corresponding alkanes 1° and 2° alcohols have a low M+, 3° may be absent b) The largest alkyl group is usually lost; the mode of cleavage typically is similar for all alcohols: primary secondary OH H2C O H+ O H + OH O H+ OH m/z 31 59 45
  • 71.
    Mass Spectrometry IV.The MassSpectrum and Structural Analysis E.Fragmentation Patterns of Groups 5. Alcohols– Fragment Ions c) Dehydration (M - 18) is a common mode of fragmentation – importance increases with alkyl chain length (>4 carbons) » 1,2-elimination – occurs from hot surface of ionization chamber » 1,4-elimination – occurs from ionization » both modes give M - 18, with the appearance and possible subsequent fragmentation of the remaining alkene d) For longer chain alcohols, a McLafferty type rearrangement can produce water and ethylene (M - 18, M - 28) O HR H O H R H +
  • 72.
    Mass Spectrometry IV.The MassSpectrum and Structural Analysis E.Fragmentation Patterns of Groups 5. Alcohols– Fragment Ions e) Loss of H is not favored for alkanols (M – 1) f) Cyclic alcohols fragment by similar pathways » a-cleavage » dehydration OHH OHH H OHH H OHH + OHH , + H2O m/z 57 M - 18
  • 73.
    Mass Spectrometry IV.The MassSpectrum and Structural Analysis E.Fragmentation Patterns of Groups 5. Alcohols Example MS: alcohols – n -pentanol M+ 88 -H2O 70OH 31 OH H OH H + 42
  • 74.
    Mass Spectrometry IV.The MassSpectrum and Structural Analysis E.Fragmentation Patterns of Groups 5. Alcohols Example MS: alcohols – 2-pentanol M+ 88 OH 45
  • 75.
    Mass Spectrometry IV.The MassSpectrum and Structural Analysis E.Fragmentation Patterns of Groups 5. Alcohols Example MS: alcohols – 2-methyl-2-pentanol M+ 102 87 OH OH 59
  • 76.
    Mass SpectrometryIV.The MassSpectrum and Structural Analysis E.Fragmentation Patterns of Groups 5. Alcohols Example MS: alcohols – cyclopentanol M+ 86 OHH OHH + 57
  • 77.
    Mass Spectrometry IV.The MassSpectrum and Structural Analysis E.Fragmentation Patterns of Groups 6. Phenols– Fragment Ions – Do not fully combine observations for aromatic + alcohol; treat as a unique group b) For example, loss of H· is observed (M – 1) – charge can be delocalized by ring – most important for rings with EDGs c) Loss of CO (extrusion) is commonly observed (M – 28); Net loss of the formyl radical (HCO·, M – 29) is also observed from this process O H O H H O C O -CO -H
  • 78.
    Mass Spectrometry IV.The MassSpectrum and Structural Analysis E.Fragmentation Patterns of Groups 5. Example MS: phenols – phenol M+ 94 -CO 66 -HCO 65
  • 79.
    Mass SpectrometryIV.The MassSpectrum and Structural Analysis E.Fragmentation Patterns of Groups An interesting combination of functionalities: benzyl alcohols Upon ring expansion to tropylium ions, they become phenols! M+ 108 77 M – 1, 107 “tropyliol” HO H H + “tropyliol” - CO 79 + H2 OH
  • 80.
    Mass Spectrometry IV.The MassSpectrum and Structural Analysis E.Fragmentation Patterns of Groups 7. Ethers– Fragment Ions – Slightly more intense M+ than for the corresponding alcohols or alkanes b) The largest alkyl group is usually lost to a-cleavage; the mode of cleavage typically is similar to alcohols: c) Cleavage of the C-O bond to give carbocations is observed where favorable R H2 C O R R H2C O R+ R H C O R R CH O R RR +
  • 81.
    Mass Spectrometry IV.The MassSpectrum and Structural Analysis E.Fragmentation Patterns of Groups 7. Ethers– Fragment Ions d) Rearrangement can occur of the following type, if a-carbon is branched: e) Aromatic ethers, similar to phenols can generate the C6H5O+ ion by loss of the alkyl group rather than H; this can expel CO as in the phenolic degradation R C O C R C HH R CH2 H H O H R + O R O R + C O + C5H5 +
  • 82.
    Mass Spectrometry IV.The MassSpectrum and Structural Analysis E.Fragmentation Patterns of Groups 7. Example MS: ethers – butyl methyl ether M+ 88 O 45
  • 83.
    Mass Spectrometry IV.The MassSpectrum and Structural Analysis E.Fragmentation Patterns of Groups 7. Example MS: ethers – anisole M+ 108 O 93 M-28 (-CH3, -CO) 65 O 77 Take home – what is m/z 78?
  • 84.
    Mass Spectrometry IV.The MassSpectrum and Structural Analysis E.Fragmentation Patterns of Groups 8. Aldehydes - Fragment Ions – Weak M+ for aliphatic, strong M+ for aromatic aldehydes b) a-cleavage is characteristic and often diagnostic for aldehydes – can occur on either side of the carbonyl c) b-cleavage is an additional mode of fragmentation R H O R C O + H R H O H C O+R M-1 peak m/z 29 H O +RR H O m/z R+ M - 41 can be R-subs.
  • 85.
    Mass Spectrometry IV.The MassSpectrum and Structural Analysis E.Fragmentation Patterns of Groups 8. Aldehydes - Fragment Ions d) McLafferty rearrangement observed if g-Hs present e) Aromatic aldehydes – a-cleavages are more favorable, both to lose H· (M - 1) and HCO· (M – 29) m/z 44 m/z R+ Remember: aromatic ring can be subs. + O H HR O HR C O + H H O O H + O H
  • 86.
    Mass Spectrometry IV.The MassSpectrum and Structural Analysis E.Fragmentation Patterns of Groups 8. Example MS: aldehydes (aliphatic) – pentanal M+ 86 M-1 85 H C O 29 + O H H O H m/z 44
  • 87.
    Mass Spectrometry IV.The MassSpectrum and Structural Analysis E.Fragmentation Patterns of Groups 8. Example MS: aldehydes (aromatic) – m-tolualdehyde M+ 120 M-1 119 O H 91
  • 88.
    Mass Spectrometry IV.The MassSpectrum and Structural Analysis E.Fragmentation Patterns of Groups 9. Ketones - Fragment Ions – Strong M+ for aliphatic and aromatic ketones b) a-cleavage can occur on either side of the carbonyl – the larger alkyl group is lost more often c) b-cleavage is not as important of a fragmentation mode for ketones compared to aldehydes – but sometimes observed R R1 O R C O + R1 R1 is larger than R M – 15, 29, 43… m/z 43, 58, 72, etc. R1 O +RR R1 O
  • 89.
    Mass Spectrometry IV.The MassSpectrum and Structural Analysis E.Fragmentation Patterns of Groups 9. Ketones - Fragment Ions d) McLafferty rearrangement observed if g-H’s present – if both alkyl chains are sufficiently long – both can be observed e) Aromatic ketones – a-cleavages are favorable primarily to lose R· (M – 15, 29…) to form the C6H5CO+ ion, which can lose CO Remember: aromatic ring can be subs. + O R1 HR O HR R1 C O + R O R + C O m/z 105
  • 90.
    Mass Spectrometry IV.The MassSpectrum and Structural Analysis E.Fragmentation Patterns of Groups 9. Ketones - Fragment Ions f) cyclic ketones degrade in a similar fashion to cycloalkanes and cycloalkanols: O H O H O + O O O O + - CO m/z 55 m/z 42 m/z 70
  • 91.
    Mass Spectrometry IV.The MassSpectrum and Structural Analysis E.Fragmentation Patterns of Groups 9. Example MS: ketones (aliphatic) – 2-pentanone M+ 86 M-15 O 43 O H O H + 58
  • 92.
    Mass Spectrometry IV.The MassSpectrum and Structural Analysis E.Fragmentation Patterns of Groups 9. Example MS: ketones (aromatic) – propiophenone M+ 134 C O O m/z 105 m/z 77
  • 93.
    Mass Spectrometry IV.The MassSpectrum and Structural Analysis E.Fragmentation Patterns of Groups 10. Esters - Fragment Ions – M+ weak in most cases, aromatic esters give a stronger peak b) Most important a-cleavage reactions involve loss of the alkoxy- radical to leave the acylium ion c) The other a-cleavage (most common with methyl esters, m/z 59) involves the loss of the alkyl group R R1 O R C O + OR1 O R R1 O R C O + O O R1
  • 94.
    Mass Spectrometry IV.The MassSpectrum and Structural Analysis E.Fragmentation Patterns of Groups 10. Esters - Fragment Ions d) McLafferty occurs with sufficiently long esters e) Ethyl and longer (alkoxy chain) esters can undergo the McLafferty rearrangement R1 O + O H R1 O O H R O + O R O O HH
  • 95.
    Mass Spectrometry IV.The MassSpectrum and Structural Analysis E.Fragmentation Patterns of Groups 10. Esters - Fragment Ions f) The most common fragmentation route is to lose the alkyl group by a-cleavage, to form the C6H5CO+ ion (m/z 105) R O RO C O + Can lose CO to give m/z 77
  • 96.
    Mass Spectrometry IV.The MassSpectrum and Structural Analysis E.Fragmentation Patterns of Groups 10. Esters - Fragment Ions g) One interesting fragmentation is shared by both benzyloxy esters and aromatic esters that have an ortho-alkyl group O O H OH fragmentation + CH2 C O ketene O R O C H2 H C HO R O CH2 + benzyloxy ester ortho-alkylbenzoate ester
  • 97.
    Mass Spectrometry IV.The MassSpectrum and Structural Analysis E.Fragmentation Patterns of Groups 10. Example MS: esters (aliphatic) – ethyl butyrate M+ 116 both McLafferty (take home exercise) m/z 88 O O 71 O O 43 O O 29
  • 98.
    Mass Spectrometry IV.The MassSpectrum and Structural Analysis E.Fragmentation Patterns of Groups 10. Example MS: esters (aliphatic) – ethyl butyrate M+ 116 both McLafferty (take home exercise) m/z 88 O O 71 O O 43 O O 29
  • 99.
    Mass Spectrometry IV.The MassSpectrum and Structural Analysis E.Fragmentation Patterns of Groups 10. Example MS: esters (benzoic) – methyl ortho-toluate M+ 150 C O CH2 O O 119 O O 91 m/z 118
  • 100.
    Mass Spectrometry IV.The MassSpectrum and Structural Analysis E.Fragmentation Patterns of Groups 11. Carboxylic Acids - Fragment Ions – As with esters, M+ weak in most cases, aromatic acids give a stronger peak b) Most important a-cleavage reactions involve loss of the alkoxy- radical to leave the acylium ion c) The other a-cleavage (less common) involves the loss of the alkyl radical. Although less common, the m/z 45 peak is somewhat diagnostic for acids. R H O R C O + OH O R H O R C O + O O H
  • 101.
    Mass Spectrometry IV.The MassSpectrum and Structural Analysis E.Fragmentation Patterns of Groups 11. Carboxylic Acids - Fragment Ions d) McLafferty occurs with sufficiently long acids e) aromatic acids degrade by a process similar to esters, loss of the HO· gives the acylium ion which can lose CO: H O + O H H O O H m/z 60 H O HO C O + + further loss of CO to m/z 77
  • 102.
    Mass Spectrometry IV.The MassSpectrum and Structural Analysis E.Fragmentation Patterns of Groups 11. Carboxylic Acids - Fragment Ions f) As with esters, those benzoic acids with an ortho-alkyl group will lose water to give a ketene radical cation O H O C H2 H C HO H O CH2 + ortho-alkylbenzoic acid
  • 103.
    Mass Spectrometry IV.The MassSpectrum and Structural Analysis E.Fragmentation Patterns of Groups 11. Example MS: carboxylic acids (aliphatic) – pentanoic acid M+ 102 O OH H OH OH m/z 60
  • 104.
    Mass Spectrometry IV.The MassSpectrum and Structural Analysis E.Fragmentation Patterns of Groups 11. Example MS: carboxylic acids (aromatic) – p-toluic acid M+ 136 OH O 119 OH O 91
  • 105.
    Mass Spectrometry IV.The MassSpectrum and Structural Analysis E.Fragmentation Patterns of Groups Summary – Carbonyl Compounds For carbonyl compounds – there are 4 common modes of fragmentation:  A1 & A2 -- two a-cleavages  B -- b-cleavage  C – McLafferty Rearrangement O G R O G R + O G R H O G R H + R O G O C G2 + R OCR + G R O G
  • 106.
    Mass Spectrometry IV.The MassSpectrum and Structural Analysis E.Fragmentation Patterns of Groups Summary – Carbonyl Compounds In tabular format: m/z of ion observed Fragmentation Path Aldehydes G = H Ketones G = R Esters G = OR’ Acids G = OH Amides G = NH2 A1 a-cleavage - R 29 43b 59b 45 44d A2 a-cleavage - G 43b 43b 43b 43b 43b B b-cleavage - G 43a 57b 73b 59a 58a C McLafferty 44a 58b,c 74b,c 60a 59a b = base, add other mass attached to this chain a = base, if a-carbon branched, add appropriate mass c = sufficiently long structures can undergo on either side of C=O d = if N-substituted, add appropriate mass
  • 107.
    Mass Spectrometry IV.The MassSpectrum and Structural Analysis E.Fragmentation Patterns of Groups 12. Amines - Fragment Ions – Follow nitrogen rule – odd M+, odd # of nitrogens; nonetheless, M+ weak in aliphatic amines b) a-cleavage reactions are the most important fragmentations for amines; for 1° n-aliphatic amines m/z 30 is diagnostic c) McLafferty not often observed with amines, even with sufficiently long alkyl chains d) Loss of ammonia (M – 17) is not typically observed R C N R C N+
  • 108.
    Mass Spectrometry IV.The MassSpectrum and Structural Analysis E.Fragmentation Patterns of Groups 12. Amines - Fragment Ions e) Mass spectra of cyclic amines is complex and varies with ring size f) Aromatic amines have intense M+ g) Loss of a hydrogen atom, followed by the expulsion of HCN is typical for anilines h) Pyridines have similar stability (strong M+, simple MS) to aromatics, expulsion of HCN is similar to anilines NH2 NH + H H H + HCN H + H
  • 109.
    Mass Spectrometry IV.The MassSpectrum and Structural Analysis E.Fragmentation Patterns of Groups 12. Example MS: amines, 1° – pentylamine M+ 87 NH2 30
  • 110.
    Mass Spectrometry IV.The MassSpectrum and Structural Analysis E.Fragmentation Patterns of Groups 12. Example MS: amines, 2° – dipropylamine M+ 101 N H 72 N H H
  • 111.
    Mass Spectrometry IV.The MassSpectrum and Structural Analysis E.Fragmentation Patterns of Groups 12. Example MS: amines, 3° – tripropylamine M+ 143 N 114
  • 112.
    Mass Spectrometry IV.The MassSpectrum and Structural Analysis E.Fragmentation Patterns of Groups 13. Amides - Fragment Ions – Follow nitrogen rule – odd M+, odd # of nitrogens; observable M+ b) a-cleavage reactions afford a specific fragment of m/z 44 for primary amides c) McLafferty observed where g-hydrogens are present R C NH2 O R + O C NH2 m/z 44 O NH2 H O NH2 H +
  • 113.
    Mass Spectrometry IV.The MassSpectrum and Structural Analysis E.Fragmentation Patterns of Groups 13. Example MS: amides – butyramide M+ 87 C NH2 O 44 O NH2 H 59
  • 114.
    Mass Spectrometry IV.The MassSpectrum and Structural Analysis E.Fragmentation Patterns of Groups 13. Example MS: amides (aromatic) – benzamide M+ 121 C NH2O 77 C NH2O 105
  • 115.
    Mass Spectrometry IV.The MassSpectrum and Structural Analysis E.Fragmentation Patterns of Groups 14. Nitriles - Fragment Ions – Follow nitrogen rule – odd M+, odd # of nitrogens; weak M+ b) Principle degradation is the loss of an H-atom (M – 1) from a- carbon: c) Loss of HCN observed (M – 27) d) McLafferty observed where g-hydrogens are present H +R H2 C C N R C H C N C N H H2C C N H + m/z 41
  • 116.
    Mass Spectrometry IV.The MassSpectrum and Structural Analysis E.Fragmentation Patterns of Groups 14. Example MS: nitriles – propionitrile M+ 55 M-1 54 - HCN
  • 117.
    Mass Spectrometry IV.The MassSpectrum and Structural Analysis E.Fragmentation Patterns of Groups 14. Example MS: nitriles – valeronitrile (pentanenitrile) M+ 83 H2C C N H m/z 41 C N 43 C N 54
  • 118.
    Mass Spectrometry IV.The MassSpectrum and Structural Analysis E.Fragmentation Patterns of Groups 15. Nitro - Fragment Ions – Follow nitrogen rule – odd M+, odd # of nitrogens; M+ almost never observed, unless aromatic b) Principle degradation is loss of NO+ (m/z 30) and NO2 + (m/z 46) R N O O R N O O + m/z 46 + m/z 30 R N O O R N O O R O N O R O N O
  • 119.
    Mass Spectrometry IV.The MassSpectrum and Structural Analysis E.Fragmentation Patterns of Groups 15. Nitro - Fragment Ions c) Aromatic nitro groups show these peaks as well as the fragments of the loss of all or parts of the nitro groupNO2 O + NO + CO NO2 + NO2 + HC CHC4H3 m/z 93 m/z 65 m/z 77 m/z 51
  • 120.
    Mass Spectrometry IV.The MassSpectrum and Structural Analysis E.Fragmentation Patterns of Groups 15. Example MS: nitro – 1-nitropropane M+ 89NO2 + 46NO+ 30 NO2 43
  • 121.
    Mass Spectrometry IV.The MassSpectrum and Structural Analysis E.Fragmentation Patterns of Groups 15. Example MS: nitro (aromatic) – p-nitrotoluene M+ 137 O m/z 107 91 NO2 C5H5 +
  • 122.
    Mass Spectrometry IV.The MassSpectrum and Structural Analysis E.Fragmentation Patterns of Groups 16. Halogens - Fragment Ions – Halogenated compounds often give good M+ – Fluoro- and iodo-compounds do not have appreciable contribution from isotopes – Chloro- and bromo-compounds are unique in that they will show strong M+2 peaks for the contribution of higher isotopes – For chlorinated compounds, the ratio of M+ to M+2 is about 3:1 – For brominated compounds, the ratio of M+ to M+2 is 1:1 – An appreciable M+4, 6, … peak is indicative of a combination of
  • 123.
    Mass Spectrometry IV.The MassSpectrum and Structural Analysis E.Fragmentation Patterns of Groups 16. Halogens - Fragment Ions g) Principle fragmentation mode is to lose halogen atom, leaving a carbocation – the intensity of the peak will increase with cation stability h) Leaving group ability contributes to the loss of halogen most strongly for -I and -Br less so for -Cl, and least for –F i) Loss of HX is the second most common mode of fragmentation – here the conjugate basicity of the halogen contributes (HF > HCl > HBr > HI) R + XR X R +C XCR H H H H C H CH2 H X
  • 124.
    Mass Spectrometry IV.The MassSpectrum and Structural Analysis E.Fragmentation Patterns of Groups 16. Halogens - Fragment Ions j) Less often, a-cleavage will occur: k) For longer chain halides, the expulsion of a >d carbon chain as the radical is observed l) Aromatic halides give stronger M+, and typically lose the halogen atom to form C6H5 + R +C X H H H2C XR R+ R X X
  • 125.
    Mass Spectrometry IV.The MassSpectrum and Structural Analysis E.Fragmentation Patterns of Groups 16. Example MS: chlorine – 1-chloropropane M+ 78m/z 49, 51 43 Cl H2C Cl M+2
  • 126.
    Mass Spectrometry IV.The MassSpectrum and Structural Analysis E.Fragmentation Patterns of Groups 16. Example MS: chlorine – p-chlorotoluene M+ 126 M+2 91 Cl
  • 127.
    Mass Spectrometry IV.The MassSpectrum and Structural Analysis E.Fragmentation Patterns of Groups 16. Example MS: bromine – 1-bromobutane M+ 136 M+2 57 Br H2C Br
  • 128.
    Mass Spectrometry IV.The MassSpectrum and Structural Analysis E.Fragmentation Patterns of Groups 16. Example MS: bromine – p-bromotoluene M+ 170 M+2 91 Br
  • 129.
    Mass Spectrometry IV.The MassSpectrum and Structural Analysis E.Fragmentation Patterns of Groups 16. Example MS: multiple bromines – 3,4-dibromotoluene M+ 248 M+4 M+2 169, 171 Br Br 90 Br Br
  • 130.
    Mass Spectrometry IV.The MassSpectrum and Structural Analysis E.Fragmentation Patterns of Groups 16. Example MS: iodine – iodobenzene M+ 204 77 I
  • 131.
    Mass Spectrometry IV.The MassSpectrum and Structural Analysis F.Approach to analyzing a mass spectrum • As with IR, get a general feel for the spectrum before you analyze anything – is it simple, complex, groups of peaks, etc. • Squeeze everything you can out of the M+ peak that you can (once you have confirmed it is the M+) – Strong or Weak? – Isotopes? M+1? M+2, 4, … – Apply the Nitrogen rule – Apply the Rule of Thirteen to generate possible formulas (you can quickly dispose of possibilities based on the absence of isotopic peaks or the inference of the nitrogen rule) – Use the HDI from the Rule of Thirteen to further reduce the possibilities
  • 132.
    Mass Spectrometry IV.The MassSpectrum and Structural Analysis F.Approach to analyzing a mass spectrum 3. Squeeze everything you can out of the base peak – What ions could give this peak? (m/z 43 doesn’t help much) – What was lost from M+ to give this peak? – When considering the base peak initially, only think of the most common cleavages for each group 4. Look for the loss of small neutral molecules from M+ – H2C=CH2, HCCH, H2O, HOR, HCN, HX 5. Now consider the possible diagnostic peaks on the spectrum (e.g.: 29, 30, 31, 45, 59, 77, 91, 105 etc.) 6. Lastly, once you have a hypothetical molecule that explains
  • 133.
  • 135.
    Ionization to RadicalCation Molecular Ion (m+)
  • 136.
    Glossary • Molecular ion- The ion obtained by the loss of one electron from the molecule (m+) • Base peak - The most intense peak in the MS, assigned 100% intensity • Radical cation - positively charged species with an odd number of electrons • Fragment ions - Lighter cations (and radical cations) formed by the decomposition of the molecular ion. These often correspond to stable carbcations. • m/z - mass to charge ratio
  • 137.
    The Mass Spectrum Massesare graphed or tabulated according to their relative abundance. =>
  • 138.
  • 139.
  • 140.
  • 141.
    Mass Spectra of Alkanes Morestable carbocations will be more abundant. =>
  • 142.
  • 143.
  • 144.
    Octane, m+ =114 CH3CH2CH2CH2CH2CH2CH2CH3 m+ = 114 -15 -29 -43 -57 -71 (base) m-29 m-43 m-57 m-71 Base peak m+
  • 145.
    Isooctane, no molecularion CH3CCH2CHCH3 CH3 CH3 CH3 m+ = 114 loss of (isobutyl) . CH3C CH3 CH3 + m/z = 57
  • 146.
  • 147.
  • 148.
    Effect of Branchingin Hydrocarbons
  • 149.
    Isotopes • Mass spectrometersare capable of separating and detecting individual ions even those that only differ by a single atomic mass unit. • As a result molecules containing different isotopes can be distinguished. • This is most apparent when atoms such as bromine or chlorine are present (79Br : 81Br, intensity 1:1 and 35Cl : 37Cl, intensity 3:1) where peaks at "M" and "M+2" are obtained. • The intensity ratios in the isotope patterns are due to the natural abundance of the isotopes. • "M+1" peaks are seen due the the presence of 13C in the sample.
  • 150.
  • 151.
  • 152.
  • 153.
  • 154.
    Chloroacetone CH3CCH2Cl O m+ = 92 m+2= 94 - Cl - CH3 - CH2Cl . . . O CH3CCH2 O CCH2Cl O CH3C + + + m/z = 57 m/z = 77,79 m/z = 43 (base)(3:1 ratio)
  • 155.
    3-Pentanone C O CH2CH3CH3CH2 + m/z =86 . CH2CH3 . CH3CH2C=O + loss of m/z = 57 m+ m-29 base
  • 156.
    2-Pentanone C O CH2CH2CH3CH3 + m/z =86 . CH2CH2CH3 . CH3C=O + loss of m/z = 43 m-43 base m-15 m+
  • 157.
  • 158.
  • 159.
    1-Butanol CH3CH2CH2CH2OH +. m+ = 74 -H2O CH3CH2CH CH2 + . m/z= 56 CH2OH CH2=OH ++ m/z = 31 m-18
  • 160.
  • 161.
    Toluene CH3 +. m/z = 92 lossof H . CH2 m/z = 91 + + tropylium ion m+ m-1
  • 162.
  • 163.
  • 164.
  • 165.
  • 166.
  • 167.
    McLafferty Rearrangement link toSDBS H O Hm+ = 86 +. O H H a b g .+ O H H .+ m/z = 44 + H transfer from gcarbon results in loss of a neutral alkene
  • 168.
    McLafferty Rearrangements in AlkylBenzenes g b a CH2 CH2 CHCH3 H m+ 134 loss of CH3CH=CH2 .+ CH2 H H +. m/e 92 CH2 + m/e 91 - propyl .
  • 169.
  • 170.
    2-Octanone O H m+ = 128 O +. + lossof C6H13 . m/z = 43 loss of pentene O H .+ m/z = 58 via McLafferty a b g
  • 171.
    2-Octanone O H m+ = 128 O +. + lossof C6H13 . m/z = 43 loss of pentene O H .+ m/z = 58 via McLafferty a b g
  • 172.
  • 173.
  • 174.
  • 175.
  • 176.
  • 177.
    High Resolution MassSpectrometry Determination of Molecular Formula CO N2 C2H4 CH2N all show m+ at 28 CO 27.9949 N2 28.0062 C2H4 28.0312 CH2N 28.0187 exact mass
  • 178.
    Isotope Ratios CanHelp to Determine Molecular Formula Relative intensities (%) MF MW M M+1 M+2 CO 28.0 100 1.12 0.2 N2 28.0 100 0.76 ---- C2H4 28.0 100 2.23 0.01
  • 179.
    Comparisons of MolecularWeights and Precise Masses MF MW exact mass C3H8O 60.1 60.05754 C2H8N2 60.1 60.06884 C2H4O2 60.1 60.02112 CH4N2O 60.1 60.03242
  • 181.
    Determine the Formula fragmentfinder Molecular mass m+1 m+2 110 111 112 rel. intensity (%) 100 6.96 0.60 exact mass = 110.0376
  • 182.
    Determine the Formula Molecularmass m+1 m+2 118 119 120 rel. intensity (%) 100 7.45 4.55
  • 184.
    Subtract Sulfur’s contribution fragmentfinder Molecular mass m+1 m+2 118 119 120 rel. intensity (%) 100 7.45 4.55 subtract sulfur (32) 86 87 88 100 6.67 0.15
  • 185.
    Determine the Molecular Formula Molecularmass m+1 m+2 154 155 156 rel. intensity (%) 100 15.41 3.77
  • 186.
    Compound gives foursignals in the C-13 NMR spectrum Molecular mass m+1 m+2 m+4 190 191 192 194 rel. intensity (%) 100 6.48 130.77 31.81