Downloaded 151 times


![1.CapacityPlanningusingOverallFactors(CPOF).
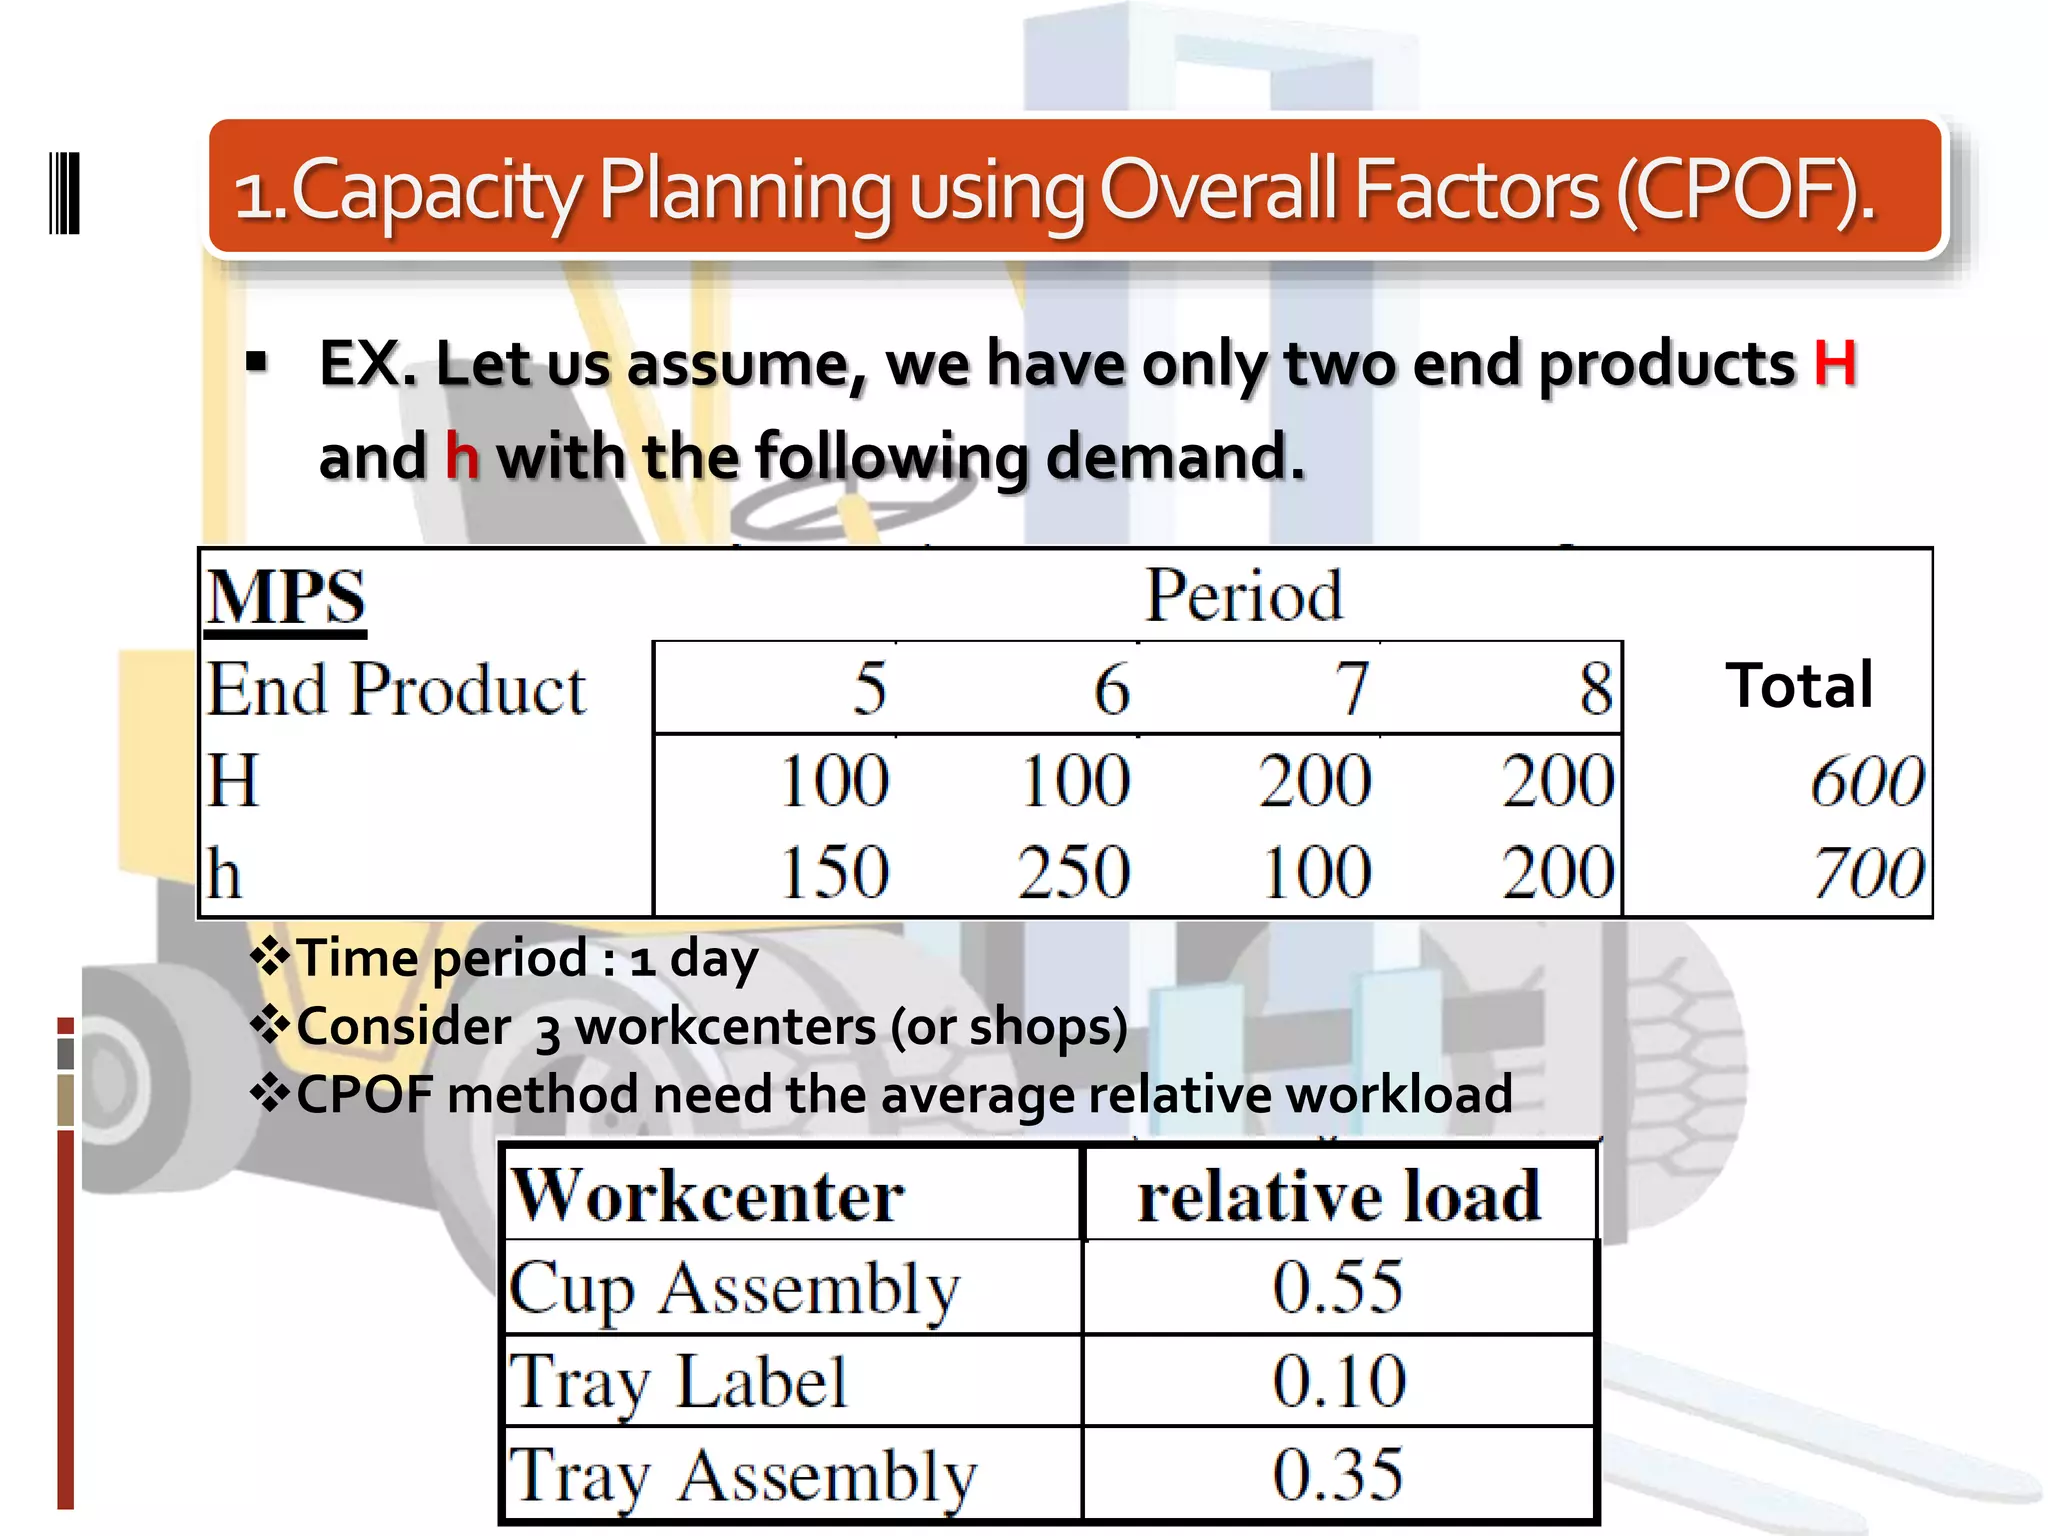
CPOF needTotal amount of resource for producing
one unit of each end products.
Assume the unit to be the working hour.
1 H requires 0.15 hour = 9 min.
1 h requires 0.1 hour = 6 min.
Workcenter load = [(H total capacity/product)x(H product/period)
+ (h total capacity/product )x (h product/period)] x relative load Eq.1](https://image.slidesharecdn.com/manufacturingplanningandcontrolsystems-140331165937-phpapp02/75/Manufacturing-planning-and-control-systems-14-2048.jpg)
![1.CapacityPlanningusingOverallFactors(CPOF).
At period time 5
Cup assembly = [9*100+6*150]*0.55 = 990 min = 990/60 = 16.5 hours
Tray label = [9*100 +6*150]*0.10 = 180 min = 180/60 = 3 hours
Tray assembly = [9*100+6*150]*.35= 630 min = 630/60 = 10.5 hours
Total capacity = 16.5 + 3 + 10.5 =30 hours
The same calc with period 6,7,8
The method implicitly assume that for every production hour, 55 % are spent at
the Cup Assembly, 35 % at the Tray Assembly and 10 % at the Tray Label.
Total
55%
10%
35%
Hours](https://image.slidesharecdn.com/manufacturingplanningandcontrolsystems-140331165937-phpapp02/75/Manufacturing-planning-and-control-systems-15-2048.jpg)
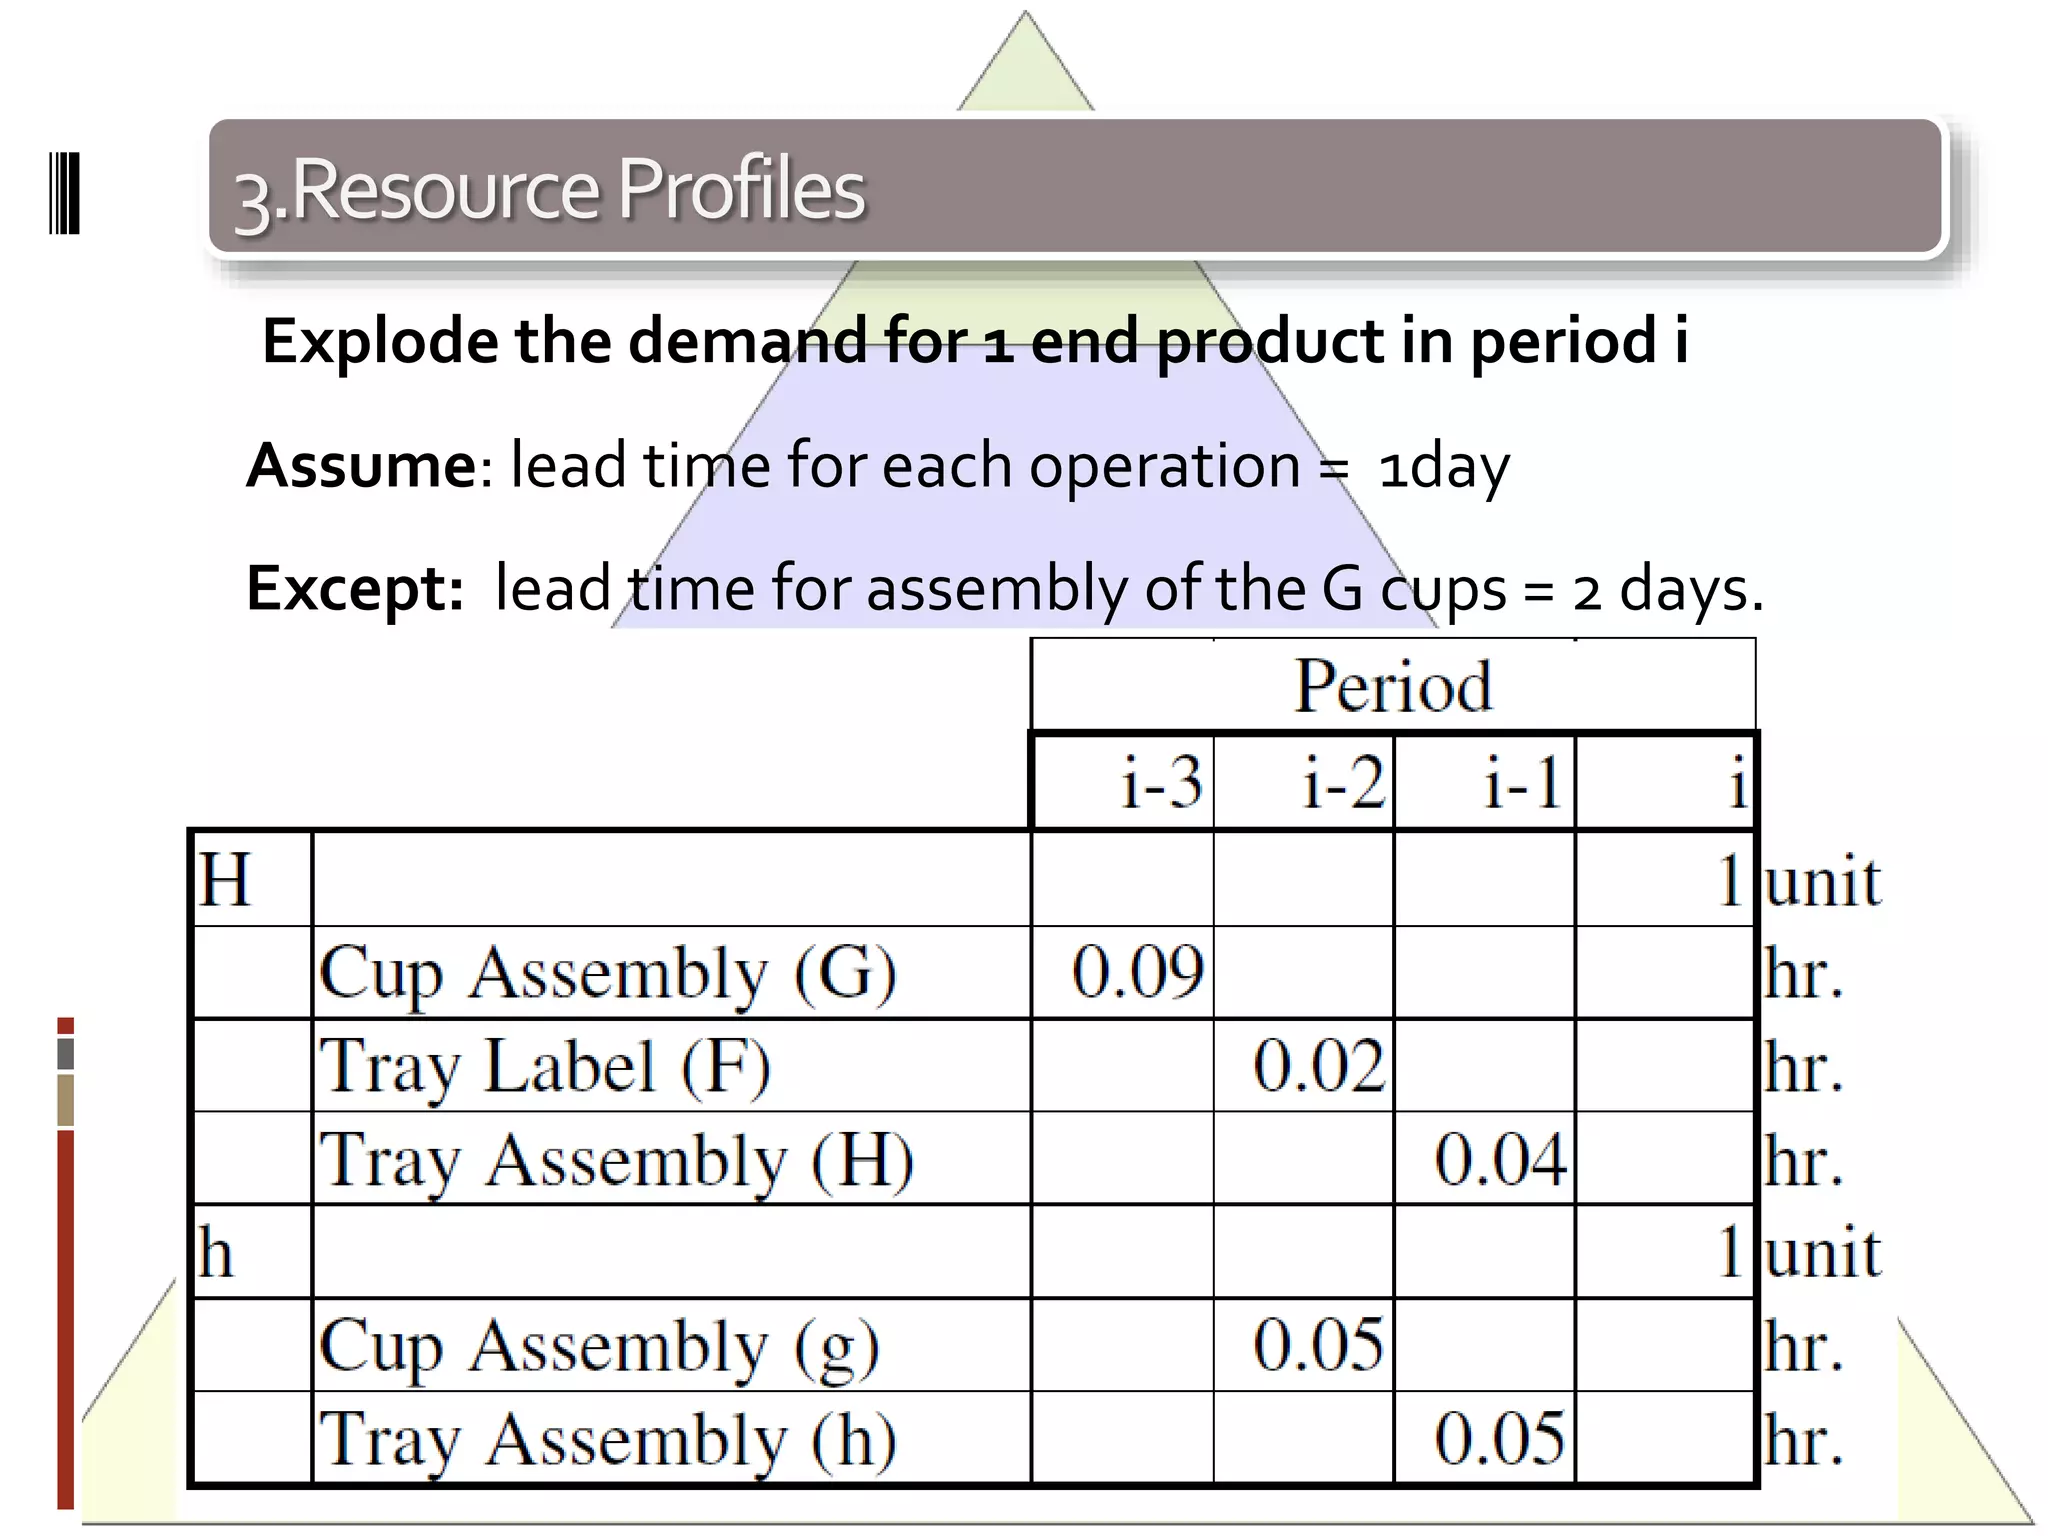
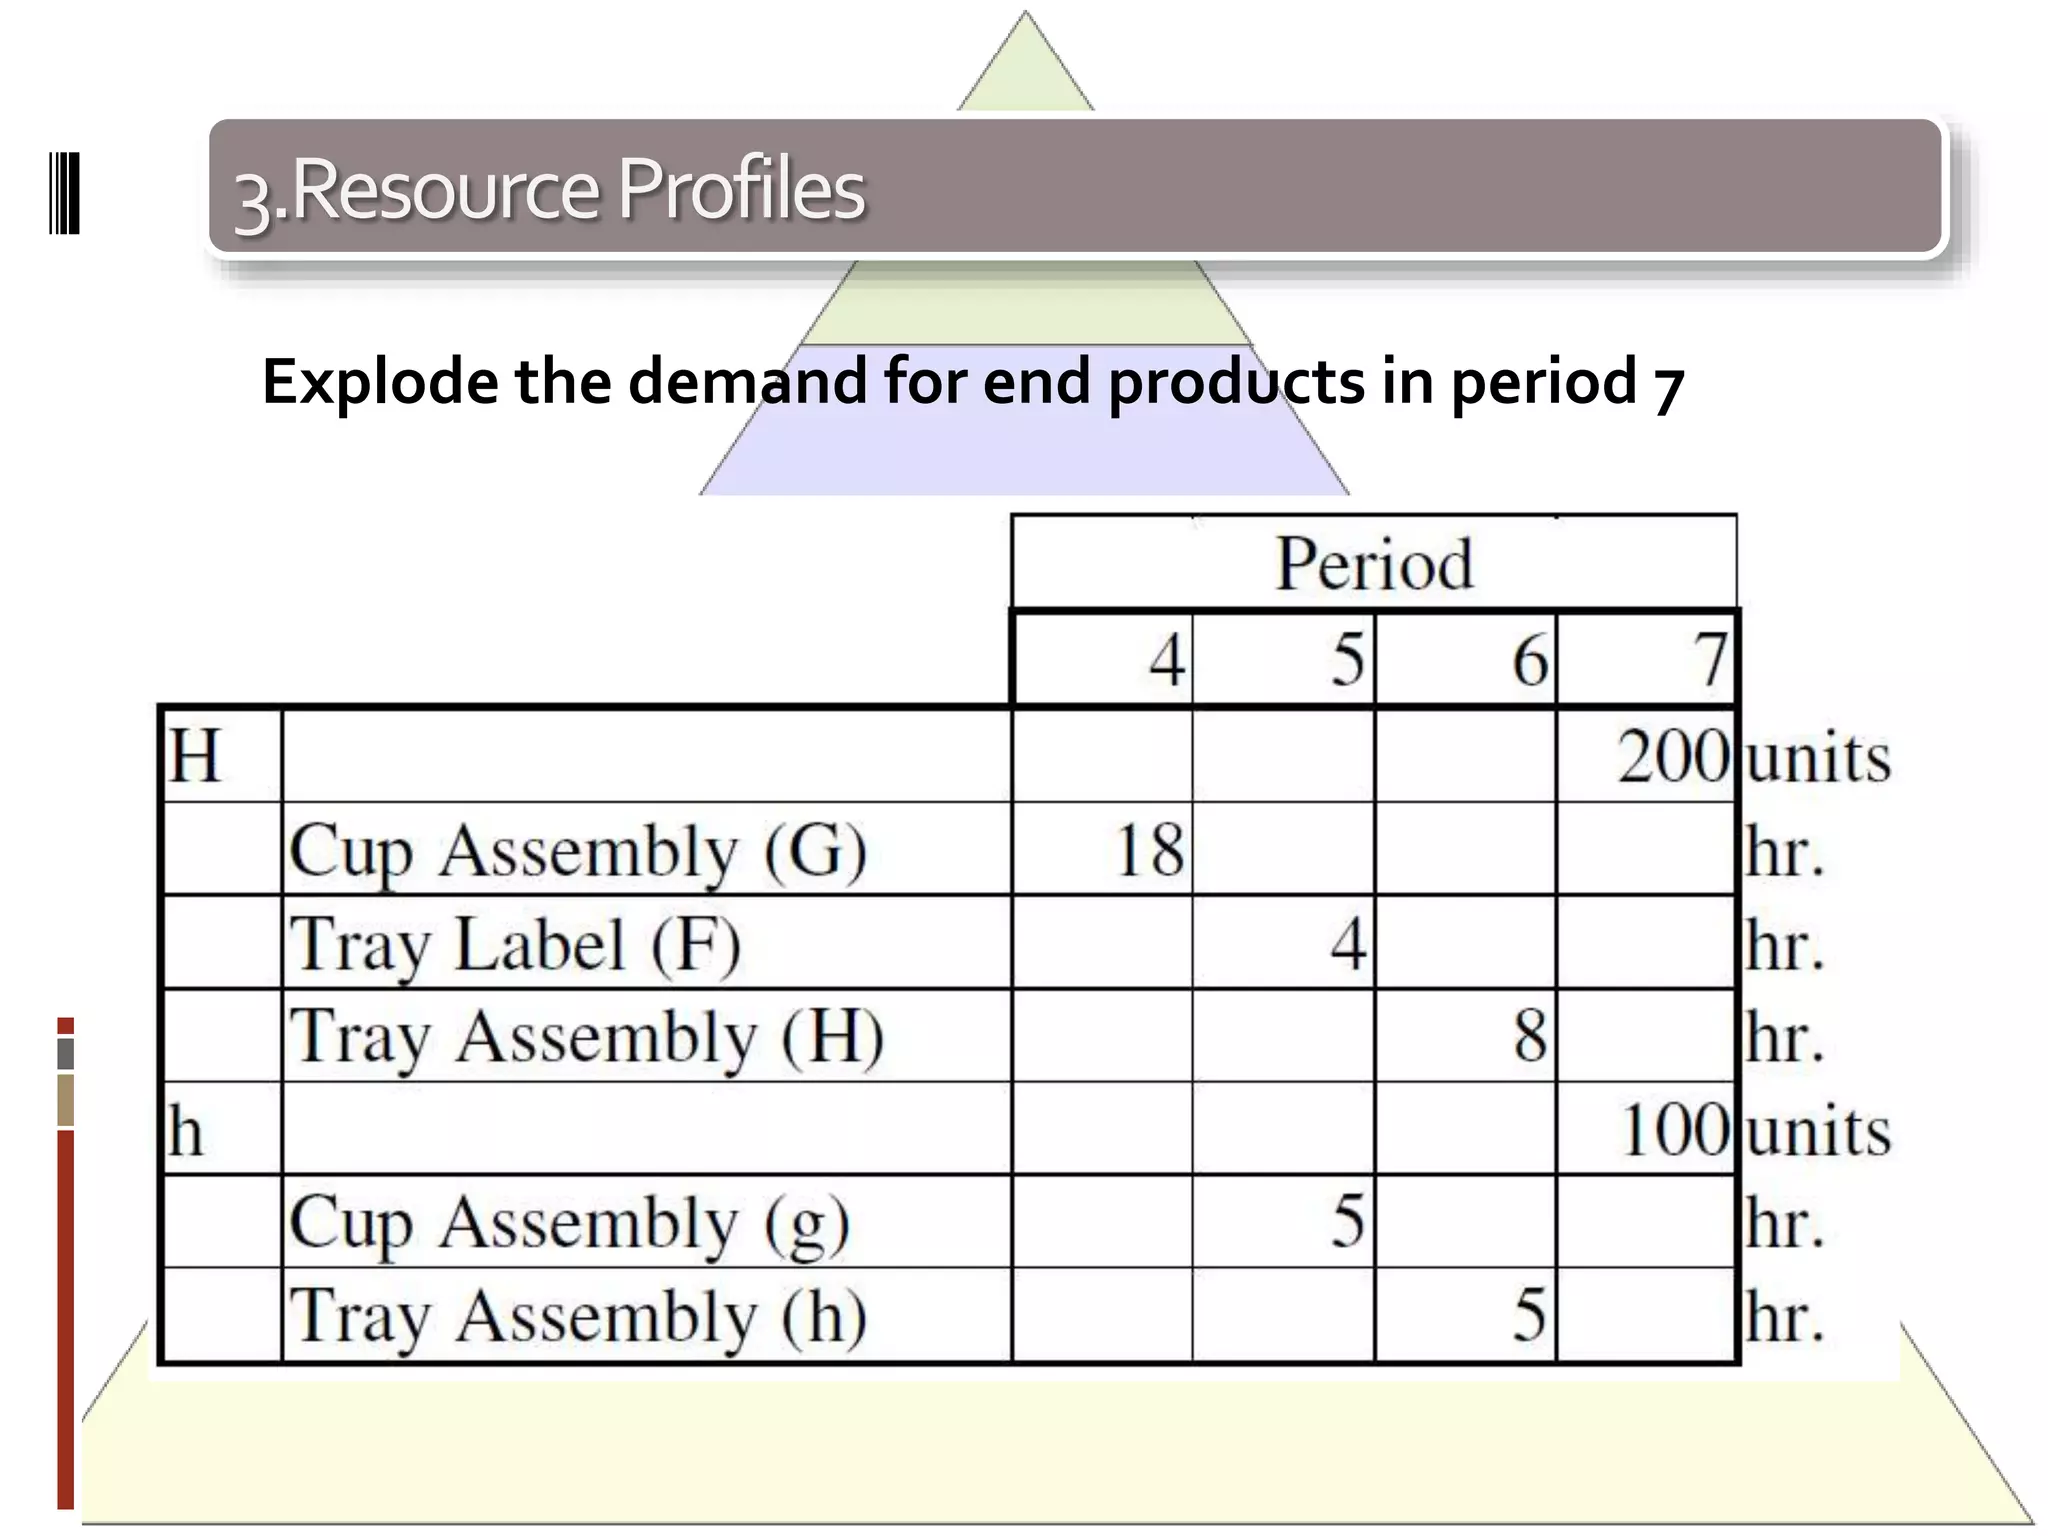
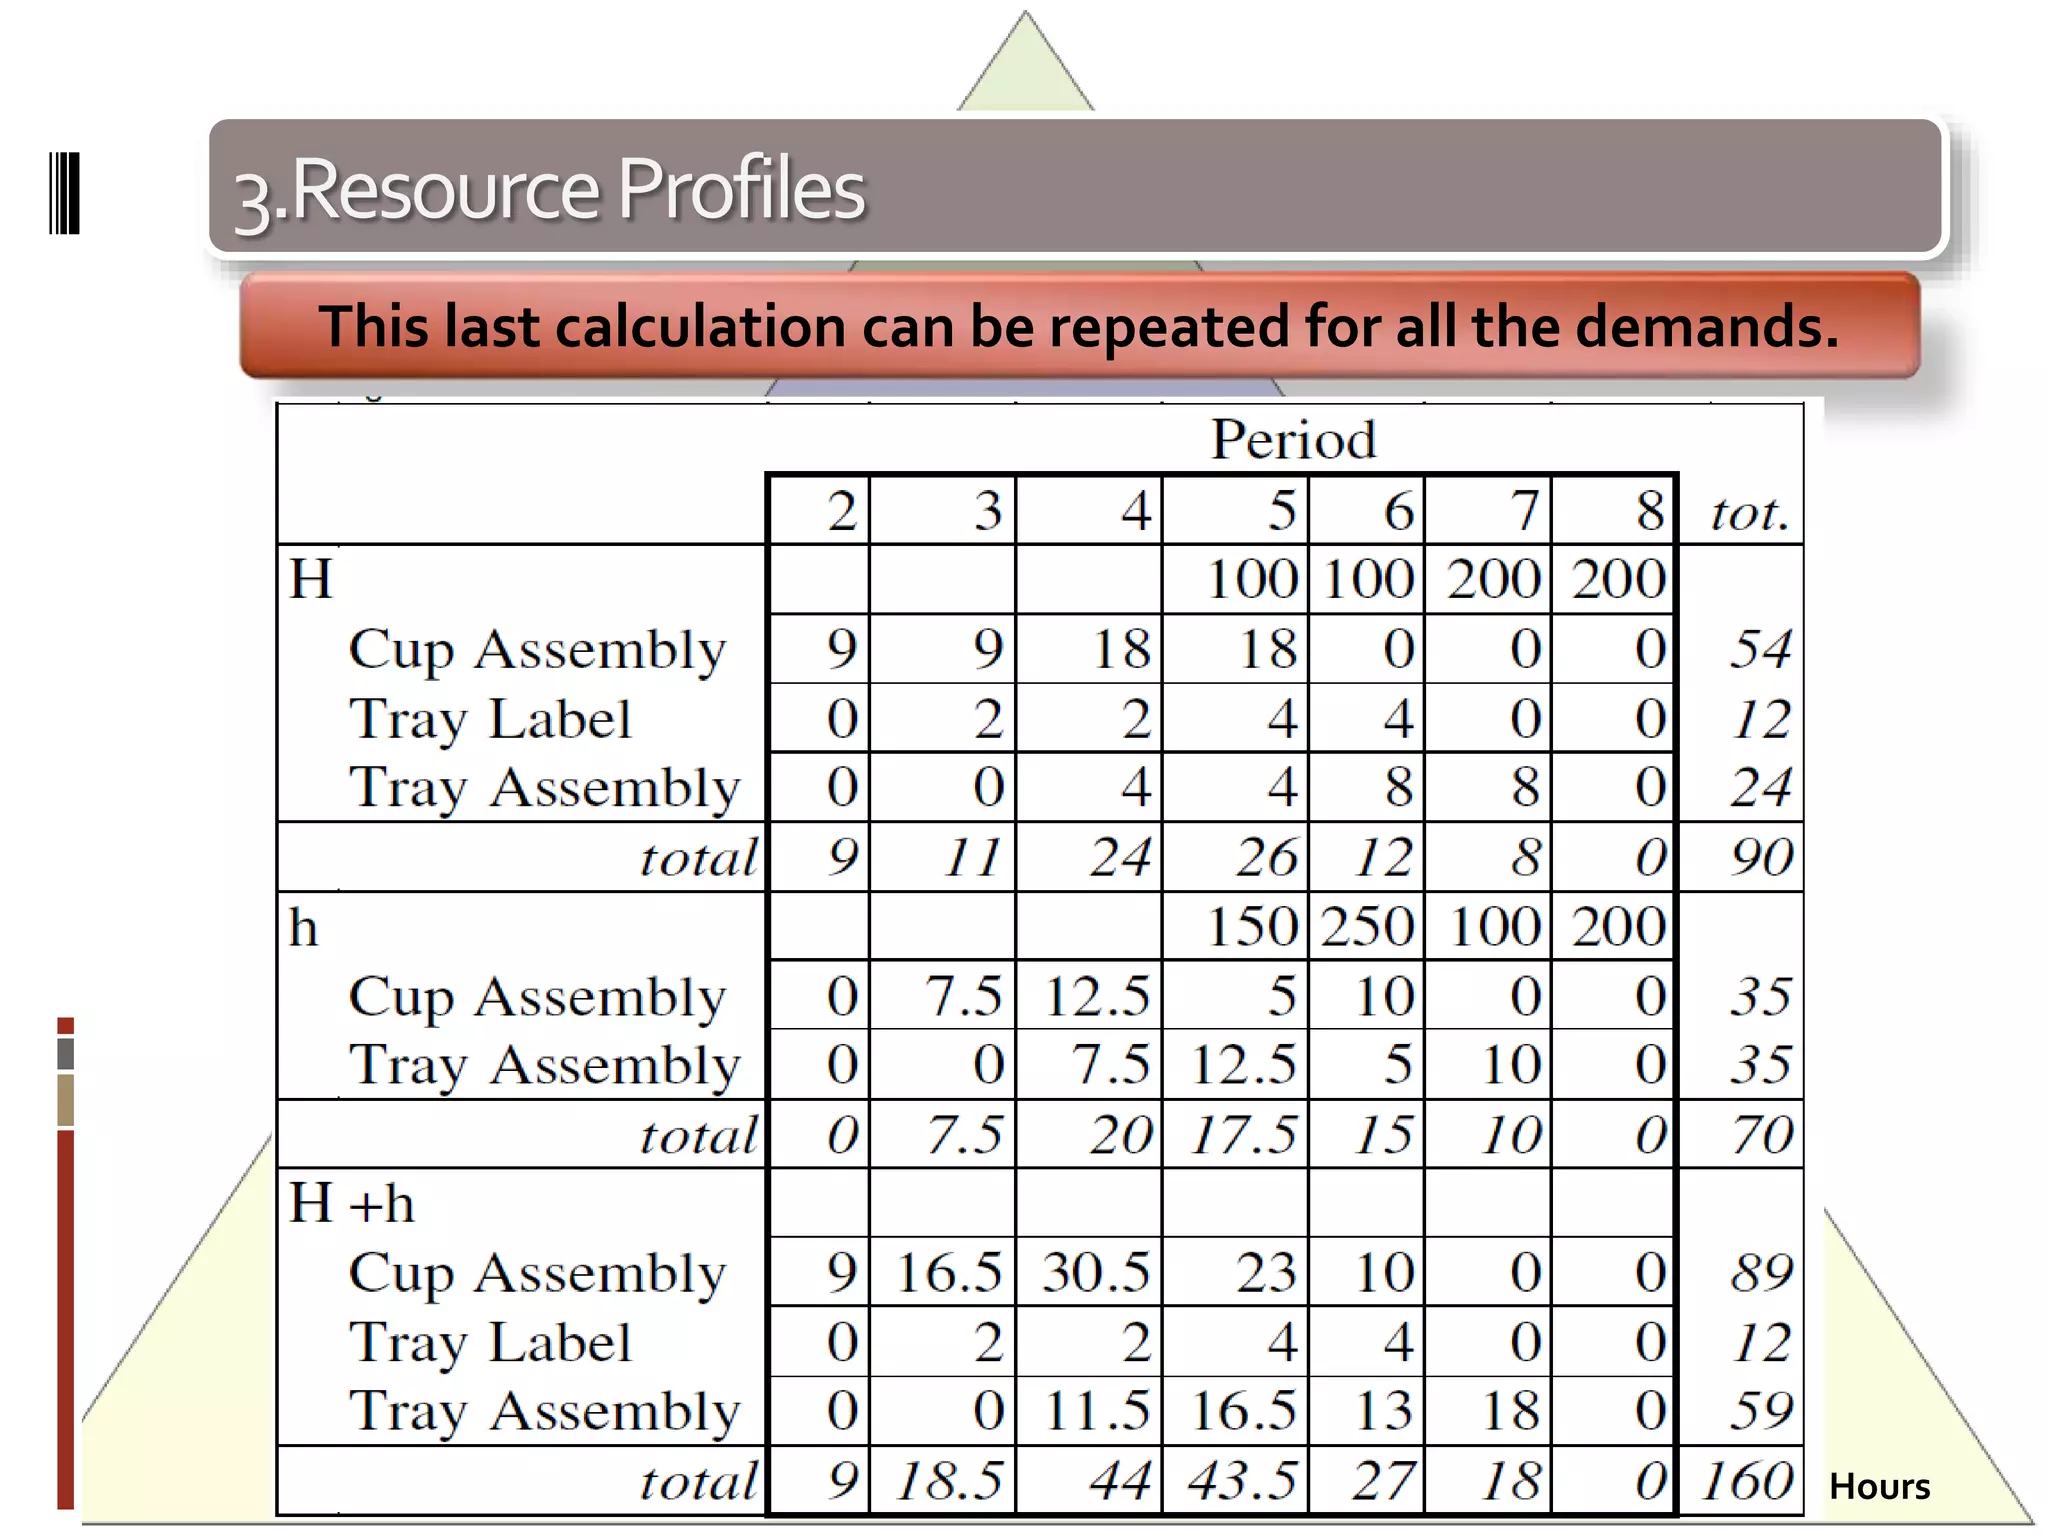
![2.CapacityBills.
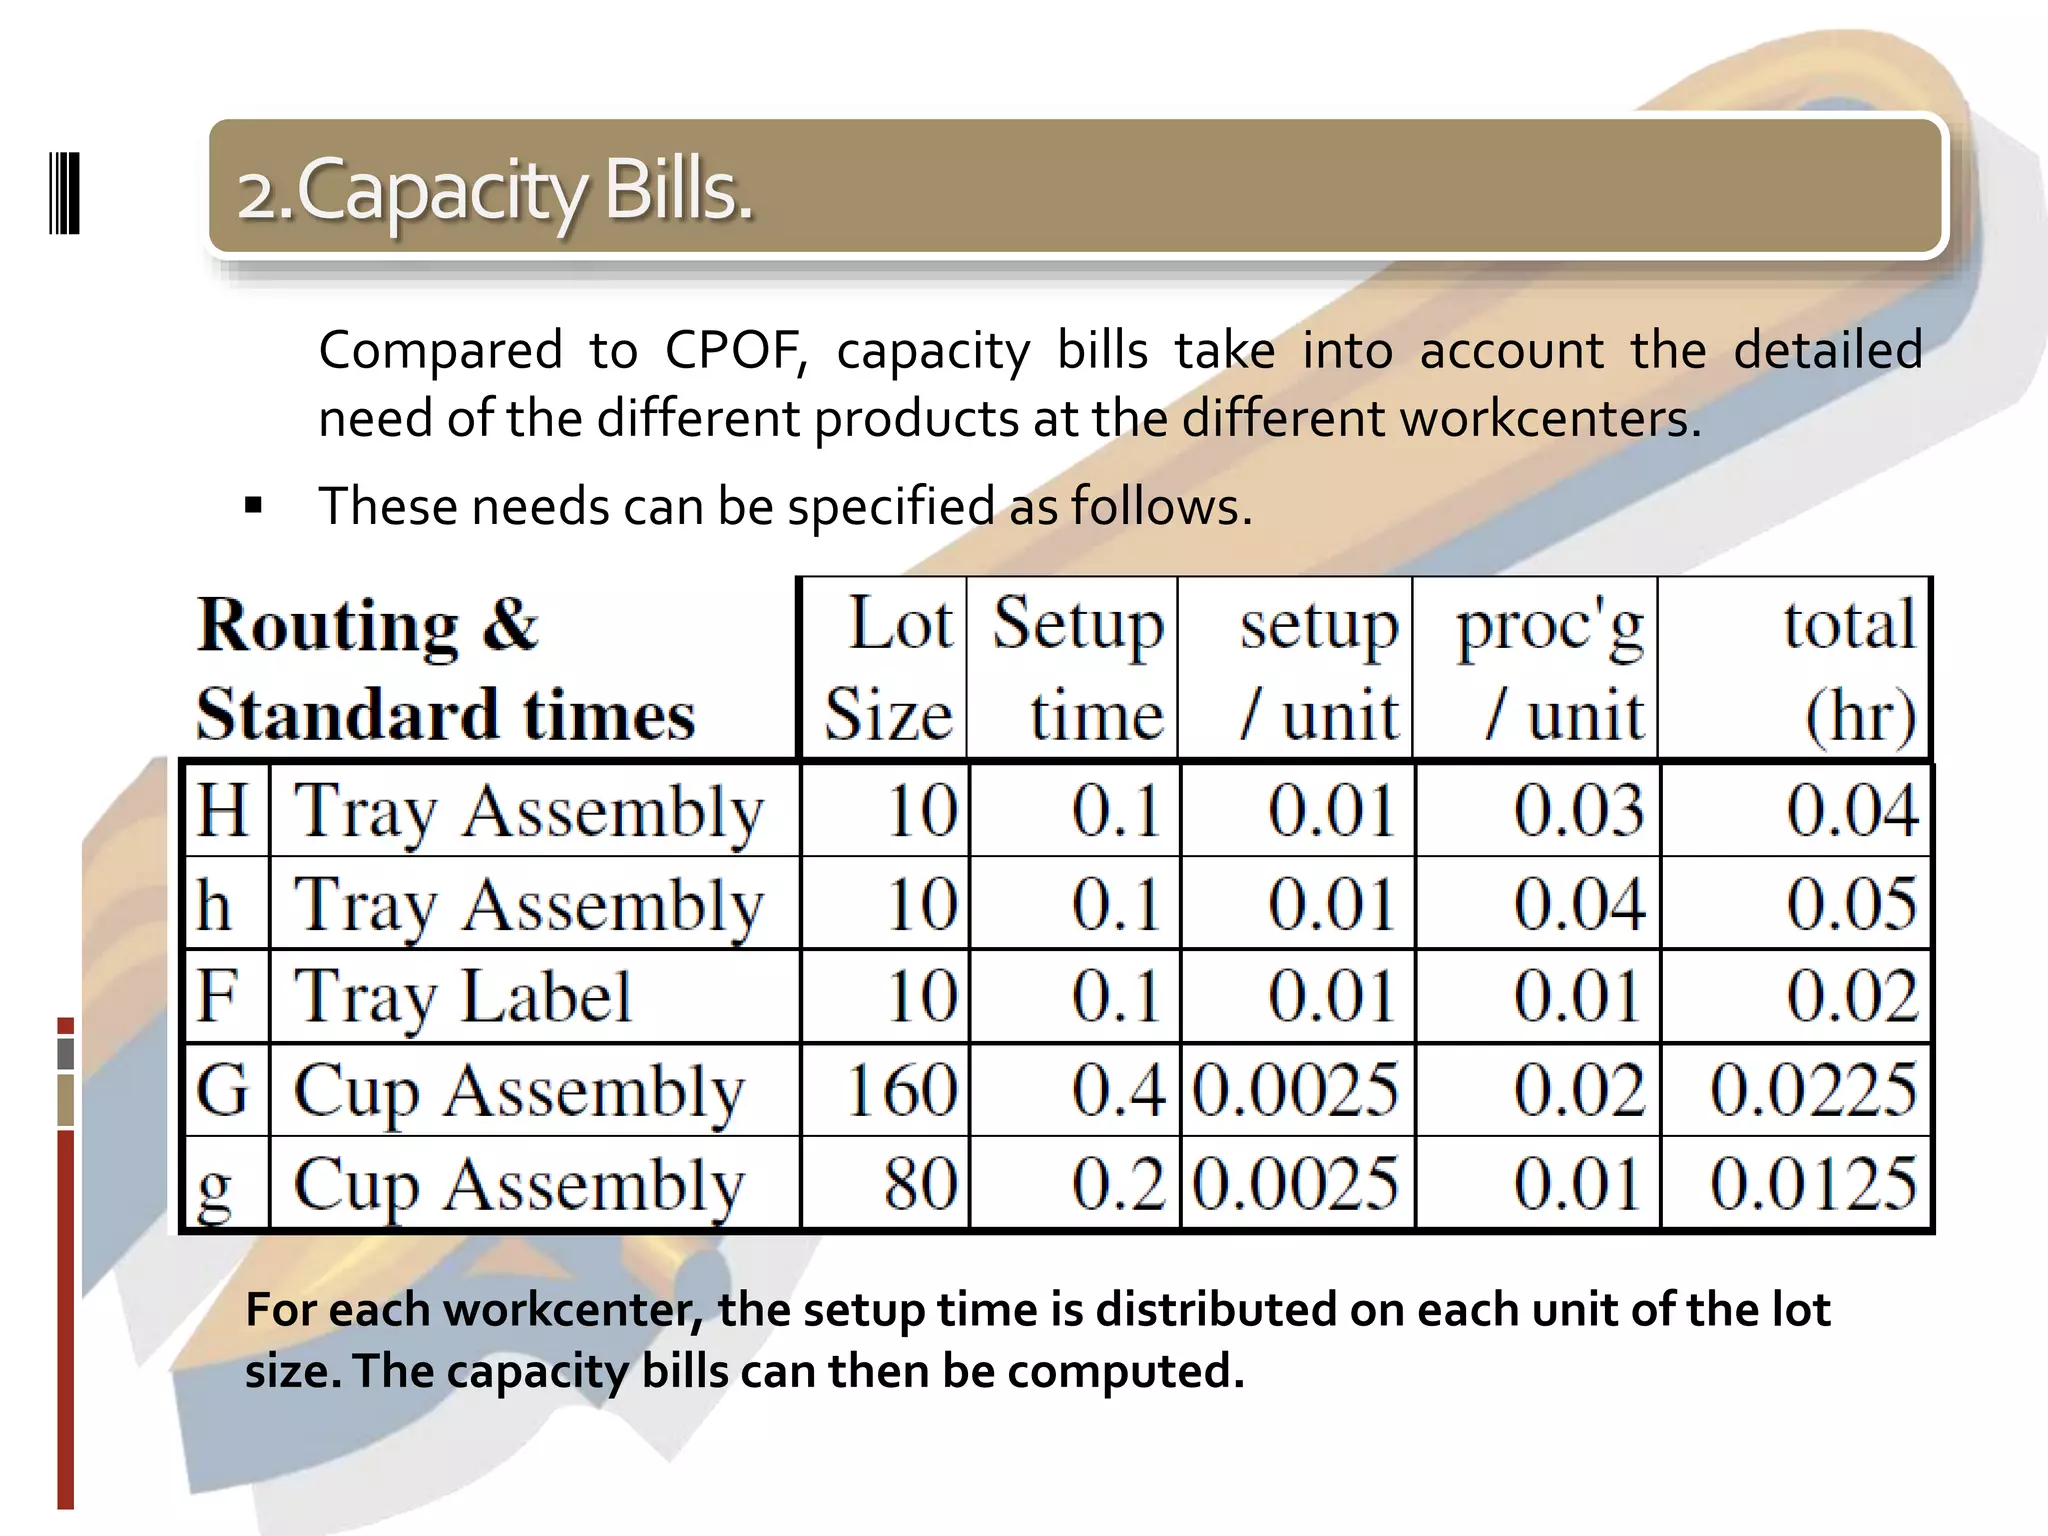
Capacity requirements Using Capacity Bills
Workcenter load = [H capacity bill/product )x (H products/period)
+ (h capacity bill/product )x (h products/period)] Eq.2
At period time 5
Cup assembly = [0.09*100+0.05*150] = 16.5 hours
Tray label = [0.02*100 +0*150] = 2 hours
Tray assembly = [0.04*100+0.1*150]= 11.5 hours
Hours](https://image.slidesharecdn.com/manufacturingplanningandcontrolsystems-140331165937-phpapp02/75/Manufacturing-planning-and-control-systems-18-2048.jpg)

![1.CapacityPlanningInMPCSystem
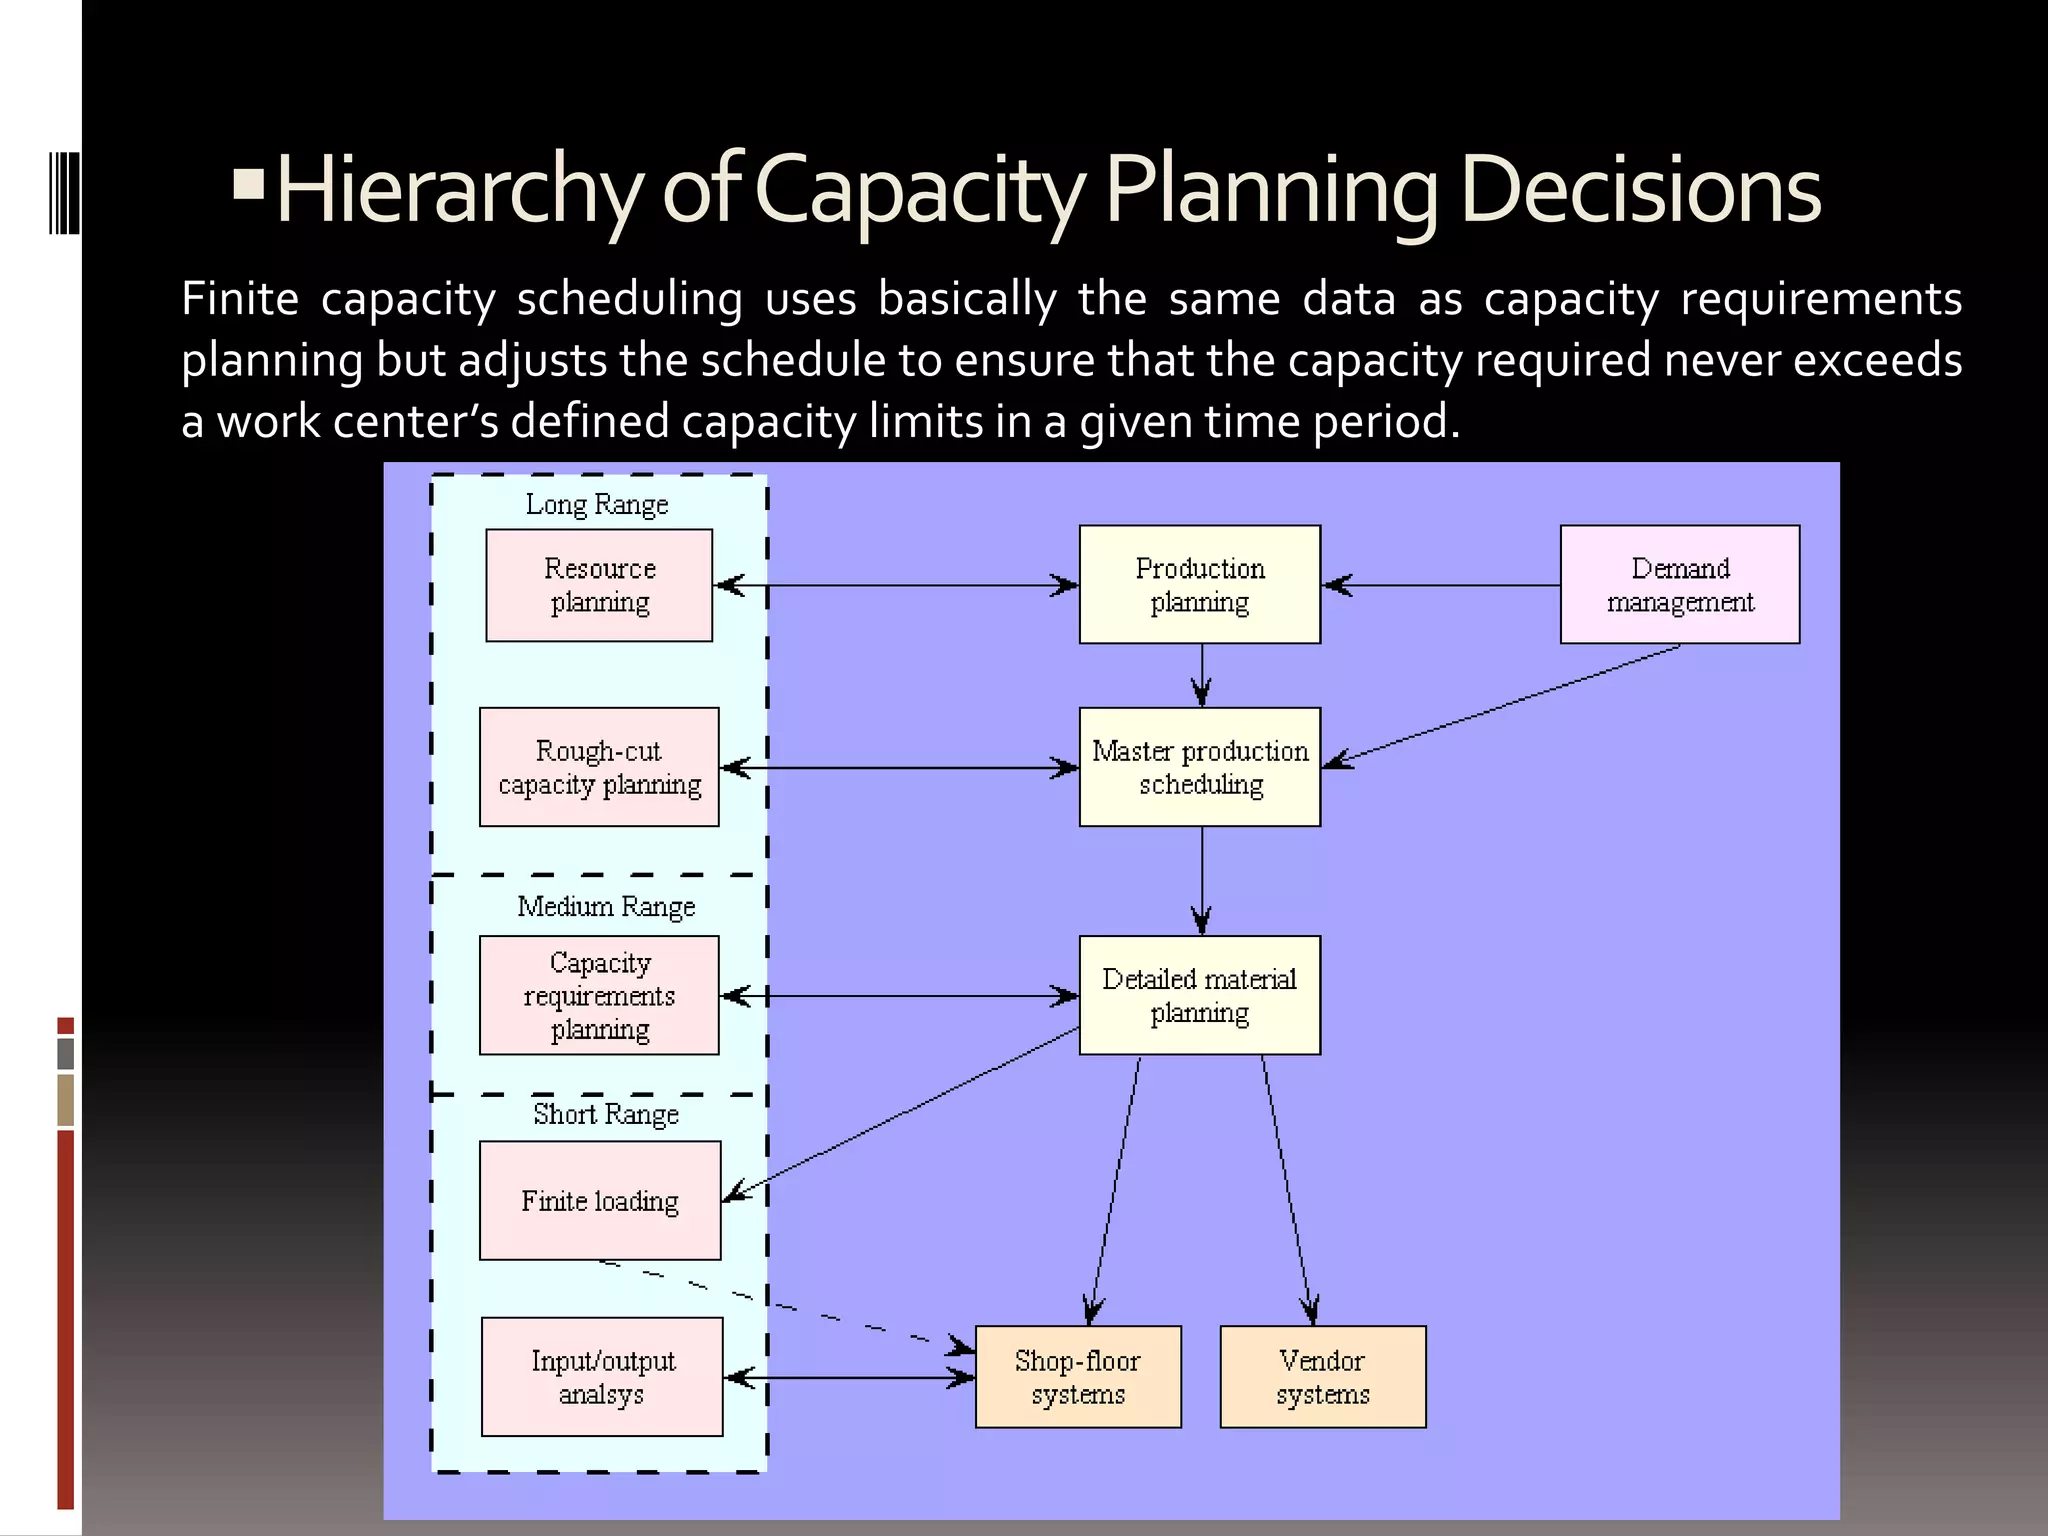
From Hierarchy of Capacity Planning figure there
are relationship between MPC framework and
various capacity planning modules (five modules
range [long range –day to day] ):
o Vertical relationship among the capacity
planning modules
o Horizontal relationship with the material
planning modules of the MPC system .](https://image.slidesharecdn.com/manufacturingplanningandcontrolsystems-140331165937-phpapp02/75/Manufacturing-planning-and-control-systems-32-2048.jpg)
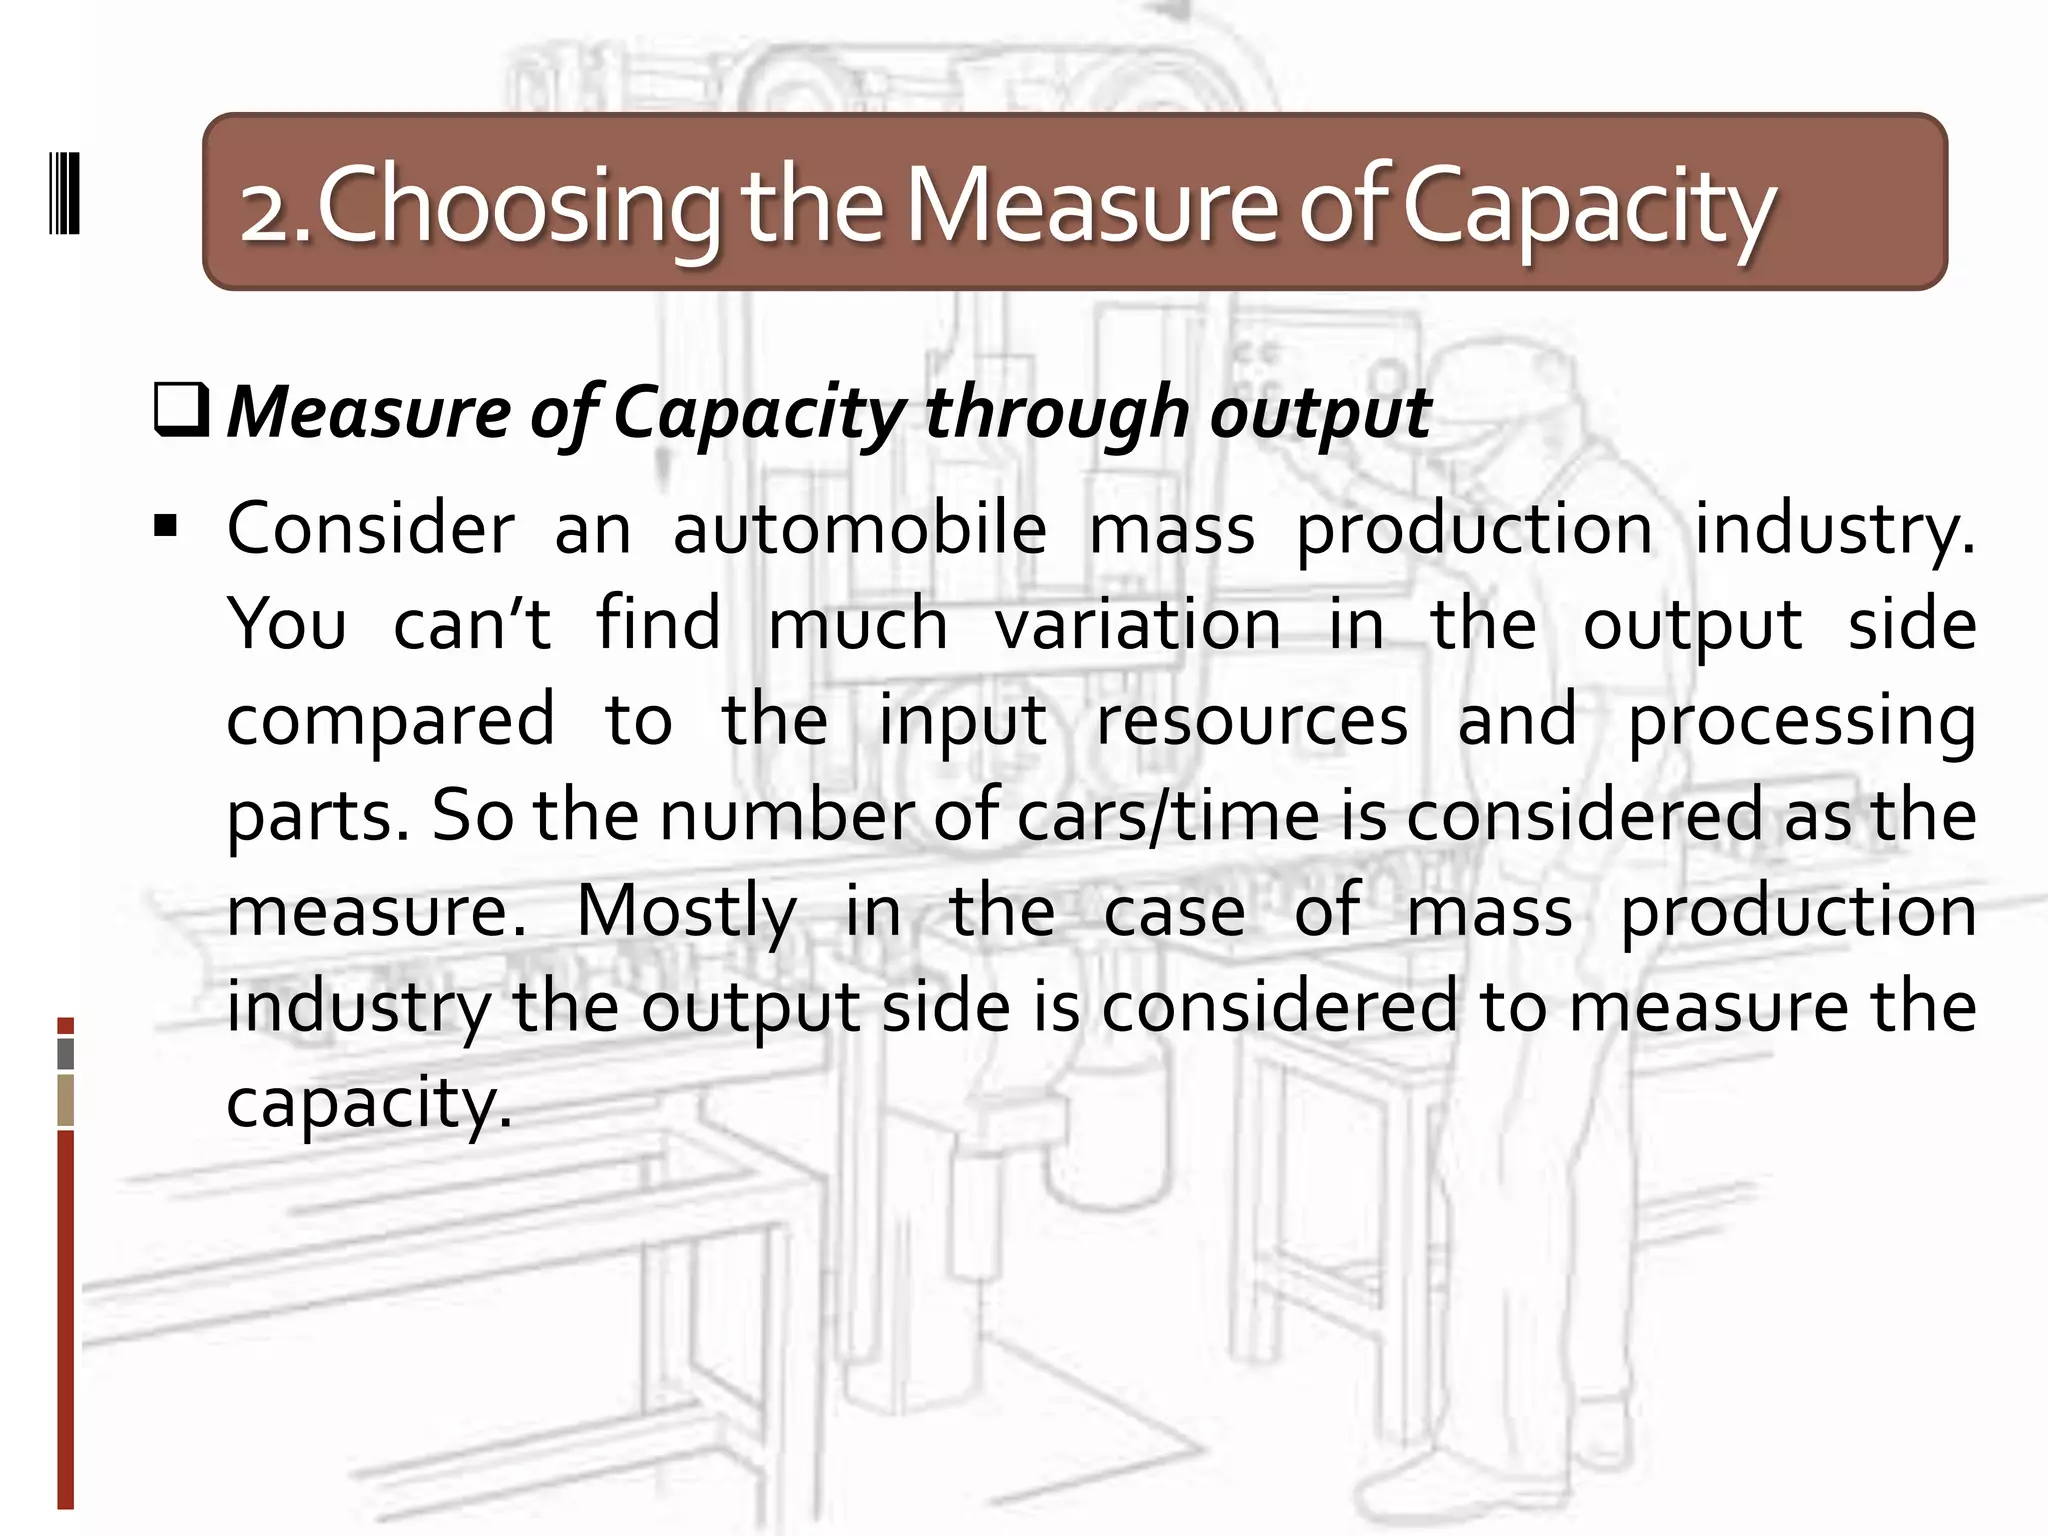
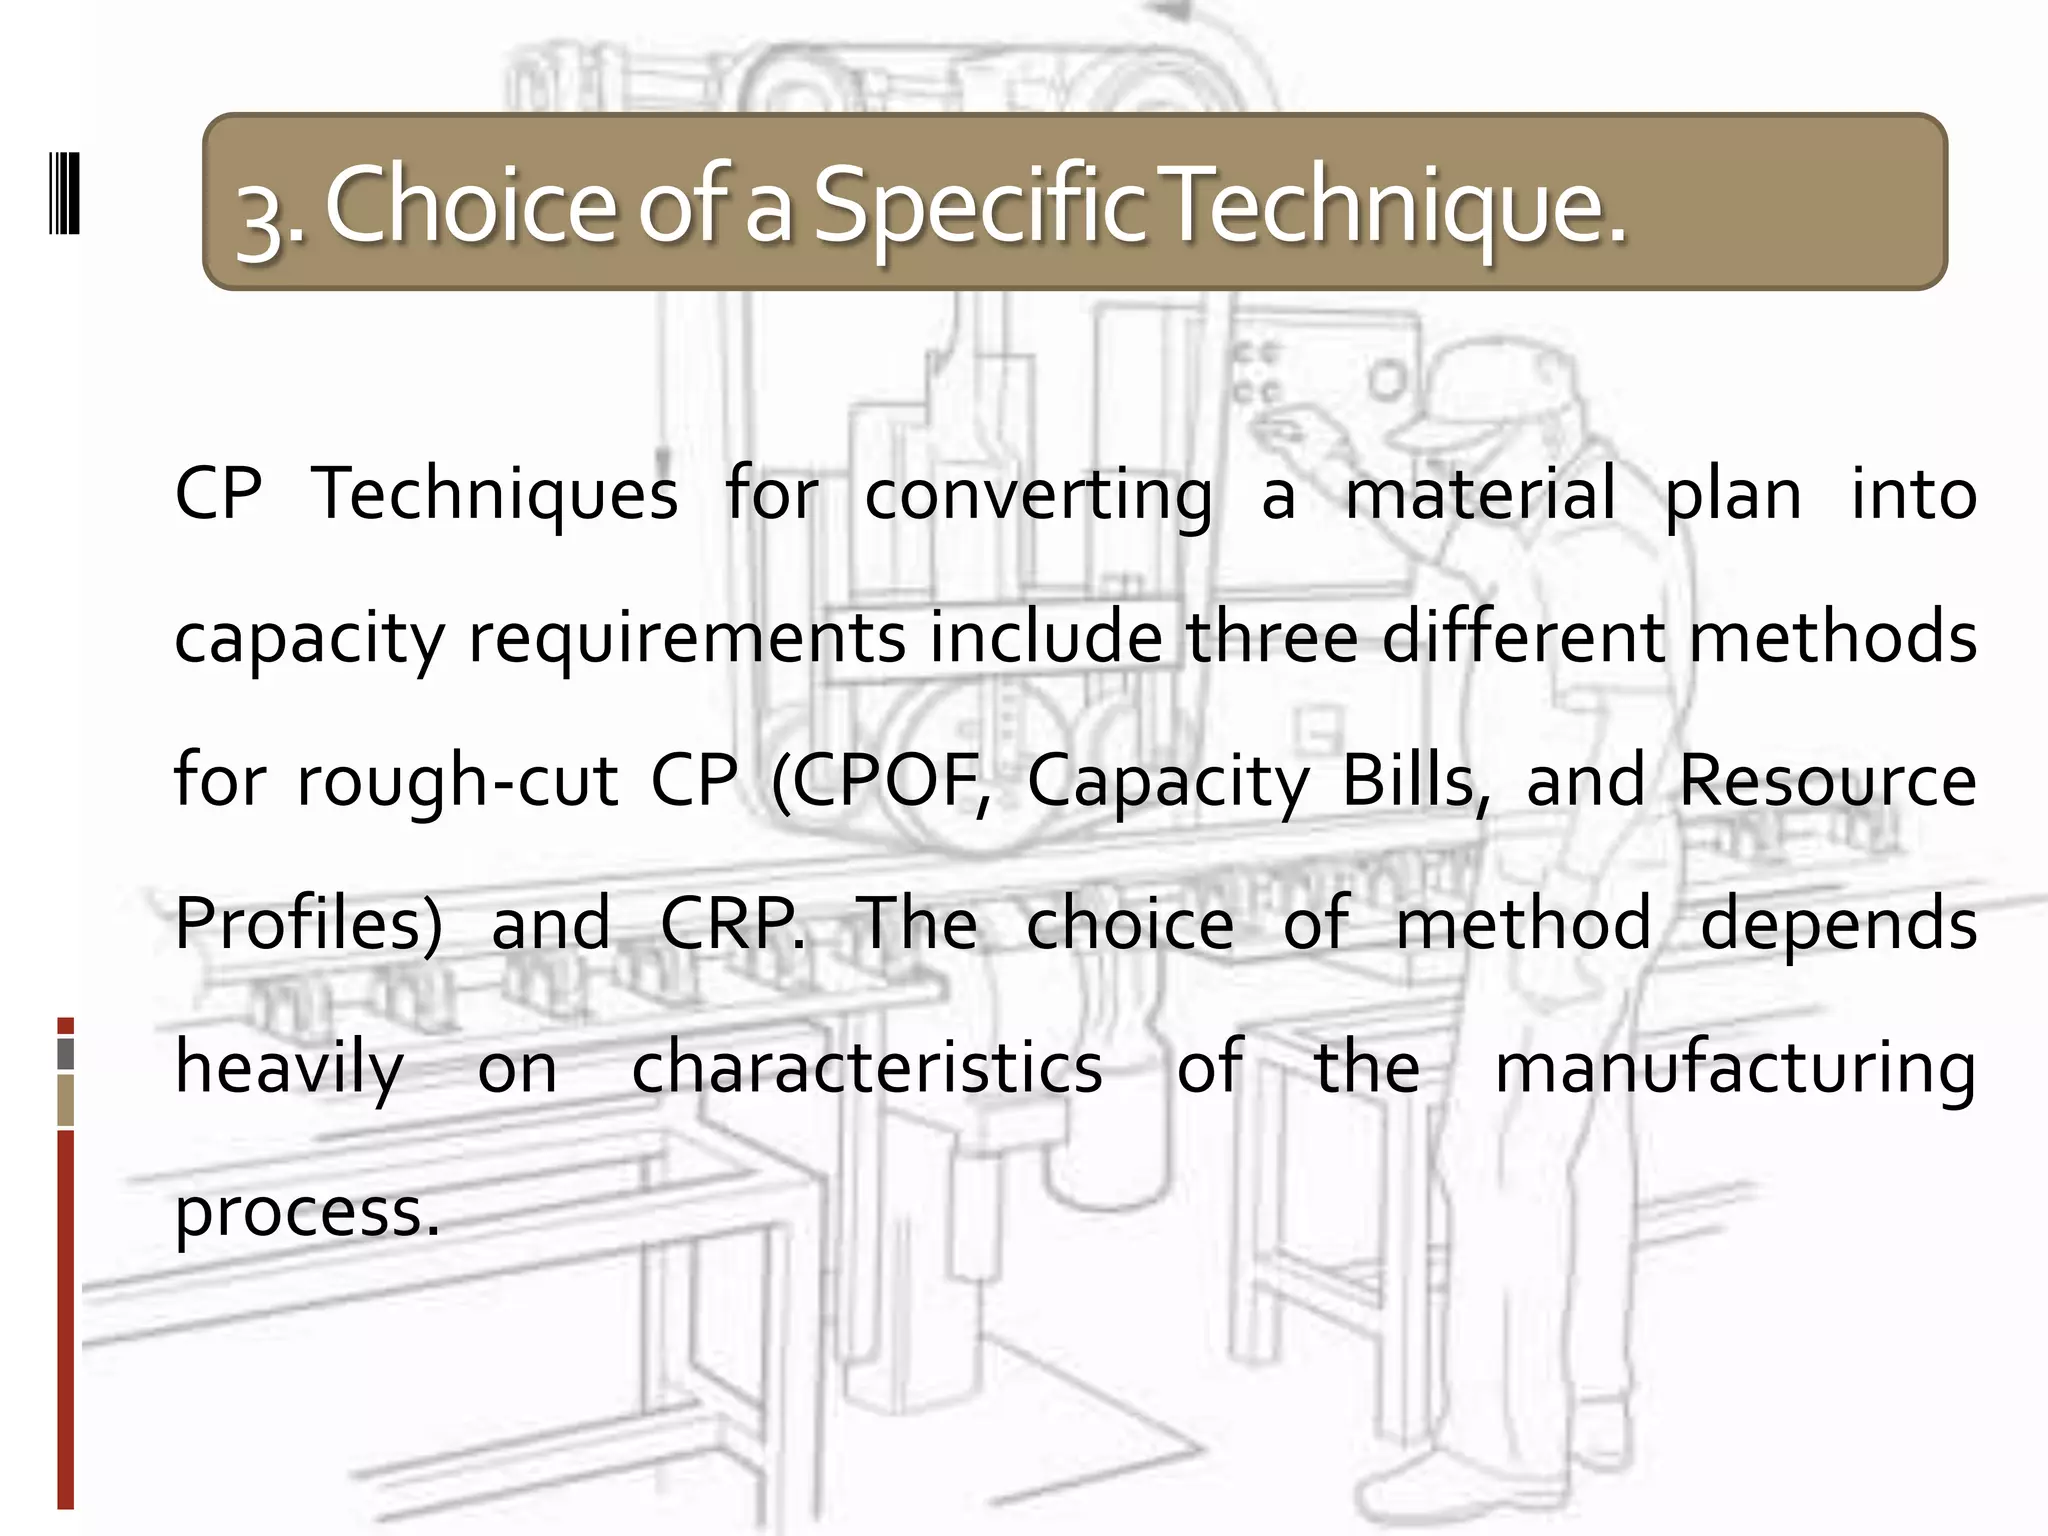


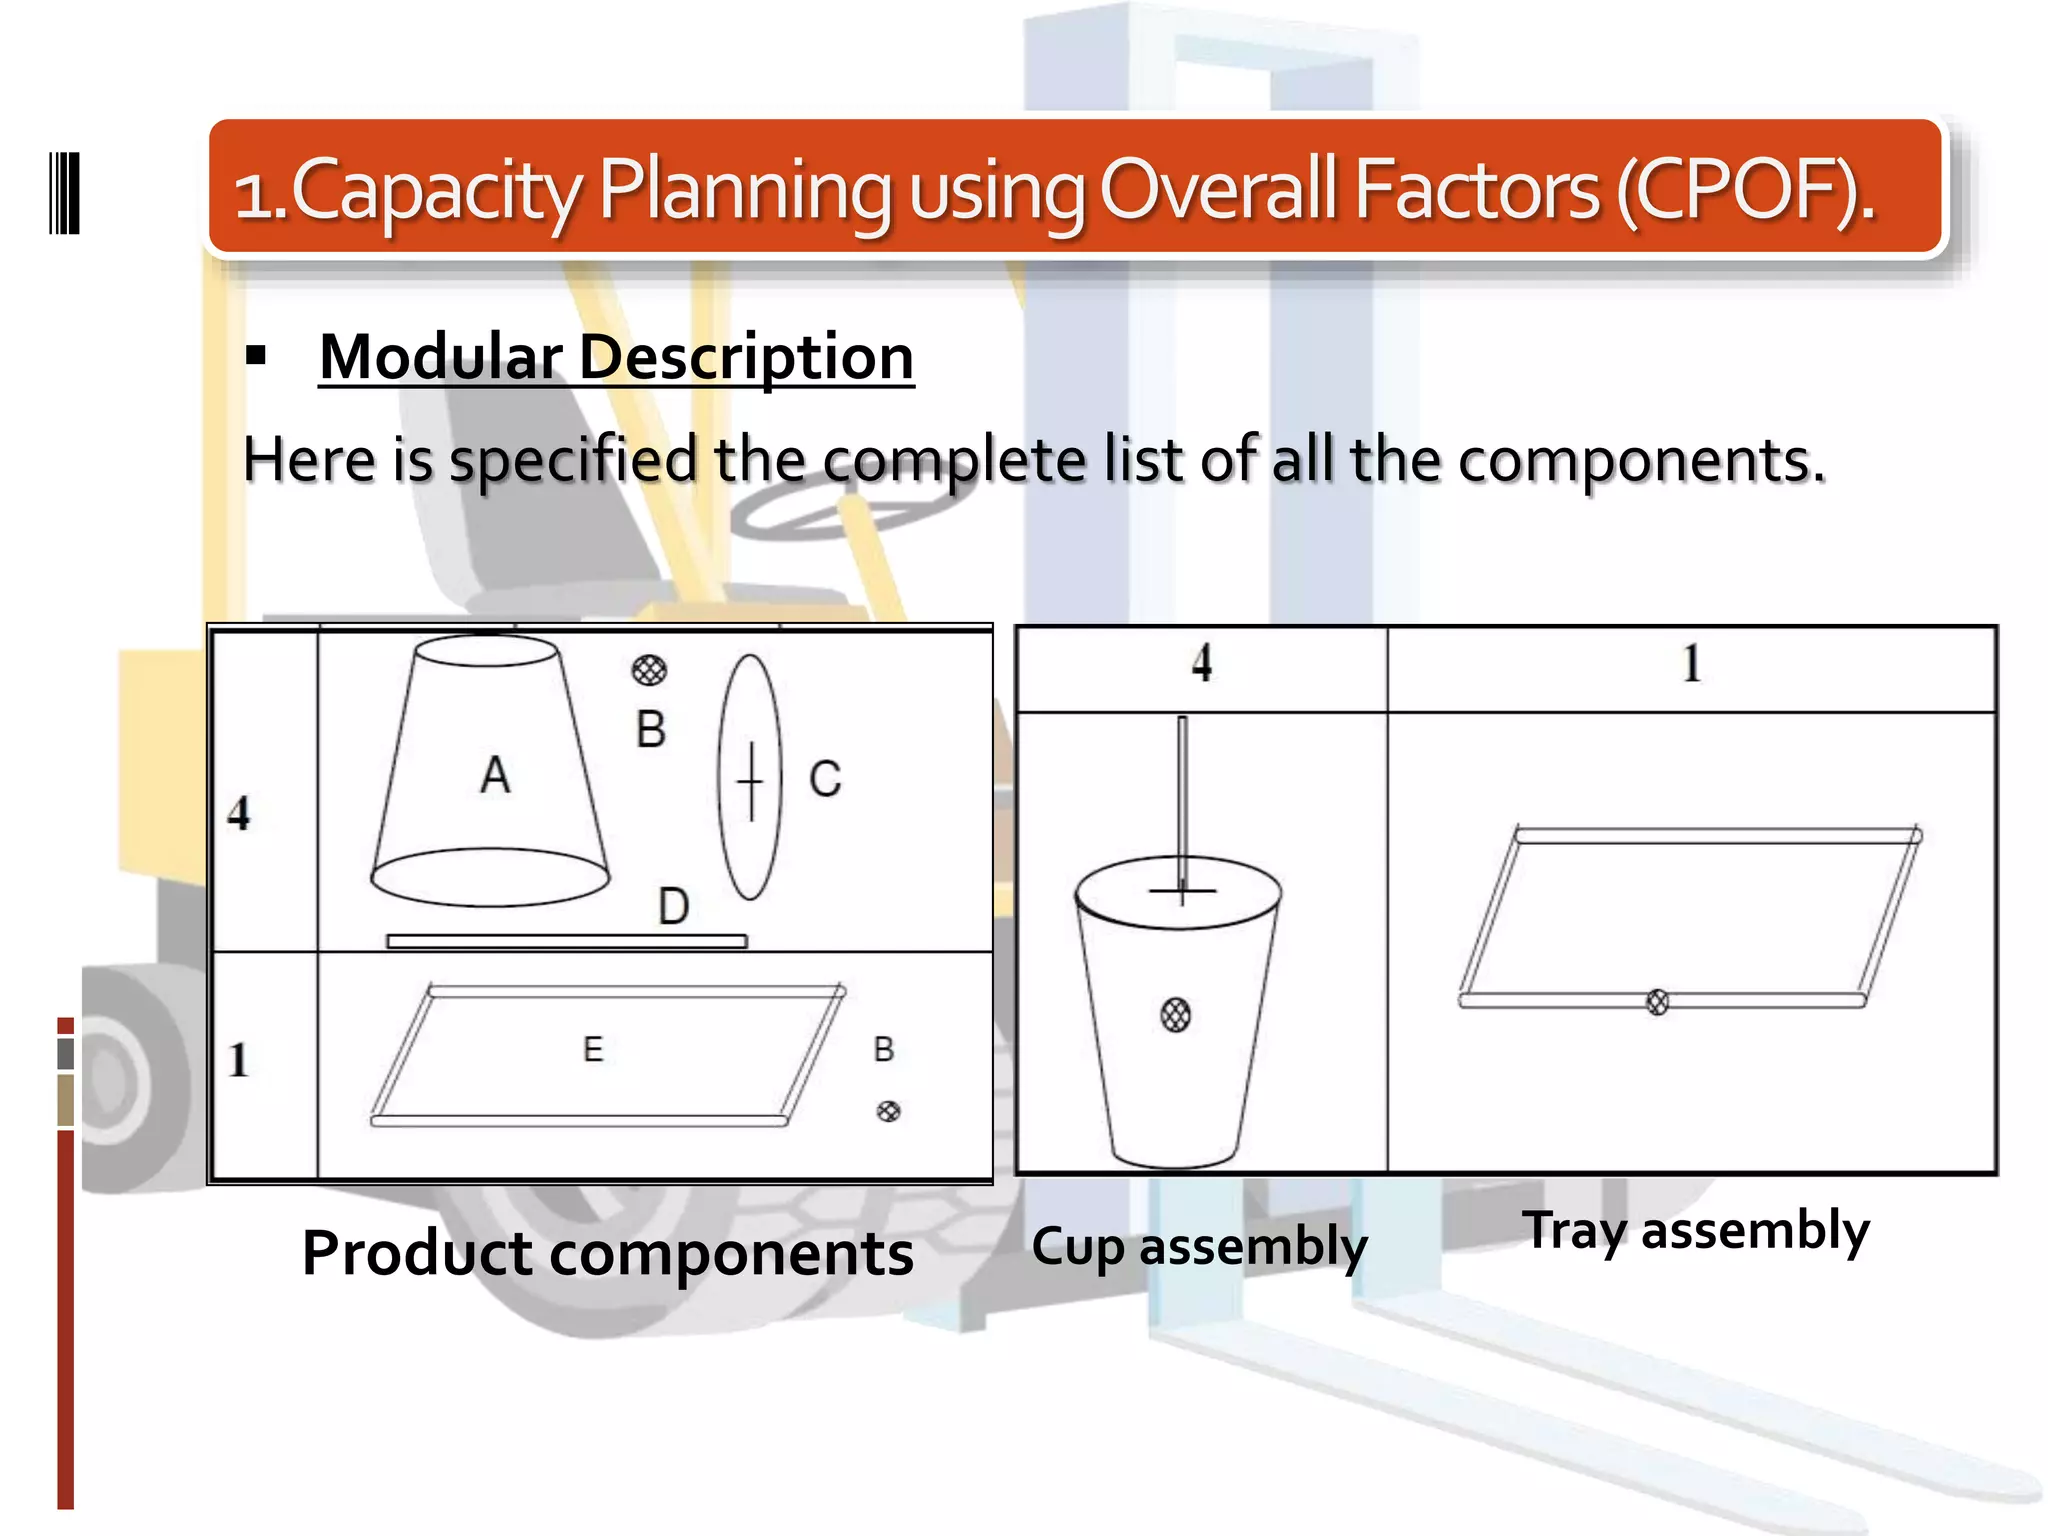
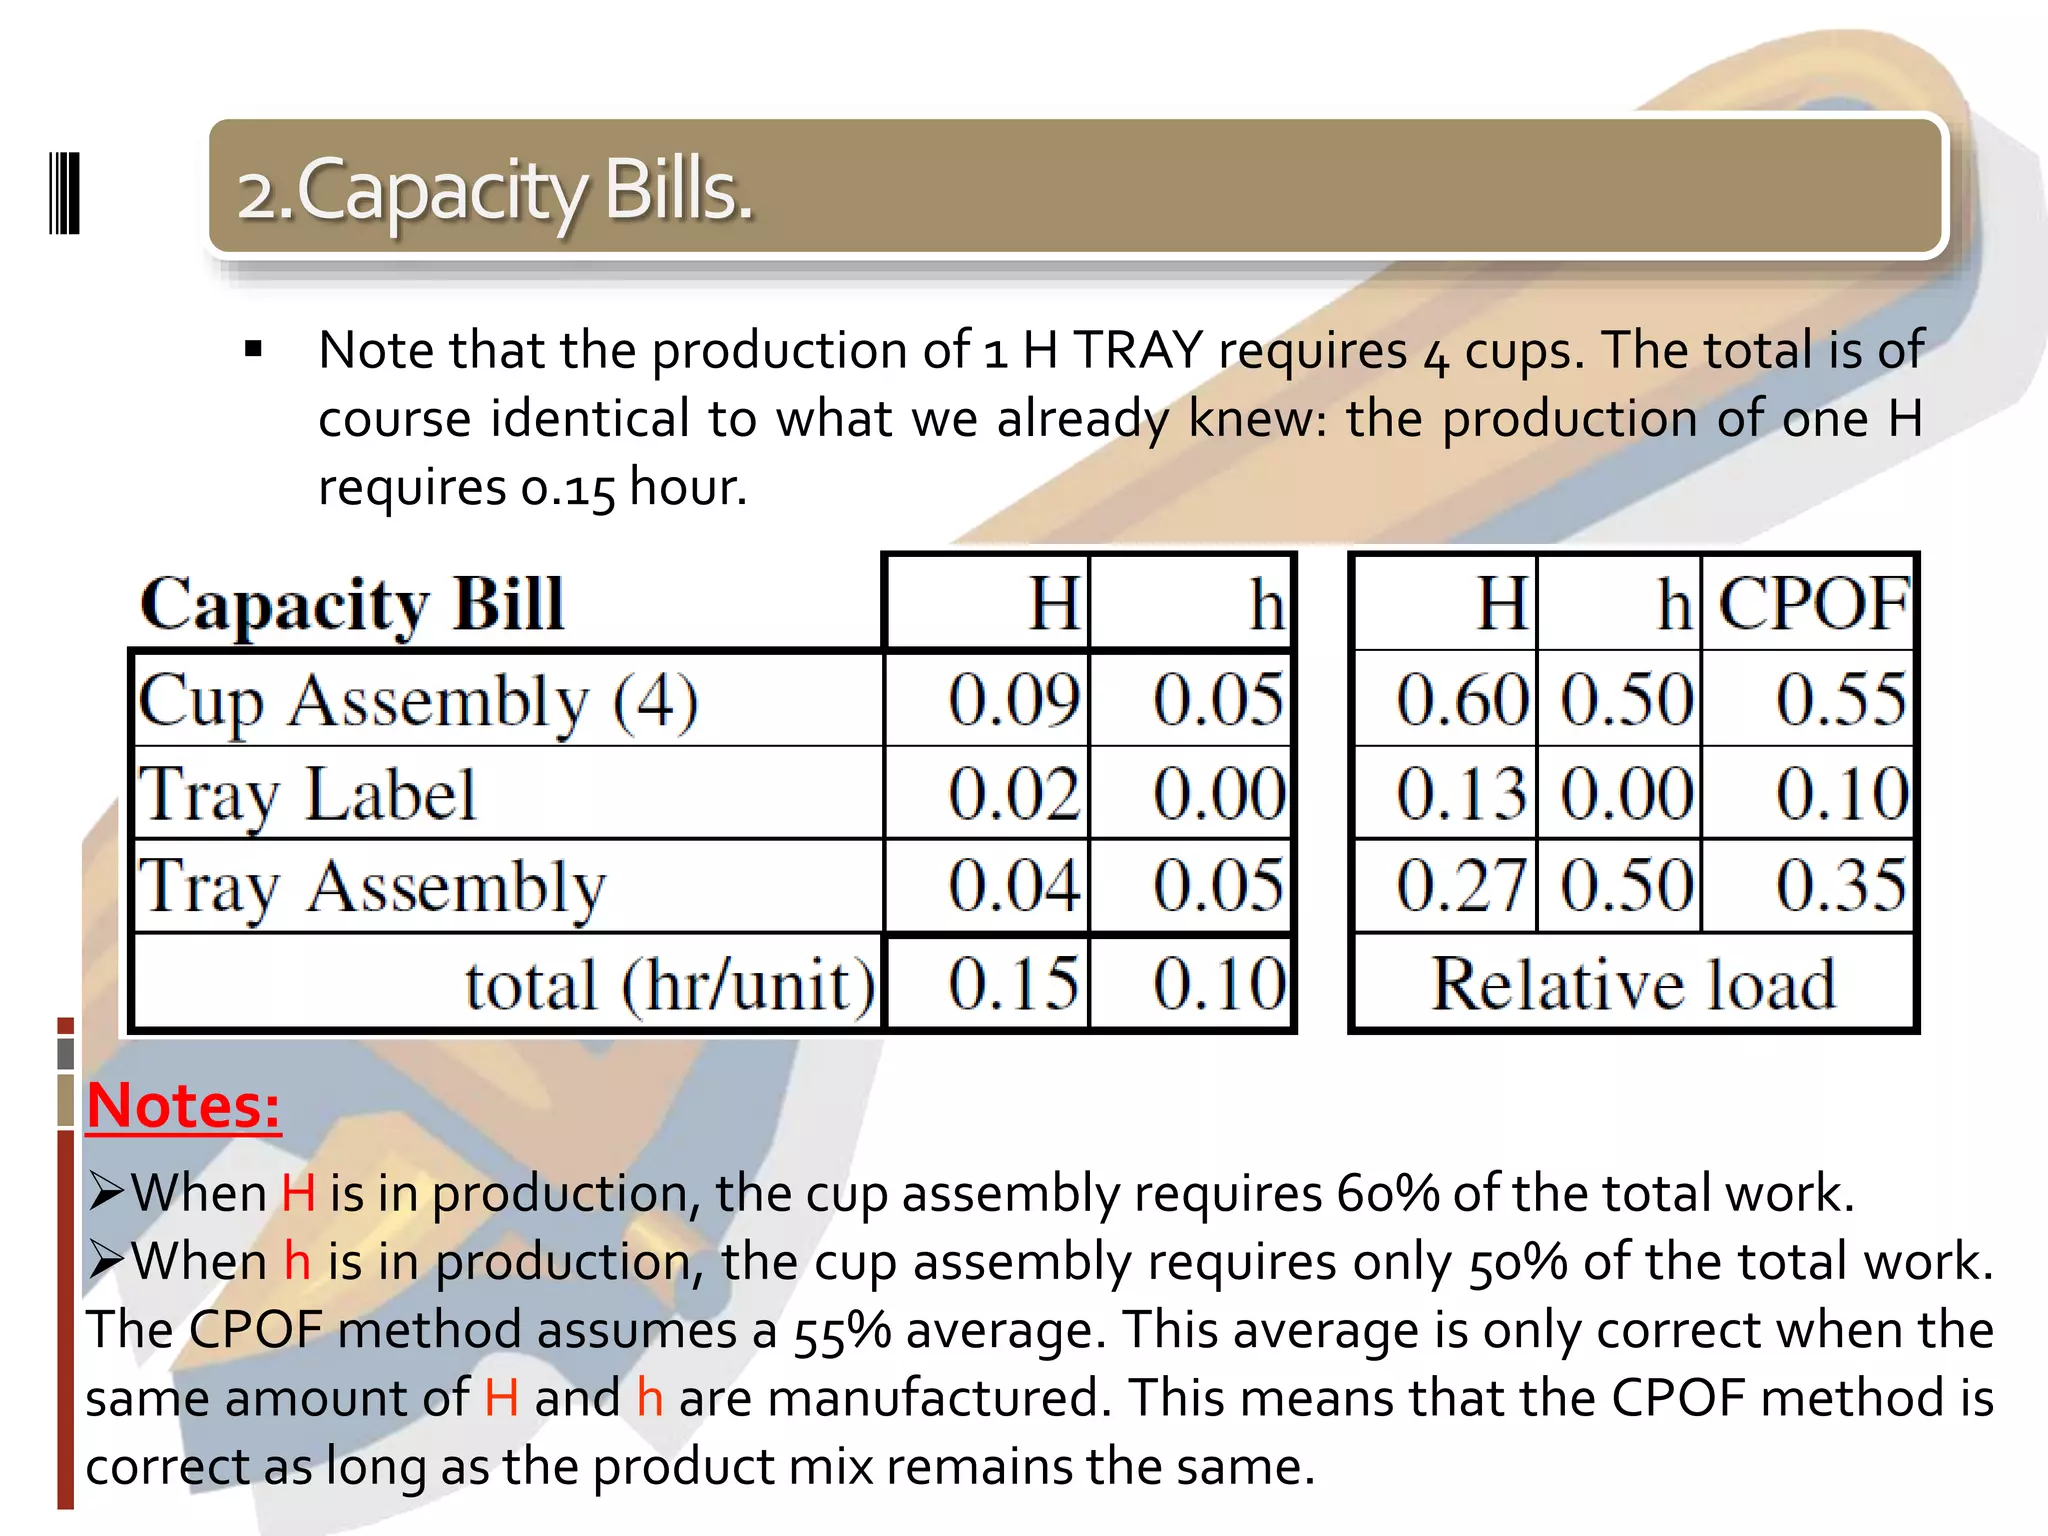
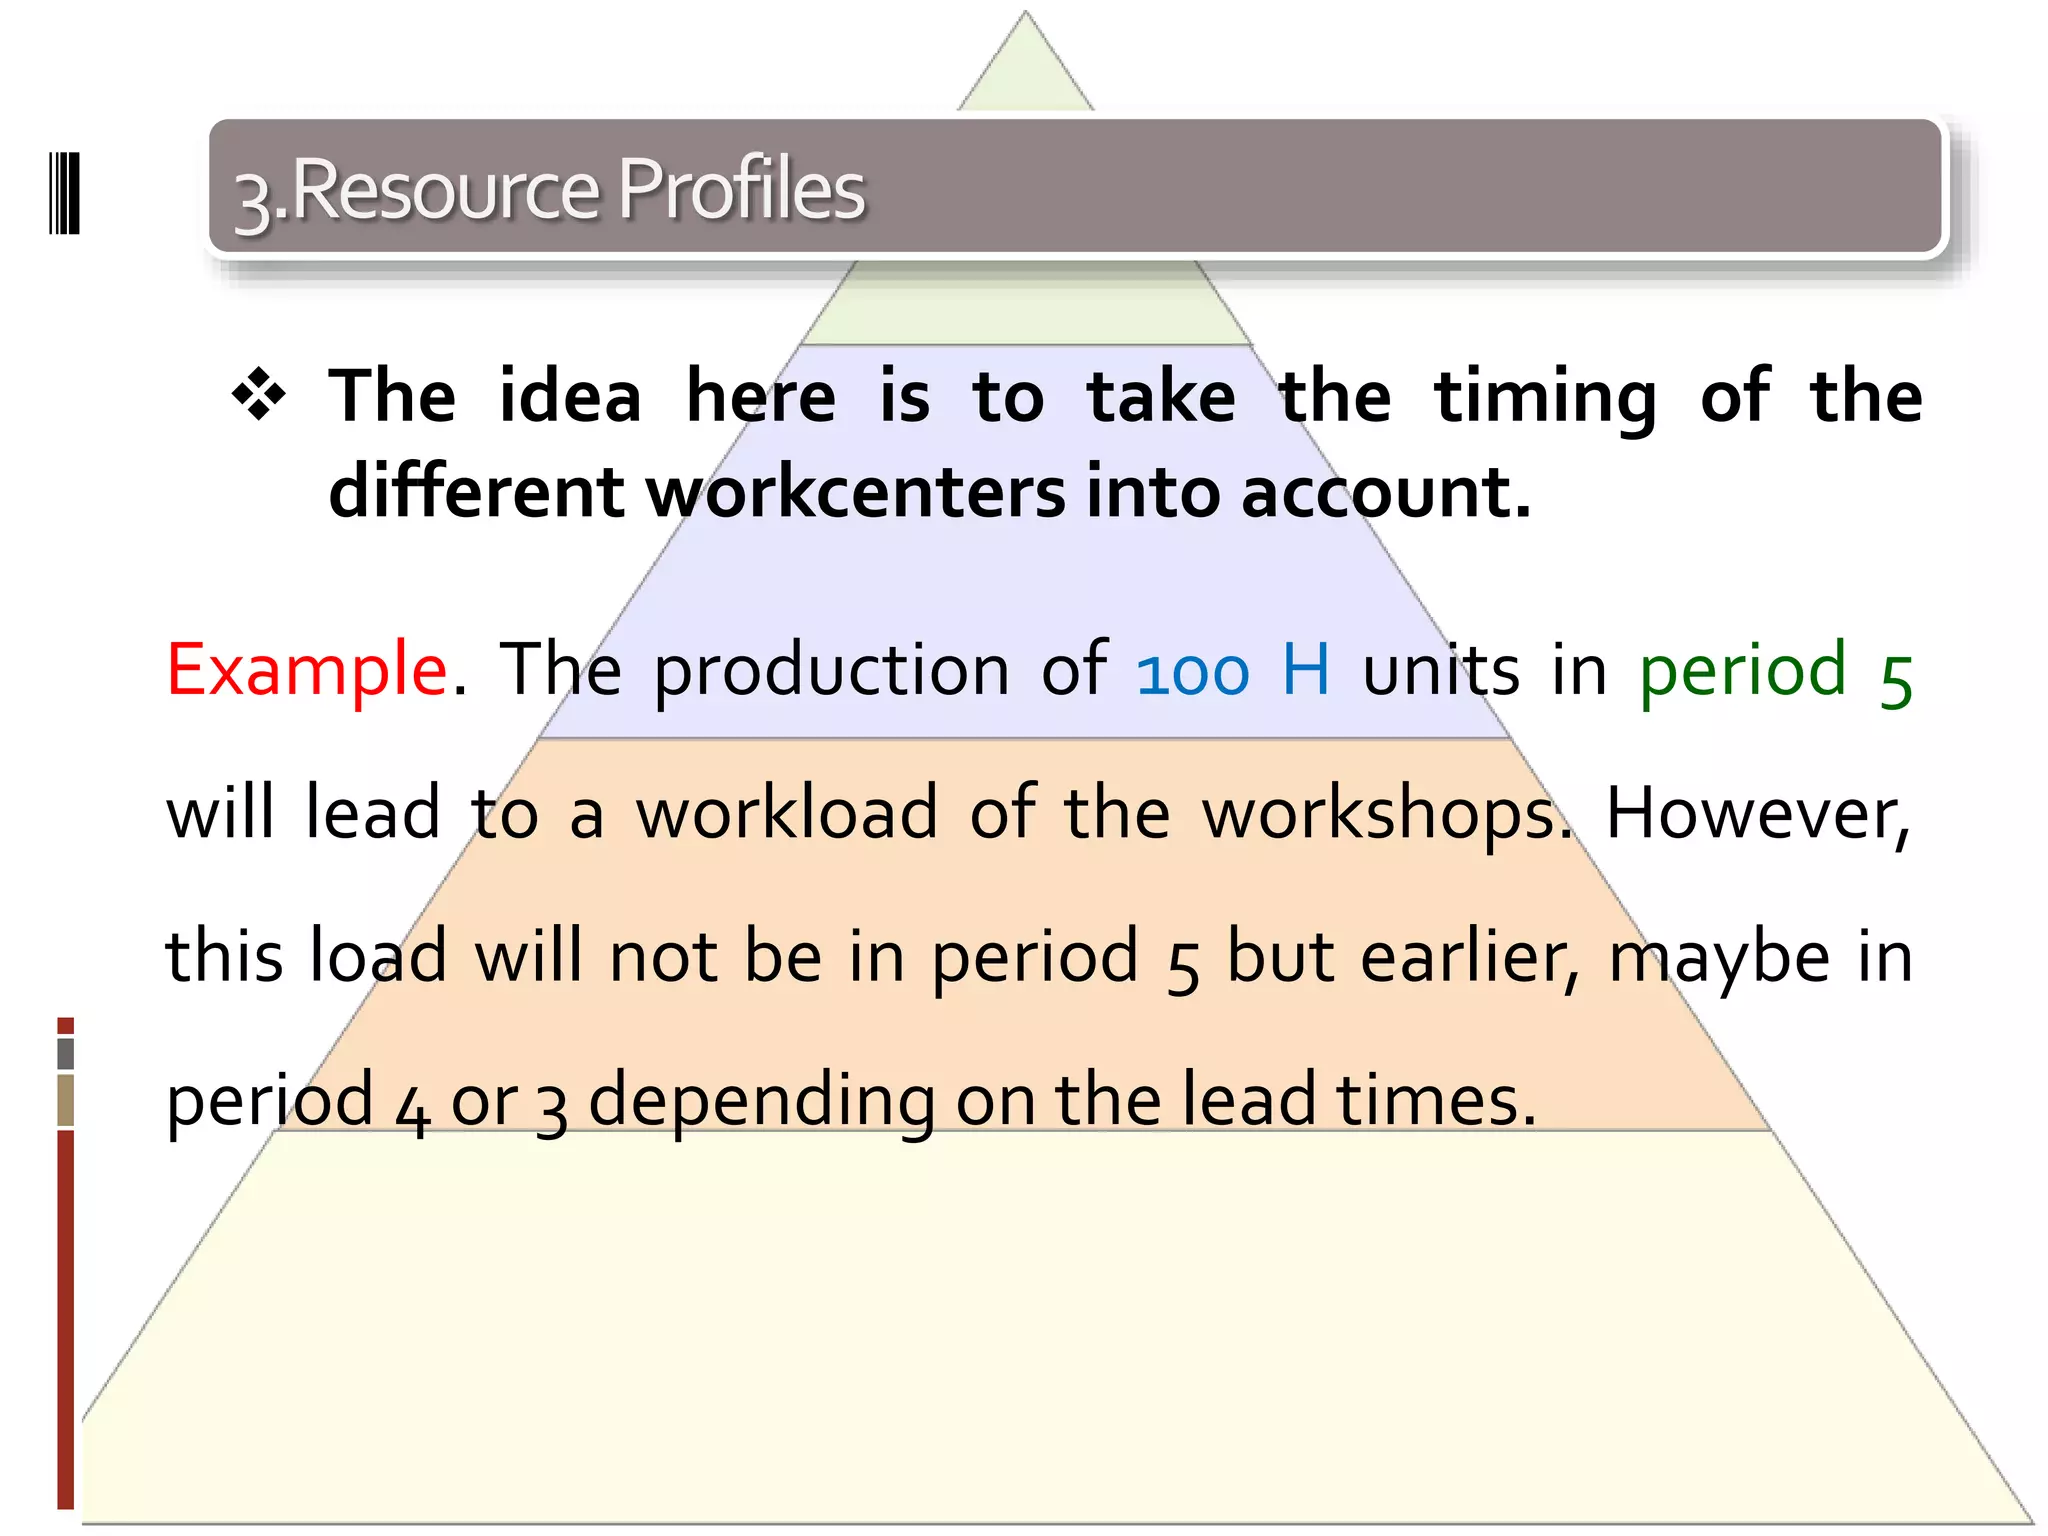
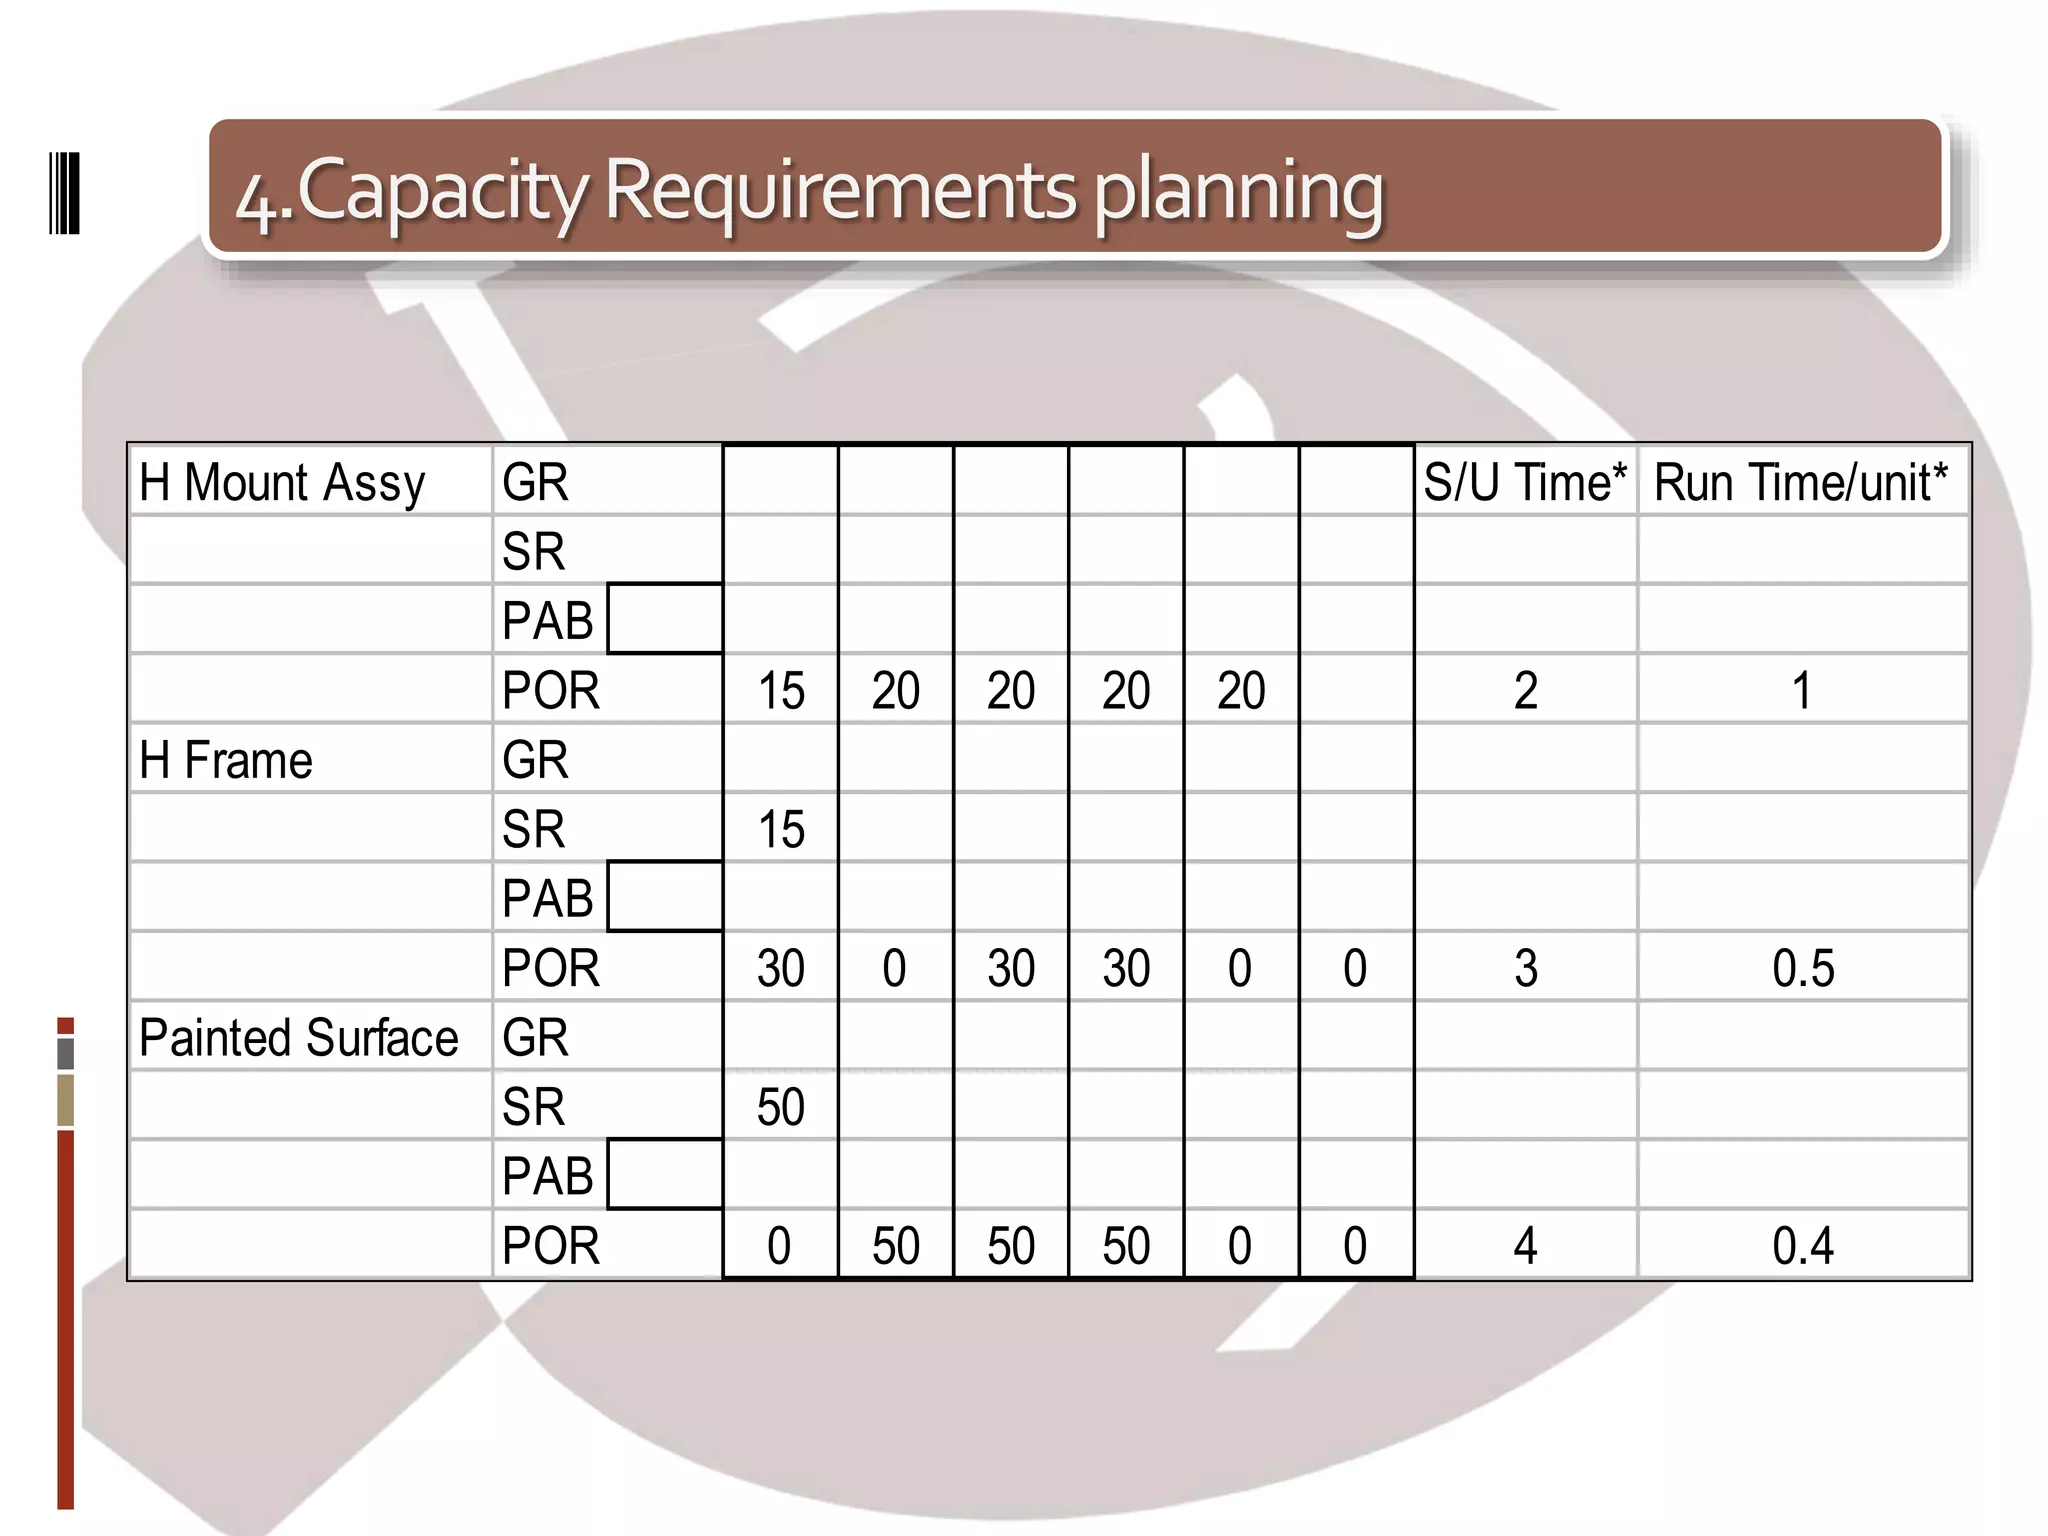
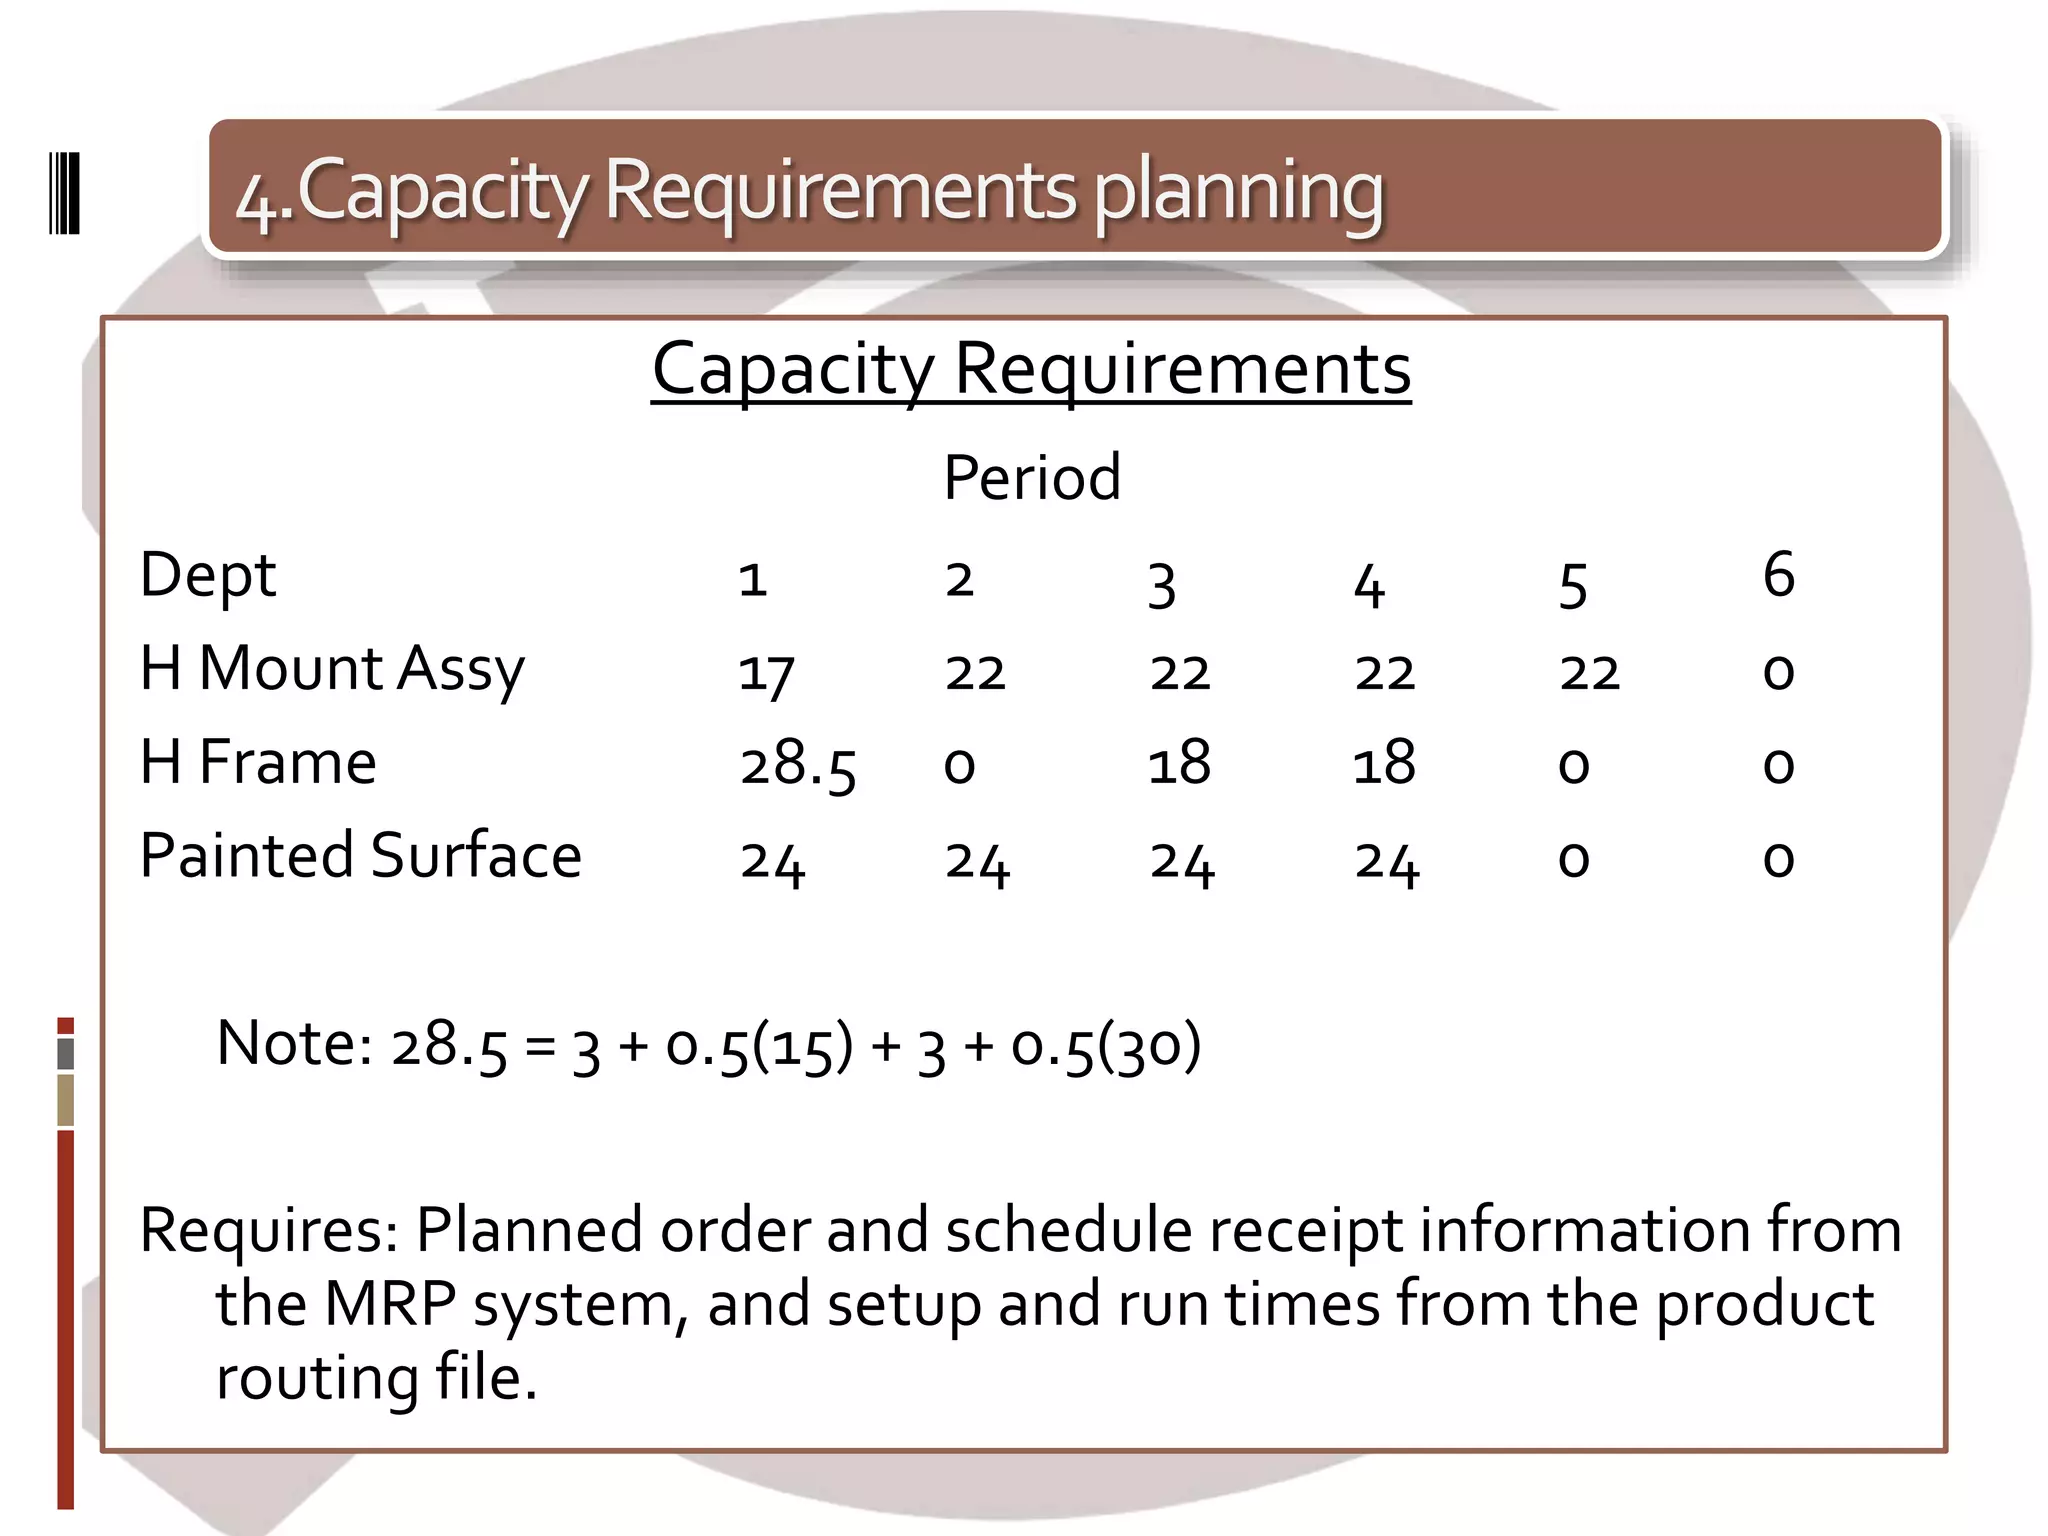
The document outlines various capacity planning techniques within manufacturing production control (MPC) systems, emphasizing the importance of effective management of resources to optimize production capabilities. It discusses methods such as capacity planning using overall factors (CPof), capacity bills, resource profiles, and capacity requirements planning (CRP), providing examples and case studies. Additionally, it highlights the hierarchy of decisions involved in capacity planning and the links between different MPC system modules.


![Láminas desarrollo theoretical framework[1]](https://cdn.slidesharecdn.com/ss_thumbnails/lminasdesarrollotheoreticalframework1-120927200811-phpapp02-thumbnail.jpg?width=640&height=640&fit=bounds)


