Downloaded 806 times


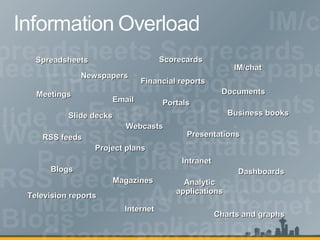
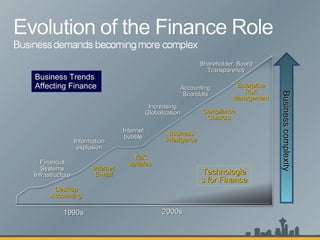
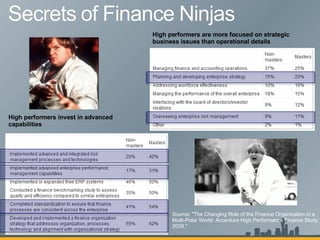
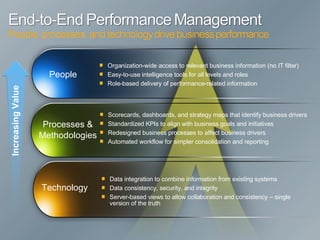
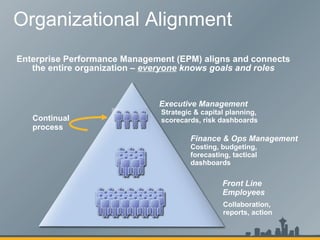
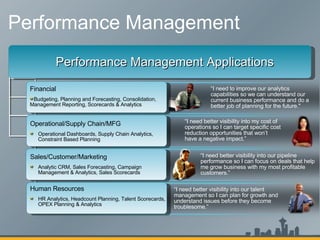
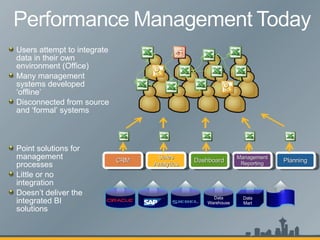
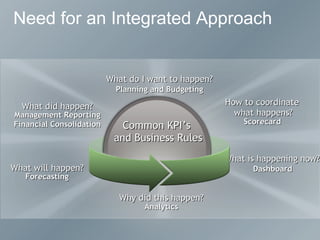
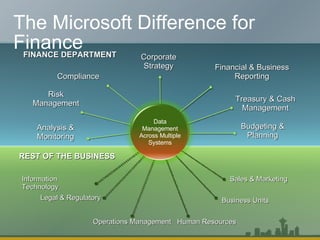

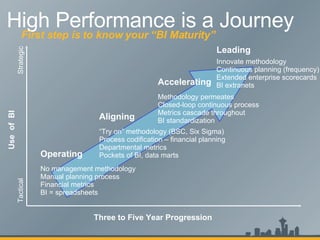
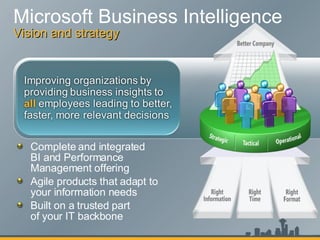


The document discusses the evolving role of finance organizations towards strategic management and decision-making, emphasizing the importance of integrated performance management systems that enhance visibility into business performance. It highlights the need for advanced capabilities, data integration, and actionable insights for various organizational levels to drive alignment and efficiency. Additionally, the document underscores the significance of continuous planning and the use of metrics to improve overall business performance.


![SMOKE - The Convenient Truth [1st place Worlds Best Presentation Contest] by ...](https://cdn.slidesharecdn.com/ss_thumbnails/smoke-theconvenienttruth-ep-101028211434-phpapp01-thumbnail.jpg?width=640&height=640&fit=bounds)