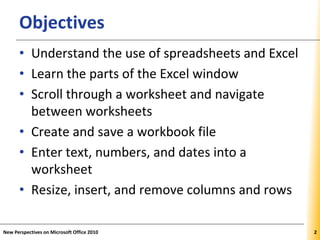
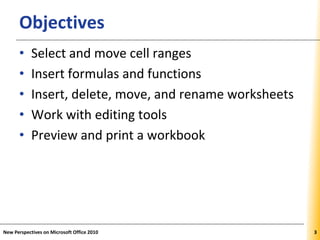
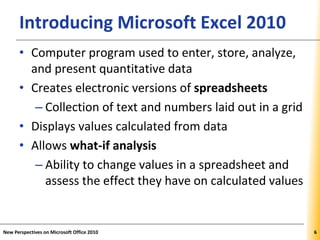
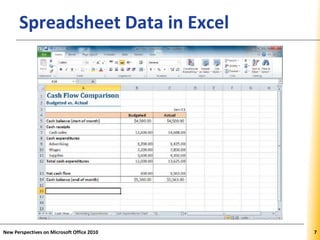
This document provides an overview and tutorial on getting started with Microsoft Excel 2010. It covers the basics of Excel including understanding worksheets and workbooks, entering and formatting data, using formulas and functions, navigating and formatting worksheets, and printing workbooks. The objectives are to learn the Excel interface, enter and format text, numbers and dates, use formulas and functions, navigate between and format worksheets, and preview and print workbooks.
Pie charts are very useful for comparing values to each other in a data series. Pie charts have five elements that are common to most charts. You can select and format any chart element individually or you can apply a built-in style or chart layout to format all of these elements at once.
$5 COUPON LINK - Excel Udemy Course: Excel with Excel Dynamic Graphs, Dashboa...mellontraining
Learn everything about Charts with Excel 2013
Create Interactive Advanced Excel Charts, Pivot Charts and Dashboards - with Microsoft Excel 2013 + Free Excel Templates
******************************************************************************************************
GET THE COURSE FOR $5 WITH THE COUPON LINK:
https://www.udemy.com/excel-charts-learn-everything-about-charts-with-excel-2013/?couponCode=STUDENT5
Data in Excel is in the form of rows and columns. Excel is commonly used to record and analyze data, perform mathematical operations, and visualize structured data in charts and graphs. Finally, another important application of Excel is that it helps in automating tasks through excel macros.
To perform the tasks mentioned above quickly, Excel has a set of shortcuts. Various operations can be achieved with a few simple keyboard strokes. Let’s dive deep into the Excel shortcuts that can help us work better on an Excel spreadsheet.
Need for Excel Shortcuts
Excel supports a plethora of keyboard shortcuts that help you work efficiently and increase productivity. Instead of accessing the toolbar with a mouse, two or three keystrokes are used to perform significant functions. Isn’t that easier and time-saving? Using Excel shortcuts drastically increases the speed, and thus reduces work-time.
Now the question is, if you have to memorize these shortcuts, the answer is no. However, it would be an advantage if you can remember a few of them. With regular practice, you will be able to remember most of the common Excel shortcuts.
Let’s now look at the Excel shortcuts cheat sheet, which you should know when working on Microsoft Excel. In this article, we have categorized 50 Excel shortcuts based on their operations. First, we will look at the workbook shortcut keys.
50 Excel Shortcuts That You Should Know in 2023
By Shruti M
Last updated on May 29, 20231788344
50 Excel Shortcuts Key That You Should Know in 2023
Table of Contents
What is Microsoft Excel? Need for Excel ShortcutsWorkbook Shortcut KeysCell Formatting Shortcut KeysRow and Column Formatting Shortcut KeysView More
Microsoft Excel is extensively used across the globe to store and analyze data. Despite various new data analytics tools in the market, Excel remains the go-to product for working with data. It has numerous in-built features, which makes it easier for you to organize your data.
The shortcut keys in Excel help you work on your data in a jiffy. In this article, we’ll be discussing the various Excel shortcuts. These keyboard shortcuts are used to perform tasks faster and effectively.
Have a look at the video below that explains worksheet related shortcuts, row and column shortcuts, and pivot table shortcut keys.
What is Microsoft Excel?
Although many of you are already aware of Excel, let’s have a small introduction anyways. Microsoft Excel is an application developed by Microsoft that is used to record, analyze, and visualize data. Excel, a spreadsheet application, was developed by Microsoft in 1985.
excel
Fig: Microsoft Excel Spreadsheet
Data in Excel is in the form of rows and columns. Excel is commonly used to record and analyze data, perform mathematical operations, and visualize structured data in charts and graphs. Finally, another important application of Excel is that it helps in automating tasks through excel macros.
To perform the tasks mentioned above quickly, Exce
Neuro-symbolic is not enough, we need neuro-*semantic*Frank van Harmelen
Neuro-symbolic (NeSy) AI is on the rise. However, simply machine learning on just any symbolic structure is not sufficient to really harvest the gains of NeSy. These will only be gained when the symbolic structures have an actual semantics. I give an operational definition of semantics as “predictable inference”.
All of this illustrated with link prediction over knowledge graphs, but the argument is general.
Generating a custom Ruby SDK for your web service or Rails API using Smithyg2nightmarescribd
Have you ever wanted a Ruby client API to communicate with your web service? Smithy is a protocol-agnostic language for defining services and SDKs. Smithy Ruby is an implementation of Smithy that generates a Ruby SDK using a Smithy model. In this talk, we will explore Smithy and Smithy Ruby to learn how to generate custom feature-rich SDKs that can communicate with any web service, such as a Rails JSON API.
LF Energy Webinar: Electrical Grid Modelling and Simulation Through PowSyBl -...DanBrown980551
Do you want to learn how to model and simulate an electrical network from scratch in under an hour?
Then welcome to this PowSyBl workshop, hosted by Rte, the French Transmission System Operator (TSO)!
During the webinar, you will discover the PowSyBl ecosystem as well as handle and study an electrical network through an interactive Python notebook.
PowSyBl is an open source project hosted by LF Energy, which offers a comprehensive set of features for electrical grid modelling and simulation. Among other advanced features, PowSyBl provides:
- A fully editable and extendable library for grid component modelling;
- Visualization tools to display your network;
- Grid simulation tools, such as power flows, security analyses (with or without remedial actions) and sensitivity analyses;
The framework is mostly written in Java, with a Python binding so that Python developers can access PowSyBl functionalities as well.
What you will learn during the webinar:
- For beginners: discover PowSyBl's functionalities through a quick general presentation and the notebook, without needing any expert coding skills;
- For advanced developers: master the skills to efficiently apply PowSyBl functionalities to your real-world scenarios.
Smart TV Buyer Insights Survey 2024 by 91mobiles.pdf91mobiles
91mobiles recently conducted a Smart TV Buyer Insights Survey in which we asked over 3,000 respondents about the TV they own, aspects they look at on a new TV, and their TV buying preferences.
Essentials of Automations: Optimizing FME Workflows with ParametersSafe Software
Are you looking to streamline your workflows and boost your projects’ efficiency? Do you find yourself searching for ways to add flexibility and control over your FME workflows? If so, you’re in the right place.
Join us for an insightful dive into the world of FME parameters, a critical element in optimizing workflow efficiency. This webinar marks the beginning of our three-part “Essentials of Automation” series. This first webinar is designed to equip you with the knowledge and skills to utilize parameters effectively: enhancing the flexibility, maintainability, and user control of your FME projects.
Here’s what you’ll gain:
- Essentials of FME Parameters: Understand the pivotal role of parameters, including Reader/Writer, Transformer, User, and FME Flow categories. Discover how they are the key to unlocking automation and optimization within your workflows.
- Practical Applications in FME Form: Delve into key user parameter types including choice, connections, and file URLs. Allow users to control how a workflow runs, making your workflows more reusable. Learn to import values and deliver the best user experience for your workflows while enhancing accuracy.
- Optimization Strategies in FME Flow: Explore the creation and strategic deployment of parameters in FME Flow, including the use of deployment and geometry parameters, to maximize workflow efficiency.
- Pro Tips for Success: Gain insights on parameterizing connections and leveraging new features like Conditional Visibility for clarity and simplicity.
We’ll wrap up with a glimpse into future webinars, followed by a Q&A session to address your specific questions surrounding this topic.
Don’t miss this opportunity to elevate your FME expertise and drive your projects to new heights of efficiency.
The Art of the Pitch: WordPress Relationships and SalesLaura Byrne
Clients don’t know what they don’t know. What web solutions are right for them? How does WordPress come into the picture? How do you make sure you understand scope and timeline? What do you do if sometime changes?
All these questions and more will be explored as we talk about matching clients’ needs with what your agency offers without pulling teeth or pulling your hair out. Practical tips, and strategies for successful relationship building that leads to closing the deal.
Software Delivery At the Speed of AI: Inflectra Invests In AI-Powered QualityInflectra
In this insightful webinar, Inflectra explores how artificial intelligence (AI) is transforming software development and testing. Discover how AI-powered tools are revolutionizing every stage of the software development lifecycle (SDLC), from design and prototyping to testing, deployment, and monitoring.
Learn about:
• The Future of Testing: How AI is shifting testing towards verification, analysis, and higher-level skills, while reducing repetitive tasks.
• Test Automation: How AI-powered test case generation, optimization, and self-healing tests are making testing more efficient and effective.
• Visual Testing: Explore the emerging capabilities of AI in visual testing and how it's set to revolutionize UI verification.
• Inflectra's AI Solutions: See demonstrations of Inflectra's cutting-edge AI tools like the ChatGPT plugin and Azure Open AI platform, designed to streamline your testing process.
Whether you're a developer, tester, or QA professional, this webinar will give you valuable insights into how AI is shaping the future of software delivery.
Epistemic Interaction - tuning interfaces to provide information for AI supportAlan Dix
Paper presented at SYNERGY workshop at AVI 2024, Genoa, Italy. 3rd June 2024
https://alandix.com/academic/papers/synergy2024-epistemic/
As machine learning integrates deeper into human-computer interactions, the concept of epistemic interaction emerges, aiming to refine these interactions to enhance system adaptability. This approach encourages minor, intentional adjustments in user behaviour to enrich the data available for system learning. This paper introduces epistemic interaction within the context of human-system communication, illustrating how deliberate interaction design can improve system understanding and adaptation. Through concrete examples, we demonstrate the potential of epistemic interaction to significantly advance human-computer interaction by leveraging intuitive human communication strategies to inform system design and functionality, offering a novel pathway for enriching user-system engagements.
2. XPXPXPObjectives
• Understand the use of spreadsheets and Excel
• Learn the parts of the Excel window
• Scroll through a worksheet and navigate
between worksheets
• Create and save a workbook file
• Enter text, numbers, and dates into a
worksheet
• Resize, insert, and remove columns and rows
New Perspectives on Microsoft Office 2010 22
3. XPXPXPObjectives
• Select and move cell ranges
• Insert formulas and functions
• Insert, delete, move, and rename worksheets
• Work with editing tools
• Preview and print a workbook
New Perspectives on Microsoft Office 2010 33
6. XPXPXPIntroducing Microsoft Excel 2010
• Computer program used to enter, store, analyze,
and present quantitative data
• Creates electronic versions of spreadsheets
– Collection of text and numbers laid out in a grid
• Displays values calculated from data
• Allows what-if analysis
– Ability to change values in a spreadsheet and
assess the effect they have on calculated values
New Perspectives on Microsoft Office 2010 6
8. XPXPXPWorksheet Navigation
• A workbook can have two kinds of sheets:
–Worksheet contains a grid of rows and
columns into which user enters data
–Chart sheet provides visual representation
of data
• Cell reference identifies column/row location
New Perspectives on Microsoft Office 2010 8
9. XPXPXPWorksheet Navigation
• To navigate between worksheets
–Use sheet tabs
• To navigate within a worksheet
–Use mouse, keyboard, GoTo dialog box, or
type cell reference in Name box
New Perspectives on Microsoft Office 2010 9
11. XPXPXPPlanning a Workbook
• Use a planning analysis sheet to define:
–Goal or purpose of workbook
–Type of data to collect
–Formulas needed to apply to data you
collected and entered
–Appearance of workbook content
New Perspectives on Microsoft Office 2010 11
12. XPXPXPEntering Text, Numbers, and Dates
• Text data
– Combination of letters, numbers, and symbols
– Often referred to as a text string
• Number data
– Numerical value to be used in a mathematical
calculation
• Date and time data
– Commonly recognized formats for date and time
values
New Perspectives on Microsoft Office 2010 12
13. XPXPXPEntering Text
• New data appears in both the active cell and
the formula bar
• Truncation
• AutoComplete feature
• To enter multiple lines of text within a cell
–Create a line break with Alt + Enter
New Perspectives on Microsoft Office 2010 13
16. XPXPXPWorking with Columns and Rows
• To make data easier to read:
–Modify size of columns and rows in a
worksheet
• To modify size of columns or rows:
–Drag border to resize
–Double-click border to autofit
–Format the Cells group to specify
New Perspectives on Microsoft Office 2010 16
17. XPXPXPWorking with Columns and Rows
• Column width
–Expressed in terms of number of characters
or pixels (8.43 characters equals 64 pixels)
–Note: Pixel size is based on screen
resolution
• Row height
–Measured in points (1/72 of an inch) or
pixels
–Default row height: 15 points or 20 pixels
New Perspectives on Microsoft Office 2010 17
19. XPXPXPWorking with Columns and Rows
• Inserting a column or row
–Existing columns or rows shift to
accommodate
New Perspectives on Microsoft Office 2010 19
20. XPXPXPWorking with Columns and Rows
• Deleting and clearing a row or column
–Deleting removes both the data and the
cells
–Clearing removes the data, leaving blank
cells where data had been
New Perspectives on Microsoft Office 2010 20
23. XPXPXPWorking with Cells and Ranges
• Range reference indicates location and size of
a cell range
–Adjacent (A1:G5)
–Nonadjacent (A1:A5;F1:G5)
• Selecting a range
–Work with all cells in the range as a group
• Moving and copying a range
–Drag and drop
–Cut and paste
New Perspectives on Microsoft Office 2010 23
24. XPXPXPWorking with Cells and Ranges
• Inserting and deleting a range
–Existing cells shift to accommodate the
change
New Perspectives on Microsoft Office 2010 24
25. XPXPXPWorking with Formulas
• Formula
– An expression that returns a value
– Written using operators that combine different
values, resulting in a single displayed value
New Perspectives on Microsoft Office 2010 25
26. XPXPXPWorking with Formulas
• Entering a formula
–Click cell where you want formula results to
appear
–Type = and an expression that calculates a
value using cell references and arithmetic
operators
• Cell references allow you to change
values used in the calculation without
having to modify the formula itself
–Press Enter or Tab to complete the formula
New Perspectives on Microsoft Office 2010 26
27. XPXPXPWorking with Formulas
• Order of precedence
–Set of predefined rules used to determine
sequence in which operators are applied in
a calculation
New Perspectives on Microsoft Office 2010 27
28. XPXPXPWorking with Formulas
• Viewing a formula
– Select cell and review expression displayed in the
formula bar
– Each cell reference is color coded in the formula
and corresponding cell in the worksheet
New Perspectives on Microsoft Office 2010 28
29. XPXPXPWorking with Formulas
• Copying and pasting formulas
–Cell references adjust to reflect new
location of the formula in the worksheet
New Perspectives on Microsoft Office 2010 29
30. XPXPXPWorking with Formulas
• Guidelines for writing effective formulas:
–Keep them simple
–Do not hide data values within formulas
–Break up formulas to show intermediate
results
New Perspectives on Microsoft Office 2010 30
31. XPXPXPIntroducing Functions
• Function
– Named operation that returns a value
– Simplifies a formula, reducing a long formula into
a compact statement; for example, to add values
in the range A1:A10:
• Enter the long formula:
=A1+A2+A3+A4+A5+A6+A7+A8+A9+A10
- or -
• Use the SUM function to accomplish the same
thing:
=SUM(A1:A10)
New Perspectives on Microsoft Office 2010 31
33. XPXPXPEntering Functions with AutoSum
• Fast, convenient way to enter commonly used
functions
• Includes buttons to quickly insert/generate:
– Sum of values in column or row (SUM)
– Average value in column or row (AVERAGE)
– Total count of numeric values in column or row
(COUNT)
– Minimum value in column or row (MIN)
– Maximum value in column or row (MAX)
New Perspectives on Microsoft Office 2010 33
35. XPXPXPWorking with Worksheets
• Inserting a worksheet
–Name of new worksheet is based on
number and names of other sheets in the
workbook
• Deleting a worksheet
• Renaming a worksheet
–31 characters maximum, including blank
spaces
–Width of sheet tab adjusts to length of
name
New Perspectives on Microsoft Office 2010 35
36. XPXPXPWorking with Worksheets
• Moving and copying a worksheet
–To move:
• Click and drag
–To copy:
• Ctrl + drag and drop
–Place most important worksheets at
beginning of workbook (leftmost sheet
tabs), less important worksheets toward
end (rightmost tabs)
New Perspectives on Microsoft Office 2010 36
37. XPXPXPEditing Worksheet Content
• Use Edit mode to edit cell contents
– Keyboard shortcuts apply only to text within
selected cell
• Undoing and redoing an action
– Excel maintains a list of actions performed in a
workbook during current session
New Perspectives on Microsoft Office 2010 37
43. XPXPXPPreviewing a Workbook
• Working with page orientation
–Portrait orientation (default)
• Page is taller than wide
–Landscape orientation
• Page is wider than tall
New Perspectives on Microsoft Office 2010 43
44. XPXPXPPrinting a Workbook
• Print tab provides options for choosing what
to print and how to print
–Printout includes only the data in the
worksheet
–Other elements (e.g., row/column
headings, gridlines) will not print by default
• Good practice: Review print preview before
printing to ensure that printout looks exactly
as you intended and avoid unnecessary
reprinting
New Perspectives on Microsoft Office 2010 44
46. XPXPXP
Viewing and Printing Worksheet
Formulas
• Switch to formula view
– Useful when you encounter unexpected results
and want to examine underlying formulas or to
discuss your formulas with a colleague
New Perspectives on Microsoft Office 2010 46
47. XPXPXP
Viewing and Printing Worksheet
Formulas
• Scaling the printout of a worksheet forces
contents to fit on a single page
New Perspectives on Microsoft Office 2010 47