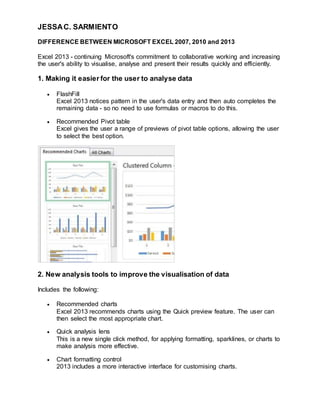
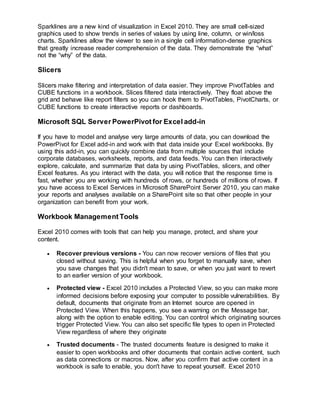
The document compares and summarizes the key differences between Microsoft Excel 2007, 2010, and 2013. Excel 2013 focuses on collaboration, data analysis and visualization. It introduces features like FlashFill for auto-completing data entry and recommended pivot tables and charts. Excel 2010 introduces the ribbon interface, backstage view, sparklines, slicers and the PowerPivot add-in for large data analysis. It also includes version recovery, protected view and trusted documents features. Both 2010 and 2013 allow accessing Excel files online through the Excel Web App.
The Excel power user training courses by G Com Solutions are designed to transform any competent Excel user into a power user. Delegates are shown how to leverage the most powerful tools in Excel; tools which are no more difficult to learn than Excel’s mainstream features.
Are you seeking a excel assignment help expert for solving your statistics assignments? Then you are the right place. Tutorhelpdesk.com provide excel assignment help at affordable price. Log on our website to know more details.
BSUPERIOR SYSTEM provides customized data management solutions for businesses to manage and execute efficient and effective process and task management systems.
Contact us for consultation today info@bsup.ca or +1(778)891-2769
BSUPERIOR SYSTEM provides customized data management solutions for businesses to manage and execute efficient and effective process and task management systems.
Contact us for consultation today info@bsup.ca or +1(778)891-2769
Find out what new changes have been made across all the applications in the Office 2016 suite, just released today! Understand not only the changes, but why they matter. For the in-depth course, visit: http://www.lynda.com/whats-new-office-2016
Lunch & Learn : Comment gagner 30 minutes par jour avec Excel?Aurelium
Excel 2013 est plus qu'un simple tableur. Il est évident que le programme vous fera gagner du temps quand vous faites de complexes calculs. A part ça, la nouvelle version d'Excel vous permettra encore plus que la version précédente, de visualiser et partager vos résultats dans un minimum de temps, sous forme de tableaux de bord, de rapports, de graphiques ou de tableaux tournants.
Utilisateur expérimenté ou novice, cette formation vous donnera de l'inspiration pour mieux utiliser Excel 2013 et gagner facilement 30 minutes par jour!
We are the world’s largest and most established provider of training courses globally, with extensive experience of providing quality-infused learning solutions - with the capability to deliver over 30,000 courses, in 1000+ locations, across 190 countries. As market leaders, we have successfully trained over 1 million delegates - demonstrating our internationally-renowned trust and unrivalled premium quality, to all of our aspiring learners.
Excel vs Tableau the comparison you should knowStat Analytica
Is it still overwhelming for you to differentiate between excel vs Tableau? Here is the best ever presentation on the comparison between excel vs Tableau. Here we have discussed all the keypoints of comparison between these two statistics tools.
We are the world’s largest and most established provider of training courses globally, with extensive experience of providing quality-infused learning solutions - with the capability to deliver over 30,000 courses, in 1000+ locations, across 190 countries. As market leaders, we have successfully trained over 1 million delegates - demonstrating our internationally-renowned trust and unrivalled premium quality, to all of our aspiring learners.
Power BI - Business Intelligence Getting Started Guide - PREVIEWDavid J Rosenthal
The growth of data increases each day, as does the need for self-service business intelligence that can turn data into decision-ready insights. But too often, the tools necessary to extract those insights are just as hard to handle as the data. Microsoft Power BI for Office 365 is a collection of new features and services that, together, enable you to visualize data, share discoveries, and collaborate in intuitive new ways. Familiar tools including Excel and SharePoint form the foundation of Power BI, with deeper integration and powerful new capabilities. Power BI builds on your existing knowledge of Excel, amplifying your understanding and ability to capitalize on the ever-expanding world of valuable, yet sometimes unwieldy, data.
Automatic Salary Pay Slip in 4 MinutesJamesAndrais
We are the world’s largest and most established provider of training courses globally, with extensive experience of providing quality-infused learning solutions - with the capability to deliver over 30,000 courses, in 1000+ locations, across 190 countries. As market leaders, we have successfully trained over 1 million delegates - demonstrating our internationally-renowned trust and unrivalled premium quality, to all of our aspiring learners.
PHP Frameworks: I want to break free (IPC Berlin 2024)Ralf Eggert
In this presentation, we examine the challenges and limitations of relying too heavily on PHP frameworks in web development. We discuss the history of PHP and its frameworks to understand how this dependence has evolved. The focus will be on providing concrete tips and strategies to reduce reliance on these frameworks, based on real-world examples and practical considerations. The goal is to equip developers with the skills and knowledge to create more flexible and future-proof web applications. We'll explore the importance of maintaining autonomy in a rapidly changing tech landscape and how to make informed decisions in PHP development.
This talk is aimed at encouraging a more independent approach to using PHP frameworks, moving towards a more flexible and future-proof approach to PHP development.
Observability Concepts EVERY Developer Should Know -- DeveloperWeek Europe.pdfPaige Cruz
Monitoring and observability aren’t traditionally found in software curriculums and many of us cobble this knowledge together from whatever vendor or ecosystem we were first introduced to and whatever is a part of your current company’s observability stack.
While the dev and ops silo continues to crumble….many organizations still relegate monitoring & observability as the purview of ops, infra and SRE teams. This is a mistake - achieving a highly observable system requires collaboration up and down the stack.
I, a former op, would like to extend an invitation to all application developers to join the observability party will share these foundational concepts to build on:
Dev Dives: Train smarter, not harder – active learning and UiPath LLMs for do...UiPathCommunity
💥 Speed, accuracy, and scaling – discover the superpowers of GenAI in action with UiPath Document Understanding and Communications Mining™:
See how to accelerate model training and optimize model performance with active learning
Learn about the latest enhancements to out-of-the-box document processing – with little to no training required
Get an exclusive demo of the new family of UiPath LLMs – GenAI models specialized for processing different types of documents and messages
This is a hands-on session specifically designed for automation developers and AI enthusiasts seeking to enhance their knowledge in leveraging the latest intelligent document processing capabilities offered by UiPath.
Speakers:
👨🏫 Andras Palfi, Senior Product Manager, UiPath
👩🏫 Lenka Dulovicova, Product Program Manager, UiPath
Epistemic Interaction - tuning interfaces to provide information for AI supportAlan Dix
Paper presented at SYNERGY workshop at AVI 2024, Genoa, Italy. 3rd June 2024
https://alandix.com/academic/papers/synergy2024-epistemic/
As machine learning integrates deeper into human-computer interactions, the concept of epistemic interaction emerges, aiming to refine these interactions to enhance system adaptability. This approach encourages minor, intentional adjustments in user behaviour to enrich the data available for system learning. This paper introduces epistemic interaction within the context of human-system communication, illustrating how deliberate interaction design can improve system understanding and adaptation. Through concrete examples, we demonstrate the potential of epistemic interaction to significantly advance human-computer interaction by leveraging intuitive human communication strategies to inform system design and functionality, offering a novel pathway for enriching user-system engagements.
State of ICS and IoT Cyber Threat Landscape Report 2024 previewPrayukth K V
The IoT and OT threat landscape report has been prepared by the Threat Research Team at Sectrio using data from Sectrio, cyber threat intelligence farming facilities spread across over 85 cities around the world. In addition, Sectrio also runs AI-based advanced threat and payload engagement facilities that serve as sinks to attract and engage sophisticated threat actors, and newer malware including new variants and latent threats that are at an earlier stage of development.
The latest edition of the OT/ICS and IoT security Threat Landscape Report 2024 also covers:
State of global ICS asset and network exposure
Sectoral targets and attacks as well as the cost of ransom
Global APT activity, AI usage, actor and tactic profiles, and implications
Rise in volumes of AI-powered cyberattacks
Major cyber events in 2024
Malware and malicious payload trends
Cyberattack types and targets
Vulnerability exploit attempts on CVEs
Attacks on counties – USA
Expansion of bot farms – how, where, and why
In-depth analysis of the cyber threat landscape across North America, South America, Europe, APAC, and the Middle East
Why are attacks on smart factories rising?
Cyber risk predictions
Axis of attacks – Europe
Systemic attacks in the Middle East
Download the full report from here:
https://sectrio.com/resources/ot-threat-landscape-reports/sectrio-releases-ot-ics-and-iot-security-threat-landscape-report-2024/
Builder.ai Founder Sachin Dev Duggal's Strategic Approach to Create an Innova...Ramesh Iyer
In today's fast-changing business world, Companies that adapt and embrace new ideas often need help to keep up with the competition. However, fostering a culture of innovation takes much work. It takes vision, leadership and willingness to take risks in the right proportion. Sachin Dev Duggal, co-founder of Builder.ai, has perfected the art of this balance, creating a company culture where creativity and growth are nurtured at each stage.
Generative AI Deep Dive: Advancing from Proof of Concept to ProductionAggregage
Join Maher Hanafi, VP of Engineering at Betterworks, in this new session where he'll share a practical framework to transform Gen AI prototypes into impactful products! He'll delve into the complexities of data collection and management, model selection and optimization, and ensuring security, scalability, and responsible use.
Transcript: Selling digital books in 2024: Insights from industry leaders - T...BookNet Canada
The publishing industry has been selling digital audiobooks and ebooks for over a decade and has found its groove. What’s changed? What has stayed the same? Where do we go from here? Join a group of leading sales peers from across the industry for a conversation about the lessons learned since the popularization of digital books, best practices, digital book supply chain management, and more.
Link to video recording: https://bnctechforum.ca/sessions/selling-digital-books-in-2024-insights-from-industry-leaders/
Presented by BookNet Canada on May 28, 2024, with support from the Department of Canadian Heritage.
Transcript: Selling digital books in 2024: Insights from industry leaders - T...
Difference between microsoft excel 2007
1. JESSAC. SARMIENTO
DIFFERENCE BETWEEN MICROSOFT EXCEL 2007, 2010 and 2013
Excel 2013 - continuing Microsoft's commitment to collaborative working and increasing
the user's ability to visualise, analyse and present their results quickly and efficiently.
1. Making it easier for the user to analyse data
FlashFill
Excel 2013 notices pattern in the user's data entry and then auto completes the
remaining data - so no need to use formulas or macros to do this.
Recommended Pivot table
Excel gives the user a range of previews of pivot table options, allowing the user
to select the best option.
2. New analysis tools to improve the visualisation of data
Includes the following:
Recommended charts
Excel 2013 recommends charts using the Quick preview feature. The user can
then select the most appropriate chart.
Quick analysis lens
This is a new single click method, for applying formatting, sparklines, or charts to
make analysis more effective.
Chart formatting control
2013 includes a more interactive interface for customising charts.
2. 3. Making it easier to share work, present it online, add it to a social
networks
Simplified sharing
2013 includes a default setting so that workbooks are automatically saved online.
This ensures all users are working on the latest version, with the added
protection of control of the viewing and editing permissions.
Share part of a worksheet via embedding selected sections in social networks.
Present online - 2013 makes it easier to share workbooks with colleagues using
a Lync conversation or meeting.
What's the difference between Excel 2010 and Excel 2007?
At a glance, it doesn't look as though there's a great deal of difference between Excel
2007 and Excel 2010. A couple of additions to the Ribbon, the new Backstage view and
a handful of bonus features such as the Slicer and Sparklines. It could be said that an
"average" user could switch from 2007 to 2010 without batting an eyelid.
Anyone that handles large amounts of data, however, will appreciate the additions
made to Excel, many of which are designed to bring the power of data analysis to those
unwilling to dedicate hours trying to work out how to use what appear to be
impenetrable tools.
Access the Right Tools, at the Right Time
New and improved features can help you be more productive, but only if you can find
them when you need them. Like the other Microsoft Office 2010 programs, Excel 2010
includes the Microsoft Office Fluent interface, which consists of a customizable visual
system of tools and commands.
Improved Ribbon
First introduced in Excel 2007, the Ribbon makes it easy for you to find commands and
features that were previously buried in complex menus and toolbars. Although you
could customize the Quick Access Toolbar in Excel 2007, it wasn't possible to add your
own tabs or groups to the ribbon. In Excel 2010, however, you can create custom tabs
and groups and rename or change the order of the built-in tabs and groups.
Microsoft Office Backstage view
Click the File tab to open Backstage view, where you create new files, open existing
files, save, send, protect, preview, and print files, set options for Excel, and more.
Sparklines
3. Sparklines are a new kind of visualization in Excel 2010. They are small cell-sized
graphics used to show trends in series of values by using line, column, or win/loss
charts. Sparklines allow the viewer to see in a single cell information-dense graphics
that greatly increase reader comprehension of the data. They demonstrate the “what”
not the “why” of the data.
Slicers
Slicers make filtering and interpretation of data easier. They improve PivotTables and
CUBE functions in a workbook. Slices filtered data interactively. They float above the
grid and behave like report filters so you can hook them to PivotTables, PivotCharts, or
CUBE functions to create interactive reports or dashboards.
Microsoft SQL Server PowerPivot for Excel add-in
If you have to model and analyse very large amounts of data, you can download the
PowerPivot for Excel add-in and work with that data inside your Excel workbooks. By
using this add-in, you can quickly combine data from multiple sources that include
corporate databases, worksheets, reports, and data feeds. You can then interactively
explore, calculate, and summarize that data by using PivotTables, slicers, and other
Excel features. As you interact with the data, you will notice that the response time is
fast, whether you are working with hundreds of rows, or hundreds of millions of rows. If
you have access to Excel Services in Microsoft SharePoint Server 2010, you can make
your reports and analyses available on a SharePoint site so that other people in your
organization can benefit from your work.
Workbook Management Tools
Excel 2010 comes with tools that can help you manage, protect, and share your
content.
Recover previous versions - You can now recover versions of files that you
closed without saving. This is helpful when you forget to manually save, when
you save changes that you didn't mean to save, or when you just want to revert
to an earlier version of your workbook.
Protected view - Excel 2010 includes a Protected View, so you can make more
informed decisions before exposing your computer to possible vulnerabilities. By
default, documents that originate from an Internet source are opened in
Protected View. When this happens, you see a warning on the Message bar,
along with the option to enable editing. You can control which originating sources
trigger Protected View. You can also set specific file types to open in Protected
View regardless of where they originate
Trusted documents - The trusted documents feature is designed to make it
easier to open workbooks and other documents that contain active content, such
as data connections or macros. Now, after you confirm that active content in a
workbook is safe to enable, you don't have to repeat yourself. Excel 2010
4. remembers the workbooks you trust so that you can avoid being prompted each
time you open the workbook.
Access you Excel workbooks in new ways
You can now access and work with your files from anywhere you are - whether at work,
at home, or on the go.
Microsoft Excel Web App
Excel Web App extends your Excel experience to the web browser, where you can work
with workbooks directly on the site where the workbook is stored. Excel Web App is part
of Microsoft Office Web Apps, and is available in Windows Live SkyDrive and in
organizations that have configured Office Web Apps on SharePoint 2010.
With Excel Web App, you can:
View a workbook in the browser - When you click on a workbook to open it in
Excel Web App, the workbook is displayed in view mode. You can sort and filter
data in the workbook, expand PivotTables to see relationships and trends in the
data, recalculate values, and view different worksheets.
Edit a workbook in the browser - With Excel Web App, all you need to access
your workbooks is a browser. Your teammates can work with you, regardless of
which version of Excel they have. When you click on an Excel workbook that is
stored in a SharePoint site or in SkyDrive, the workbook opens directly in your
browser. Your workbooks look the same in the browser as they do in Excel. You
can edit your worksheets in the browser, using the familiar look and feel of Excel.
When you edit in the browser, you can change data, enter or edit formulas, and
apply basic formatting within the spreadsheet. You can also work with others on
the same workbook at the same time.