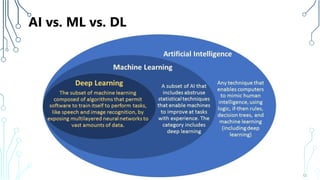
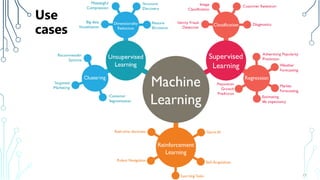
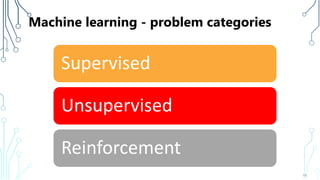
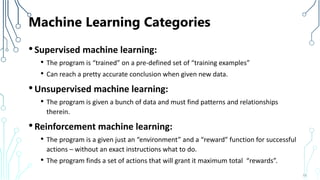
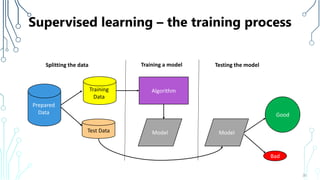
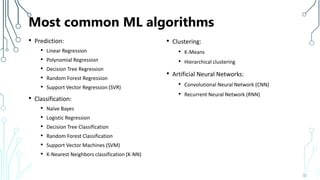
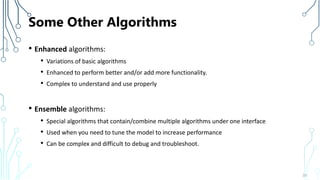
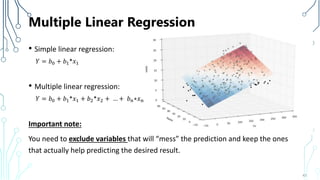
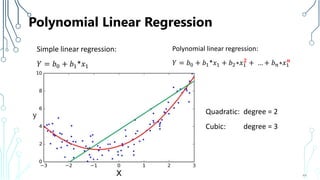
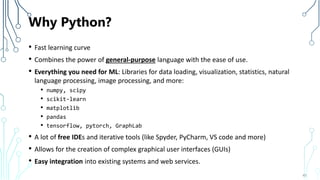
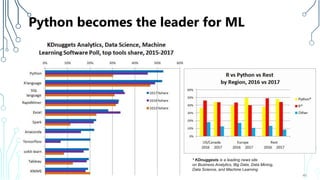
Machine Learning Essentials
Part 1: Basic algorithms
Lior King
Lior.King@gmail.com
1
Agenda
• Introduction to Machine Learning (ML)
• What is Machine Learning?
• The problems we can solved using ML.
• The learning process
• Basic ML Algorithms using Python and Scikit-learn library
• Linear Regression
• Naïve Bayes
• K-Means
• Artificial Neural Networks (ANN) and Deep Learning (DL)
using TensorFlow library
• Single layered ANN (using MNIST demo).
• Deep Learning (DL) with Multi-layered Neural Networks
• DL example: Convolutional Neural Network (CNN).
2
An astronaut lands on an alien planet
3
The
astronaut’s
dilemma
4
Male
or
Female ?
An alien lands on earth
5
6
Male
or
Female ?
The alien’s
dilemma
Gender recognition algorithm for the alien
If the height is > 180 cm
and/or
weight > 75 kg
or
has a beard
or
has short hair
or
has a deep voice
or
is bold
or…
7
There might be exceptions…
The Rule based
approach
The learning approach
• We show the alien 500 humans and tell them who are the
males and who are the female
• The alien will find the characteristics that differentiate males
and females – by identifying repeated patterns.
• The alien needs to be exposed to a lot of humans to identify
repeated patterns. That is how he gains EXPERIENCE.
8
How can a computer learn?
Experience = Data
9
What is machine learning approach?
• An alternative for rule based approach
• Based on a lot of data.
• Implements a pre-determined model that use a standard algorithm that
finds DATA CORRELATIONS.
10
Some ML use cases
• Self driving cars and auto pilots
• Cortana, Siri, Google Assistant (NLP – Natural Language Processing)
• Recommendations - Netflix and Amazon know what you like
• Data security
• Healthcare – Computer Assisted Diagnosis
• Spam detection
• Fraud detection
• Algo-trading
• IoT
11
AI vs. ML vs. DL
12
When to use machine learning?
•When it is difficult for humans to express rules
•Too many variables
•Difficult to understand relationships
•When there is a large amount of available historical data
•When data items relationships and pattern are dynamic and
keep changing
13
ML is not new - why is it so hot these days?
Problem 1: ML usually requires a lot of data
Solution: We are in the “big data” era.
Problem 2: ML requires a lot of computations.
Solutions:
• The CPUs have got very fast
• GPUs can be harnessed and multiply the speed.
• The cloud enables you to build a computing grid fast
and cheap.
Problem 3: ML is complex and difficult
Solution: Available free open source libraries and tools
14
How to use machine learning?
1. Define the problem you wish to solve – ask the right question.
2. Prepare the data - make sure you use relevant data which is represented with
meaningful numbers
3. Choose the right algorithm.
4. Use the algorithm to train a model with training data.
5. Test the model to see if it is correct enough.
15
Define the
problem
Represent
Data with
numbers
Choose the
algorithm
Train the
model
Test the
model
On going learning
16
Rules
Historical
Data
New Data
Retraining
Deploying
Use
cases
17
Machine learning - problem categories
18
Supervised
Unsupervised
Reinforcement
Machine Learning Categories
•Supervised machine learning:
• The program is “trained” on a pre-defined set of “training examples”
• Can reach a pretty accurate conclusion when given new data.
•Unsupervised machine learning:
• The program is given a bunch of data and must find patterns and relationships
therein.
•Reinforcement machine learning:
• The program is a given just an “environment” and a “reward” function for successful
actions – without an exact instructions what to do.
• The program finds a set of actions that will grant it maximum total “rewards”.
19
Machine learning - problem categories
20
Classification
Regression
(Prediction)
Clustering
(grouping)
Classification
• A “Yes or No” choices:
• Does the patient have cancer?
• Is this email a SPAM?
• Is this credit card transaction – a fraud?
• Is the stock market is going up or down?
• A discrete number of choices:
• Determine age group: 0-18, 18-35, 35-60, 60+
• Recognize handwritten characters – a, b, c, d …
• Customers sentiment analysis – very positive/slightly positive/neutral/slightly negative/strongly negative.
Classification requires training data
21
Classification
(discrete number)
Regression
•Regression – for Predictions or forecasts
• What will be the value of MSFT stock tomorrow?
• How much will we sell in the next quarter?
• How many bugs will we need to fix?
• How long will it take to commute from A to B?
• Outputs a continuous value – a float
• Requires training data
22
Regression
(Prediction)
Clustering
• Clustering is grouping variables into groups
• Customers segmentation
• Pattern recognition and image analysis
• Bio informatics
• Training data is not required (unsupervised).
23
Clustering
The set of rules known as a MODEL
MODEL = A quantitative representation of relationships between variables.
• Can be a mathematical equation
Or
• A set of if-then-else statements created dynamically.
Example:
A spam filtering model represents the relationship between the text in the email and
whether it is a spam or not.
26
Model = Function
⁞
27
Model
f (X1, X2, … ,Xn)
Data attribute
Data attribute
Data attribute
Data attribute
Outcome
Numbers
A number
The Goal
To find the best model (function) that
produces the desired result on any set
of inputs
28
Supervised Learning
29
Supervised learning – the training process
30
Prepared
Data
Training
Data
Test Data
Algorithm
Model
Splitting the data Training a model Testing the model
Model
Good
Bad
31
Basic ML Algorithms
and how to use them with Python
Most common ML algorithms
• Prediction:
• Linear Regression
• Polynomial Regression
• Decision Tree Regression
• Random Forest Regression
• Support Vector Regression (SVR)
• Classification:
• Naïve Bayes
• Logistic Regression
• Decision Tree Classification
• Random Forest Classification
• Support Vector Machines (SVM)
• K-Nearest Neighbors classification (K-NN)
32
• Clustering:
• K-Means
• Hierarchical clustering
• Artificial Neural Networks:
• Convolutional Neural Network (CNN)
• Recurrent Neural Network (RNN)
Some Other Algorithms
• Enhanced algorithms:
• Variations of basic algorithms
• Enhanced to perform better and/or add more functionality.
• Complex to understand and use properly
• Ensemble algorithms:
• Special algorithms that contain/combine multiple algorithms under one interface
• Used when you need to tune the model to increase performance
• Can be complex and difficult to debug and troubleshoot.
33
Regression problems
34
Regression
(Prediction)
Common ML algorithms for regression
• Linear Regression
• Polynomial Regression
• Decision Trees
• Random Forest
35
Regression
(Prediction)
Regression examples
• What will be the stocks returns?
• What will be the sales of a product next week?
• If flight is delayed, how does this affect customer satisfaction?
• If I change my investment portfolio, how would it affect my risk?
• How much will I get on my house?
36
Linear regression
Finding the relation between the age
and the salary.
Predicting the salary for any given age
38
Historical
Data points
Experience
Salary
Historical
Data points
Salary (dependent)
Minimize the error
The Error (or Residual) is the offset of
the dependent variable from the
independent variable.
The goal of any regression is to minimize
the error for the training data and to
FIND THE OPTIMAL LINE (or curve in
case of logistic regression).
39
Error
Experience (independent)
Historical
Data points
Salary (dependent)
Minimize the error – sum of square diffs
The error = 𝑖=1
𝑁
(𝑦𝑖 − 𝑦𝑖)2
40
y
Error
𝒚
Experience
Minimize the error with Stochastic Gradient
Descent (SGD)
Error =
1
𝑁 𝑖=1
𝑁
(𝑦𝑖 − 𝑦𝑖)2
N -> number of historical data points
1. Initialize some value for the slope
and intercept.
2. Find the current value of the error
function.
41
Error
Slope
Intercept
3. Find the slope at the current point (partial derivative) and move slightly
downwards in the direction.
4. Repeat until you reach a minimum OR stop after certain number of iterations
Historical
Data points
Salary (dependent)
Experience
Minimize the error
The iterative SGD process will slowly
change the slope and the intercept until
the error is minimal.
42
Multiple Linear Regression
• Simple linear regression:
𝑌 = 𝑏0 + 𝑏1*𝑥1
• Multiple linear regression:
𝑌 = 𝑏0 + 𝑏1*𝑥1 + 𝑏2*𝑥2 + … + 𝑏 𝑛∗𝑥 𝑛
Important note:
You need to exclude variables that will “mess” the prediction and keep the ones
that actually help predicting the desired result.
43
Polynomial Linear Regression
44
Simple linear regression:
𝑌 = 𝑏0 + 𝑏1*𝑥1
Polynomial linear regression:
𝑌 = 𝑏0 + 𝑏1*𝑥1 + 𝑏2∗𝑥1
𝟐
+ … + 𝑏 𝑛∗𝑥1
𝒏
Quadratic: degree = 2
Cubic: degree = 3
Why Python?
• Fast learning curve
• Combines the power of general-purpose language with the ease of use.
• Everything you need for ML: Libraries for data loading, visualization, statistics, natural
language processing, image processing, and more:
• numpy, scipy
• scikit-learn
• matplotlib
• pandas
• tensorflow, pytorch, GraphLab
• A lot of free IDEs and iterative tools (like Spyder, PyCharm, VS code and more)
• Allows for the creation of complex graphical user interfaces (GUIs)
• Easy integration into existing systems and web services.
45
Python becomes the leader for ML
46
* KDnuggests is a leading news site
on Business Analytics, Big Data, Data Mining,
Data Science, and Machine Learning
Python’s Scikit-learn library
• Makes it easier to perform training and evaluation tasks:
• Splitting the data into training and test sets.
• Pre processing before we train with it.
• Selection the important features.
• Model training
• Model tuning for better performance
• Provides a common interface for accessing algorithms
• Based on often used mathematical libraries such as NumPy, SciPy, Matplotlib
• Supports Pandas dataframes.
47
Regression Demo
48
Classification problems
49
Classification
(Yes/No or a
discrete number)
Common ML algorithms for classification
• Naïve Bayes
• Logistic Regression
• Support Vector Machines
• Decision Trees
• K-Nearest Neighbors
50
Classification
(Yes/No or a
discrete number)
Classification examples
• Gender detection:
• Using the first name, length, prefix/suffix, ends with a vowel?
• Age group detection:
• Using users selection and preferences
• Sentiment Analysis – Positive or Negative (polarity identification)
• Using a large bank of tweets and post – unstructured and complicated.
• Trading stocks/derivatives – Up day or Down day?
• Using week day, month, prices in previous days, prices of related stocks.
51
Classification examples
• Detecting Ads – Is the image an Ad or not an Ad?
• Using the Image URL, page URL, Page text, Image caption and so on…
• Customer Churn – Is the customer is about to quit?
• Using: purchases, days since the last purchase, geo location etc…
• Fraud detection – a Fraud or not a Fraud
• Using: payment type, location, failed attempts history, frequency of use
• Credit risk – Will the customer default on a loan?
• Using: Income, employment sector, education, history of defaults
52
The goal is to classify an unknown review as
positive or negative.
Sentiment Analysis Classification
53
ClassificationMovie review
Positive“The movie was pretty good”
Negative“It was boring. I almost fell asleep”
Positive“We had a great evening”
Negative“The leading actor really sucked”
…
Negative“It is the worst film ever”
Naïve Bayes
𝑃 𝑐 𝑥 ) =
𝑃 𝑥1 𝑐 ) ∗ 𝑃 𝑥2 𝑐 ) ∗ … ∗ 𝑃 𝑥𝑛 𝑐 ) ∗ 𝑃(𝑐)
𝑃(𝑥)
“A great movie” – is it a positive review?
54
Prior probabilityLikelihood
Marginal likelihoodPosterior probability
𝑃 𝑃𝑜𝑠𝑖𝑡𝑖𝑣𝑒 "𝐺𝑟𝑒𝑎𝑡 𝑀𝑜𝑣𝑖𝑒" ) =
𝑃 "𝐺𝑟𝑒𝑎𝑡" 𝑃𝑜𝑠𝑖𝑡𝑖𝑣𝑒) ∗ 𝑃 "𝑀𝑜𝑣𝑖𝑒" 𝑃𝑜𝑠𝑖𝑡𝑖𝑣𝑒) ∗ 𝑃(𝑃𝑜𝑠𝑖𝑡𝑖𝑣𝑒)
𝑃 "Great" ∗ 𝑃("𝑀𝑜𝑣𝑖𝑒")
Prior probability – What is the
probability of a positive review
Likelihood – what is the
probability to find the word X
in a positive review
Marginal likelihood – What is the
probability of the word in all the
set (positive & negative)
Posterior probability – What is
the probability of the word X
to indicate a positive review
Naïve Bayes
𝑃 𝑃𝑜𝑠𝑖𝑡𝑖𝑣𝑒 "𝐴 𝑔𝑟𝑒𝑎𝑡 𝑚𝑜𝑣𝑖𝑒" ) =
𝑃 "𝐺𝑟𝑒𝑎𝑡" 𝑃𝑜𝑠𝑖𝑡𝑖𝑣𝑒) ∗ 𝑃 "𝑀𝑜𝑣𝑖𝑒" 𝑃𝑜𝑠𝑖𝑡𝑖𝑣𝑒) ∗ 𝑃(𝑃𝑜𝑠𝑖𝑡𝑖𝑣𝑒)
𝑃(𝑋)
𝑃 𝑁𝑒𝑔𝑎𝑡𝑖𝑣𝑒 "𝐴 𝑔𝑟𝑒𝑎𝑡 𝑚𝑜𝑣𝑖𝑒") =
𝑃 "𝐺𝑟𝑒𝑎𝑡" 𝑁𝑒𝑔𝑎𝑡𝑖𝑣𝑒) ∗ 𝑃 "𝑀𝑜𝑣𝑖𝑒" 𝑁𝑒𝑔𝑎𝑡𝑖𝑣𝑒) ∗ 𝑃(𝑁𝑒𝑔𝑎𝑡𝑖𝑣𝑒)
𝑃(𝑋)
𝑃 𝑃𝑜𝑠𝑖𝑡𝑖𝑣𝑒 "𝐴 𝑔𝑟𝑒𝑎𝑡 𝑚𝑜𝑣𝑖𝑒") > ? < 𝑃 𝑁𝑒𝑔𝑎𝑡𝑖𝑣𝑒 "𝐴 𝑔𝑟𝑒𝑎𝑡 𝑚𝑜𝑣𝑖𝑒")
55
Naïve Bayes algorithm
1. Extract every word (get rid of words like the/is/a etc.).
2. Calculate the probability of each word in positive comments.
𝑃𝑃𝑜𝑠("𝑤𝑜𝑟𝑑") =
Sum(freq. of “word” in positive comments)
Sum (Freq. of “word” in the entire set).
3. For every sentence, calculate PPos and PNeg.
𝑃𝑃𝑜𝑠 sentence = 𝑃𝑃𝑜𝑠 word1 ∗ 𝑃𝑃𝑜𝑠 𝑤𝑜𝑟𝑑2 ∗ ⋯ ∗ 𝑃𝑃𝑜𝑠 𝐴𝑙𝑙
𝑃𝑁𝑒𝑔 sentence =
(1 − 𝑃𝑃𝑜𝑠 word1 ) ∗ (1 − 𝑃𝑃𝑜𝑠 𝑤𝑜𝑟𝑑2 ) ∗ ⋯ ∗ (1 − 𝑃𝑃𝑜𝑠 𝐴𝑙𝑙 )
4. Compare PPos(sentence) and Pneg(sentence)
56
ClassificationMovie review
Positive“The movie was pretty good”
Negative“It was boring. I almost fell asleep”
Positive“We had a great evening”
Negative“The leading actor really sucked”
…
Negative“It is the worst film ever”
PPos(word)Word
95%Great
10%Boring
50%Movie
10%Worst
…
For the entire set: 55% positive -> PPos (All)
PPos(“The movie is great”) =
0.5*0.95*0.55 = 0.261
PNeg(“The movie is great”) =
(1-0.5)*(1-0.95)* (1-0.55) = 0.011
0.261 > 0.011 → Positive 
Naïve Bayes – Continuous values (Gaussian)
57
Salary
Age
Features: Age, Salary
Blue circle = did not purchase = 40
Red cross = purchased = 30
did not purchase = 15
purchased = 10
The chance that X will purchase =
The chance the customers around X purchased *
The chance of purchasing in general /
The chance for a customer to be around X
=
(# of purchases around X/Total purchases) *
(# of purchases/Total customers) /
(Total customers around X/ Total purchases)
𝑃 𝑝𝑢𝑟𝑐ℎ𝑎𝑠𝑒 𝑥) =
𝑃 𝑥 𝑝𝑢𝑟𝑐ℎ𝑎𝑠𝑒) ∗ 𝑃(𝑝𝑢𝑟𝑐ℎ𝑎𝑠𝑒)
𝑃(𝑥)
10
30
∗
30
70
25
70
= 0.4 = 40%
Assuming normal
distribution around X
Naïve Bayes Algorithm
• Each attribute (in our case – word) is used independently (hence the term “naïve”).
• Phrases are not taken under consideration like “far out”.
• Simple to understand
• Fast training
• Stable – insensitive to small changes in the training data
• Can be very robust for solving many classification problems – especially in cases :
• There is a small amount of training data
• You don’t have a lot of knowledge about the problem itself
58
Naïve Bayes Demo
(Gaussian)
59
Logistic Regression
60
K-NN (K Nearest Neighbors)
61
Clustering problems
62
Clustering
Common ML algorithms for clustering
• K-Means
• Fuzzy clustering
• Hierarchical clustering
• Density based clustering
• Distribution based clustering
63
Clustering
Clustering use case example
• A cellular company need to put antennas in a region so that its users receive
optimum signal processing
• Locating police stations so they can arrive fast to areas of high crime rate.
• Identify important products features from customer feedbacks, emails etc.
• Perform efficient data compression
64
Reviews theme clustering
• We need to represent each review to have numeric attributes.
• In this example we’ll use a technique called “Term Frequency Representation”(TFR).
Sample: “With tears in my eyes”
All words: (movie, good, bad, with, boring, tears, yesterday, my, eyes)
(0, 0, 0, 1, 0, 1, 0, 1, 1 )
We represent each review using frequencies of words.
Some words characterize a document more than the others: “With tears in my eyes”.
These words usually occur more rarely and differentiate the review from the others.
65
Reviews theme clustering
Some words characterize a document more than the others: “With tears in my eyes”.
These words usually occur more rarely and differentiate the review from the others.
“With tears in my eyes”.
We now weight the word frequencies to make the rare words stand out and the
common words to have minimal weight.
New weight= 1/frequency of the word
This representation is called Term Frequency – Inverse Document Frequency (TF-IDF)
66
Common Rare Common Common Rare
K-Means algorithm
• Every review is a tuple with N numbers:
(0, 3, 0, 4, 0, ….)
• So every review is a point in an N-
dimensional space hypercube.
• With K-means algorithm you define K
which is “how many groups you want to
converge in clusters”.
1. Initialize the mean points (also call
“centroids”).
67
K-Means iteration 1
2. Assign each review (point) to the
nearest centroid.
3. Look at each cluster and find a
new centroid for the cluster.
4. Repeat 2,3 until the means stop
changing.
68
K-Means iteration 2
2. Assign each review (point) to the
nearest centroid.
3. Look at each cluster and find a
new centroid for the cluster.
4. Repeat 2,3 until the means stop
changing.
69
K-Means iteration 3
2. Assign each review (point) to the
nearest centroid.
3. Look at each cluster and find a
new centroid for the cluster.
4. Repeat 2,3 until the means stop
changing.
70
K-Means iteration 4
2. Assign each review (point) to the
nearest centroid.
3. Look at each cluster and find a new
centroid for the cluster.
4. Repeat 2,3 until the means stop
changing.
71
K-Means iteration 5
2. Assign each review (point) to the
nearest centroid.
3. Look at each cluster and find a new
centroid for the cluster.
4. Repeat 2,3 until the means stop
changing.
72
K-Means iteration 6
2. Assign each review (point) to the
nearest centroid.
3. Look at each cluster and find a new
centroid for the cluster.
4. Repeat 2,3 until the means stop
changing.
73
K-Means algorithm
1. Initialize the mean points
(also call “centroids”).
2. Assign each review
(point) to the nearest
centroid.
3. Look at each cluster and
find a new centroid for
the cluster.
4. Repeat 2,3 until the
means stop changing.
74
Reviews theme clustering
• We need to represent each review to have numeric attributes.
• In this example we’ll use a technique called “Term Frequency Representation”(TFR).
Sample: “With tears in my eyes”
All words: (movie, good, bad, with, boring, tears, yesterday, my, eyes)
(0, 0, 0, 1, 0, 1, 0, 1, 1 )
We represent each review using frequencies of words.
75
Reviews theme clustering
Some words characterize a document more than the others: “With tears in my eyes”.
These words usually occur more rarely and differentiate the review from the others.
“With tears in my eyes”.
We now weight the word frequencies to make the rare words stand out and the
common words to have minimal weight.
New weight= 1/frequency of the word
This representation is called Term Frequency – Inverse Document Frequency (TF-IDF)
76
Common Rare Common Common Rare
K-Means algorithm
• Every review is a tuple with N
numbers: (0, 3, 0, 4, 0, ….)
• So every review is a point in an N-
dimensional space hypercube.
77
Clustering vs. Classification
• Classification – When you want classify data into pre-defined categories.
• Clustering – Grouping data into a set of categories that is NOT known before hand.
• We can mix them both:
• Start with clustering the data
• Then train the data to recognize each cluster and create a model.
• Use the classification model to classify new data.
78
79
Thank you !
Lior.King@gmail.com

Machine Learning Essentials Demystified part1 | Big Data Demystified

  • 1.
    Machine Learning Essentials Part1: Basic algorithms Lior King Lior.King@gmail.com 1
  • 2.
    Agenda • Introduction toMachine Learning (ML) • What is Machine Learning? • The problems we can solved using ML. • The learning process • Basic ML Algorithms using Python and Scikit-learn library • Linear Regression • Naïve Bayes • K-Means • Artificial Neural Networks (ANN) and Deep Learning (DL) using TensorFlow library • Single layered ANN (using MNIST demo). • Deep Learning (DL) with Multi-layered Neural Networks • DL example: Convolutional Neural Network (CNN). 2
  • 3.
    An astronaut landson an alien planet 3
  • 4.
  • 5.
    An alien landson earth 5
  • 6.
  • 7.
    Gender recognition algorithmfor the alien If the height is > 180 cm and/or weight > 75 kg or has a beard or has short hair or has a deep voice or is bold or… 7 There might be exceptions… The Rule based approach
  • 8.
    The learning approach •We show the alien 500 humans and tell them who are the males and who are the female • The alien will find the characteristics that differentiate males and females – by identifying repeated patterns. • The alien needs to be exposed to a lot of humans to identify repeated patterns. That is how he gains EXPERIENCE. 8
  • 9.
    How can acomputer learn? Experience = Data 9
  • 10.
    What is machinelearning approach? • An alternative for rule based approach • Based on a lot of data. • Implements a pre-determined model that use a standard algorithm that finds DATA CORRELATIONS. 10
  • 11.
    Some ML usecases • Self driving cars and auto pilots • Cortana, Siri, Google Assistant (NLP – Natural Language Processing) • Recommendations - Netflix and Amazon know what you like • Data security • Healthcare – Computer Assisted Diagnosis • Spam detection • Fraud detection • Algo-trading • IoT 11
  • 12.
    AI vs. MLvs. DL 12
  • 13.
    When to usemachine learning? •When it is difficult for humans to express rules •Too many variables •Difficult to understand relationships •When there is a large amount of available historical data •When data items relationships and pattern are dynamic and keep changing 13
  • 14.
    ML is notnew - why is it so hot these days? Problem 1: ML usually requires a lot of data Solution: We are in the “big data” era. Problem 2: ML requires a lot of computations. Solutions: • The CPUs have got very fast • GPUs can be harnessed and multiply the speed. • The cloud enables you to build a computing grid fast and cheap. Problem 3: ML is complex and difficult Solution: Available free open source libraries and tools 14
  • 15.
    How to usemachine learning? 1. Define the problem you wish to solve – ask the right question. 2. Prepare the data - make sure you use relevant data which is represented with meaningful numbers 3. Choose the right algorithm. 4. Use the algorithm to train a model with training data. 5. Test the model to see if it is correct enough. 15 Define the problem Represent Data with numbers Choose the algorithm Train the model Test the model
  • 16.
  • 17.
  • 18.
    Machine learning -problem categories 18 Supervised Unsupervised Reinforcement
  • 19.
    Machine Learning Categories •Supervisedmachine learning: • The program is “trained” on a pre-defined set of “training examples” • Can reach a pretty accurate conclusion when given new data. •Unsupervised machine learning: • The program is given a bunch of data and must find patterns and relationships therein. •Reinforcement machine learning: • The program is a given just an “environment” and a “reward” function for successful actions – without an exact instructions what to do. • The program finds a set of actions that will grant it maximum total “rewards”. 19
  • 20.
    Machine learning -problem categories 20 Classification Regression (Prediction) Clustering (grouping)
  • 21.
    Classification • A “Yesor No” choices: • Does the patient have cancer? • Is this email a SPAM? • Is this credit card transaction – a fraud? • Is the stock market is going up or down? • A discrete number of choices: • Determine age group: 0-18, 18-35, 35-60, 60+ • Recognize handwritten characters – a, b, c, d … • Customers sentiment analysis – very positive/slightly positive/neutral/slightly negative/strongly negative. Classification requires training data 21 Classification (discrete number)
  • 22.
    Regression •Regression – forPredictions or forecasts • What will be the value of MSFT stock tomorrow? • How much will we sell in the next quarter? • How many bugs will we need to fix? • How long will it take to commute from A to B? • Outputs a continuous value – a float • Requires training data 22 Regression (Prediction)
  • 23.
    Clustering • Clustering isgrouping variables into groups • Customers segmentation • Pattern recognition and image analysis • Bio informatics • Training data is not required (unsupervised). 23 Clustering
  • 24.
    The set ofrules known as a MODEL MODEL = A quantitative representation of relationships between variables. • Can be a mathematical equation Or • A set of if-then-else statements created dynamically. Example: A spam filtering model represents the relationship between the text in the email and whether it is a spam or not. 26
  • 25.
    Model = Function ⁞ 27 Model f(X1, X2, … ,Xn) Data attribute Data attribute Data attribute Data attribute Outcome Numbers A number
  • 26.
    The Goal To findthe best model (function) that produces the desired result on any set of inputs 28
  • 27.
  • 28.
    Supervised learning –the training process 30 Prepared Data Training Data Test Data Algorithm Model Splitting the data Training a model Testing the model Model Good Bad
  • 29.
    31 Basic ML Algorithms andhow to use them with Python
  • 30.
    Most common MLalgorithms • Prediction: • Linear Regression • Polynomial Regression • Decision Tree Regression • Random Forest Regression • Support Vector Regression (SVR) • Classification: • Naïve Bayes • Logistic Regression • Decision Tree Classification • Random Forest Classification • Support Vector Machines (SVM) • K-Nearest Neighbors classification (K-NN) 32 • Clustering: • K-Means • Hierarchical clustering • Artificial Neural Networks: • Convolutional Neural Network (CNN) • Recurrent Neural Network (RNN)
  • 31.
    Some Other Algorithms •Enhanced algorithms: • Variations of basic algorithms • Enhanced to perform better and/or add more functionality. • Complex to understand and use properly • Ensemble algorithms: • Special algorithms that contain/combine multiple algorithms under one interface • Used when you need to tune the model to increase performance • Can be complex and difficult to debug and troubleshoot. 33
  • 32.
  • 33.
    Common ML algorithmsfor regression • Linear Regression • Polynomial Regression • Decision Trees • Random Forest 35 Regression (Prediction)
  • 34.
    Regression examples • Whatwill be the stocks returns? • What will be the sales of a product next week? • If flight is delayed, how does this affect customer satisfaction? • If I change my investment portfolio, how would it affect my risk? • How much will I get on my house? 36
  • 35.
    Linear regression Finding therelation between the age and the salary. Predicting the salary for any given age 38 Historical Data points Experience Salary
  • 36.
    Historical Data points Salary (dependent) Minimizethe error The Error (or Residual) is the offset of the dependent variable from the independent variable. The goal of any regression is to minimize the error for the training data and to FIND THE OPTIMAL LINE (or curve in case of logistic regression). 39 Error Experience (independent)
  • 37.
    Historical Data points Salary (dependent) Minimizethe error – sum of square diffs The error = 𝑖=1 𝑁 (𝑦𝑖 − 𝑦𝑖)2 40 y Error 𝒚 Experience
  • 38.
    Minimize the errorwith Stochastic Gradient Descent (SGD) Error = 1 𝑁 𝑖=1 𝑁 (𝑦𝑖 − 𝑦𝑖)2 N -> number of historical data points 1. Initialize some value for the slope and intercept. 2. Find the current value of the error function. 41 Error Slope Intercept 3. Find the slope at the current point (partial derivative) and move slightly downwards in the direction. 4. Repeat until you reach a minimum OR stop after certain number of iterations
  • 39.
    Historical Data points Salary (dependent) Experience Minimizethe error The iterative SGD process will slowly change the slope and the intercept until the error is minimal. 42
  • 40.
    Multiple Linear Regression •Simple linear regression: 𝑌 = 𝑏0 + 𝑏1*𝑥1 • Multiple linear regression: 𝑌 = 𝑏0 + 𝑏1*𝑥1 + 𝑏2*𝑥2 + … + 𝑏 𝑛∗𝑥 𝑛 Important note: You need to exclude variables that will “mess” the prediction and keep the ones that actually help predicting the desired result. 43
  • 41.
    Polynomial Linear Regression 44 Simplelinear regression: 𝑌 = 𝑏0 + 𝑏1*𝑥1 Polynomial linear regression: 𝑌 = 𝑏0 + 𝑏1*𝑥1 + 𝑏2∗𝑥1 𝟐 + … + 𝑏 𝑛∗𝑥1 𝒏 Quadratic: degree = 2 Cubic: degree = 3
  • 42.
    Why Python? • Fastlearning curve • Combines the power of general-purpose language with the ease of use. • Everything you need for ML: Libraries for data loading, visualization, statistics, natural language processing, image processing, and more: • numpy, scipy • scikit-learn • matplotlib • pandas • tensorflow, pytorch, GraphLab • A lot of free IDEs and iterative tools (like Spyder, PyCharm, VS code and more) • Allows for the creation of complex graphical user interfaces (GUIs) • Easy integration into existing systems and web services. 45
  • 43.
    Python becomes theleader for ML 46 * KDnuggests is a leading news site on Business Analytics, Big Data, Data Mining, Data Science, and Machine Learning
  • 44.
    Python’s Scikit-learn library •Makes it easier to perform training and evaluation tasks: • Splitting the data into training and test sets. • Pre processing before we train with it. • Selection the important features. • Model training • Model tuning for better performance • Provides a common interface for accessing algorithms • Based on often used mathematical libraries such as NumPy, SciPy, Matplotlib • Supports Pandas dataframes. 47
  • 45.
  • 46.
  • 47.
    Common ML algorithmsfor classification • Naïve Bayes • Logistic Regression • Support Vector Machines • Decision Trees • K-Nearest Neighbors 50 Classification (Yes/No or a discrete number)
  • 48.
    Classification examples • Genderdetection: • Using the first name, length, prefix/suffix, ends with a vowel? • Age group detection: • Using users selection and preferences • Sentiment Analysis – Positive or Negative (polarity identification) • Using a large bank of tweets and post – unstructured and complicated. • Trading stocks/derivatives – Up day or Down day? • Using week day, month, prices in previous days, prices of related stocks. 51
  • 49.
    Classification examples • DetectingAds – Is the image an Ad or not an Ad? • Using the Image URL, page URL, Page text, Image caption and so on… • Customer Churn – Is the customer is about to quit? • Using: purchases, days since the last purchase, geo location etc… • Fraud detection – a Fraud or not a Fraud • Using: payment type, location, failed attempts history, frequency of use • Credit risk – Will the customer default on a loan? • Using: Income, employment sector, education, history of defaults 52
  • 50.
    The goal isto classify an unknown review as positive or negative. Sentiment Analysis Classification 53 ClassificationMovie review Positive“The movie was pretty good” Negative“It was boring. I almost fell asleep” Positive“We had a great evening” Negative“The leading actor really sucked” … Negative“It is the worst film ever”
  • 51.
    Naïve Bayes 𝑃 𝑐𝑥 ) = 𝑃 𝑥1 𝑐 ) ∗ 𝑃 𝑥2 𝑐 ) ∗ … ∗ 𝑃 𝑥𝑛 𝑐 ) ∗ 𝑃(𝑐) 𝑃(𝑥) “A great movie” – is it a positive review? 54 Prior probabilityLikelihood Marginal likelihoodPosterior probability 𝑃 𝑃𝑜𝑠𝑖𝑡𝑖𝑣𝑒 "𝐺𝑟𝑒𝑎𝑡 𝑀𝑜𝑣𝑖𝑒" ) = 𝑃 "𝐺𝑟𝑒𝑎𝑡" 𝑃𝑜𝑠𝑖𝑡𝑖𝑣𝑒) ∗ 𝑃 "𝑀𝑜𝑣𝑖𝑒" 𝑃𝑜𝑠𝑖𝑡𝑖𝑣𝑒) ∗ 𝑃(𝑃𝑜𝑠𝑖𝑡𝑖𝑣𝑒) 𝑃 "Great" ∗ 𝑃("𝑀𝑜𝑣𝑖𝑒") Prior probability – What is the probability of a positive review Likelihood – what is the probability to find the word X in a positive review Marginal likelihood – What is the probability of the word in all the set (positive & negative) Posterior probability – What is the probability of the word X to indicate a positive review
  • 52.
    Naïve Bayes 𝑃 𝑃𝑜𝑠𝑖𝑡𝑖𝑣𝑒"𝐴 𝑔𝑟𝑒𝑎𝑡 𝑚𝑜𝑣𝑖𝑒" ) = 𝑃 "𝐺𝑟𝑒𝑎𝑡" 𝑃𝑜𝑠𝑖𝑡𝑖𝑣𝑒) ∗ 𝑃 "𝑀𝑜𝑣𝑖𝑒" 𝑃𝑜𝑠𝑖𝑡𝑖𝑣𝑒) ∗ 𝑃(𝑃𝑜𝑠𝑖𝑡𝑖𝑣𝑒) 𝑃(𝑋) 𝑃 𝑁𝑒𝑔𝑎𝑡𝑖𝑣𝑒 "𝐴 𝑔𝑟𝑒𝑎𝑡 𝑚𝑜𝑣𝑖𝑒") = 𝑃 "𝐺𝑟𝑒𝑎𝑡" 𝑁𝑒𝑔𝑎𝑡𝑖𝑣𝑒) ∗ 𝑃 "𝑀𝑜𝑣𝑖𝑒" 𝑁𝑒𝑔𝑎𝑡𝑖𝑣𝑒) ∗ 𝑃(𝑁𝑒𝑔𝑎𝑡𝑖𝑣𝑒) 𝑃(𝑋) 𝑃 𝑃𝑜𝑠𝑖𝑡𝑖𝑣𝑒 "𝐴 𝑔𝑟𝑒𝑎𝑡 𝑚𝑜𝑣𝑖𝑒") > ? < 𝑃 𝑁𝑒𝑔𝑎𝑡𝑖𝑣𝑒 "𝐴 𝑔𝑟𝑒𝑎𝑡 𝑚𝑜𝑣𝑖𝑒") 55
  • 53.
    Naïve Bayes algorithm 1.Extract every word (get rid of words like the/is/a etc.). 2. Calculate the probability of each word in positive comments. 𝑃𝑃𝑜𝑠("𝑤𝑜𝑟𝑑") = Sum(freq. of “word” in positive comments) Sum (Freq. of “word” in the entire set). 3. For every sentence, calculate PPos and PNeg. 𝑃𝑃𝑜𝑠 sentence = 𝑃𝑃𝑜𝑠 word1 ∗ 𝑃𝑃𝑜𝑠 𝑤𝑜𝑟𝑑2 ∗ ⋯ ∗ 𝑃𝑃𝑜𝑠 𝐴𝑙𝑙 𝑃𝑁𝑒𝑔 sentence = (1 − 𝑃𝑃𝑜𝑠 word1 ) ∗ (1 − 𝑃𝑃𝑜𝑠 𝑤𝑜𝑟𝑑2 ) ∗ ⋯ ∗ (1 − 𝑃𝑃𝑜𝑠 𝐴𝑙𝑙 ) 4. Compare PPos(sentence) and Pneg(sentence) 56 ClassificationMovie review Positive“The movie was pretty good” Negative“It was boring. I almost fell asleep” Positive“We had a great evening” Negative“The leading actor really sucked” … Negative“It is the worst film ever” PPos(word)Word 95%Great 10%Boring 50%Movie 10%Worst … For the entire set: 55% positive -> PPos (All) PPos(“The movie is great”) = 0.5*0.95*0.55 = 0.261 PNeg(“The movie is great”) = (1-0.5)*(1-0.95)* (1-0.55) = 0.011 0.261 > 0.011 → Positive 
  • 54.
    Naïve Bayes –Continuous values (Gaussian) 57 Salary Age Features: Age, Salary Blue circle = did not purchase = 40 Red cross = purchased = 30 did not purchase = 15 purchased = 10 The chance that X will purchase = The chance the customers around X purchased * The chance of purchasing in general / The chance for a customer to be around X = (# of purchases around X/Total purchases) * (# of purchases/Total customers) / (Total customers around X/ Total purchases) 𝑃 𝑝𝑢𝑟𝑐ℎ𝑎𝑠𝑒 𝑥) = 𝑃 𝑥 𝑝𝑢𝑟𝑐ℎ𝑎𝑠𝑒) ∗ 𝑃(𝑝𝑢𝑟𝑐ℎ𝑎𝑠𝑒) 𝑃(𝑥) 10 30 ∗ 30 70 25 70 = 0.4 = 40% Assuming normal distribution around X
  • 55.
    Naïve Bayes Algorithm •Each attribute (in our case – word) is used independently (hence the term “naïve”). • Phrases are not taken under consideration like “far out”. • Simple to understand • Fast training • Stable – insensitive to small changes in the training data • Can be very robust for solving many classification problems – especially in cases : • There is a small amount of training data • You don’t have a lot of knowledge about the problem itself 58
  • 56.
  • 57.
  • 58.
    K-NN (K NearestNeighbors) 61
  • 59.
  • 60.
    Common ML algorithmsfor clustering • K-Means • Fuzzy clustering • Hierarchical clustering • Density based clustering • Distribution based clustering 63 Clustering
  • 61.
    Clustering use caseexample • A cellular company need to put antennas in a region so that its users receive optimum signal processing • Locating police stations so they can arrive fast to areas of high crime rate. • Identify important products features from customer feedbacks, emails etc. • Perform efficient data compression 64
  • 62.
    Reviews theme clustering •We need to represent each review to have numeric attributes. • In this example we’ll use a technique called “Term Frequency Representation”(TFR). Sample: “With tears in my eyes” All words: (movie, good, bad, with, boring, tears, yesterday, my, eyes) (0, 0, 0, 1, 0, 1, 0, 1, 1 ) We represent each review using frequencies of words. Some words characterize a document more than the others: “With tears in my eyes”. These words usually occur more rarely and differentiate the review from the others. 65
  • 63.
    Reviews theme clustering Somewords characterize a document more than the others: “With tears in my eyes”. These words usually occur more rarely and differentiate the review from the others. “With tears in my eyes”. We now weight the word frequencies to make the rare words stand out and the common words to have minimal weight. New weight= 1/frequency of the word This representation is called Term Frequency – Inverse Document Frequency (TF-IDF) 66 Common Rare Common Common Rare
  • 64.
    K-Means algorithm • Everyreview is a tuple with N numbers: (0, 3, 0, 4, 0, ….) • So every review is a point in an N- dimensional space hypercube. • With K-means algorithm you define K which is “how many groups you want to converge in clusters”. 1. Initialize the mean points (also call “centroids”). 67
  • 65.
    K-Means iteration 1 2.Assign each review (point) to the nearest centroid. 3. Look at each cluster and find a new centroid for the cluster. 4. Repeat 2,3 until the means stop changing. 68
  • 66.
    K-Means iteration 2 2.Assign each review (point) to the nearest centroid. 3. Look at each cluster and find a new centroid for the cluster. 4. Repeat 2,3 until the means stop changing. 69
  • 67.
    K-Means iteration 3 2.Assign each review (point) to the nearest centroid. 3. Look at each cluster and find a new centroid for the cluster. 4. Repeat 2,3 until the means stop changing. 70
  • 68.
    K-Means iteration 4 2.Assign each review (point) to the nearest centroid. 3. Look at each cluster and find a new centroid for the cluster. 4. Repeat 2,3 until the means stop changing. 71
  • 69.
    K-Means iteration 5 2.Assign each review (point) to the nearest centroid. 3. Look at each cluster and find a new centroid for the cluster. 4. Repeat 2,3 until the means stop changing. 72
  • 70.
    K-Means iteration 6 2.Assign each review (point) to the nearest centroid. 3. Look at each cluster and find a new centroid for the cluster. 4. Repeat 2,3 until the means stop changing. 73
  • 71.
    K-Means algorithm 1. Initializethe mean points (also call “centroids”). 2. Assign each review (point) to the nearest centroid. 3. Look at each cluster and find a new centroid for the cluster. 4. Repeat 2,3 until the means stop changing. 74
  • 72.
    Reviews theme clustering •We need to represent each review to have numeric attributes. • In this example we’ll use a technique called “Term Frequency Representation”(TFR). Sample: “With tears in my eyes” All words: (movie, good, bad, with, boring, tears, yesterday, my, eyes) (0, 0, 0, 1, 0, 1, 0, 1, 1 ) We represent each review using frequencies of words. 75
  • 73.
    Reviews theme clustering Somewords characterize a document more than the others: “With tears in my eyes”. These words usually occur more rarely and differentiate the review from the others. “With tears in my eyes”. We now weight the word frequencies to make the rare words stand out and the common words to have minimal weight. New weight= 1/frequency of the word This representation is called Term Frequency – Inverse Document Frequency (TF-IDF) 76 Common Rare Common Common Rare
  • 74.
    K-Means algorithm • Everyreview is a tuple with N numbers: (0, 3, 0, 4, 0, ….) • So every review is a point in an N- dimensional space hypercube. 77
  • 75.
    Clustering vs. Classification •Classification – When you want classify data into pre-defined categories. • Clustering – Grouping data into a set of categories that is NOT known before hand. • We can mix them both: • Start with clustering the data • Then train the data to recognize each cluster and create a model. • Use the classification model to classify new data. 78
  • 76.