Downloaded 130 times


![THE DISCRIMINANT FUNCTION FOR TWO
GROUPS
1 2
1 2
11 1 21 2
11 1 21 2
1 2
2 2
1 2 1 2 1 2
2
1
1 2
,........., , ,.........,
,......, , ,............,
( ) ( ) [ ( )]
( )
n n
n n
z z pl
pl
y y y y
z z z z
z z
z z z z a y y
s s a S a
a S y y
](https://image.slidesharecdn.com/discriminantanalysis-160106121428/85/Discriminant-analysis-6-320.jpg)

![DISCRIMINANT ANALYSIS FOR SEVERAL
GROUPS
Discriminant Functions
1
2
1 2
2 2
1 2 1 2
2
,.....,
( ) ,
( ) [ ( )] ( )
( )
k
pl
z pl
z z
y y H S E
z z a y y a Ha SSH z
s a S a a Ea SSE z
1 1 1
1 2 1 2 1 2( ) ( ) ( )pl pl sa S y y y y S y y a E H
eigenvalues](https://image.slidesharecdn.com/discriminantanalysis-160106121428/85/Discriminant-analysis-8-320.jpg)


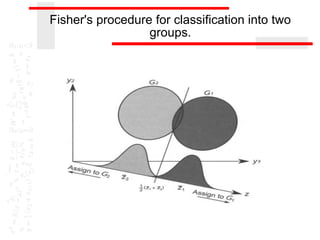


The document discusses discriminant analysis, a statistical technique used for group separation based on categorical dependent variables and interval independent variables. It covers objectives like describing group separation and classification, along with the formulation of discriminant functions and their applications. Additionally, it addresses the significance testing, limitations, and classification methods such as Fisher's procedure and the nearest neighbor classification rule.