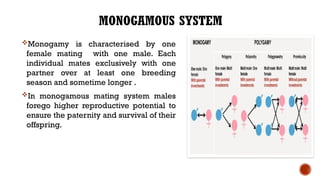
“LINKAGE DISEQUILIBRIUM”,
AND “MATING SYSTEMS”
Guided By; Presented By;
Dr. Ashish Kumar Vidhi
Tripti Shahni
Vikash Namdeo
Shivani Singh
LINKAGE DISEQUILIBRIUM
3
CONTENTS:
 Prior Knowledge
 Independent Vs. Non-independent Segregation
 About Linkage Disequilibrium
 Examples Of Linkage Disequilibrium
 Reason Behind It
 Measures Of Linkage Disequilibrium
 LD Decay
4
PRIOR KNOWLEDGE
 Mendel’s law of independent assortment :-
It states that during sexual reproduction, alleles for different genes are sorted into
gametes independently of each other.
This means that the allele a gamete receives for one gene does not affect the
allele it receives for another gene.
Suppose there are two genes A and B at two separate loci with two
alleles A1, A2 and B1,B2 respectively.
Then according to independent assortment:-
A1(0.7) A2(0.3) Total
B1(0.4) A1B1(0.28) A2B1(0.12) 0.4
B2(0.6) A1B2(0.42) A2B2(0.18) 0.6
Total 0.7 0.3
pA1B1 = pA1 . pB1
pA1B1 . pA2B2 = pA1B2 . pA2B1
5
INDEPENDENT VS NON-INDENDENT ASSORTMENT
 In Independent Assortment :
pA1B1 = pA1 . pB1
pA1B1 . pA2B2 = pA1B2 . pA2B1
D = 0
(Linkage Equilibrium)
 In Non-Independent Assortment:
pA1B1 = pA1 . pB1
pA1B1 . pA2B2 = pA1B2 . pA2B1
This can happen for two reasons:
1. The loci may be very close together on
chromosome (linkage).
2. Hybridization, genetic drift, and
migration can cause deviations from
what is expected of loci that assort
independently. This is called linkage
disequilibrium.
D = pA1B1 - pA1 . pB1
D = pA1B1 . pA2B2 - pA1B2 . pA2B1
This D is the measure of linkage
disequilibrium.
A1(0.7) A2(0.3) Total
B1(0.4) A1B1(0.28) A2B1(0.12) 0.4
B2(0.6) A1B2(0.42) A2B2(0.18) 0.6
Total 0.7 0.3
6
LINKAGE DISEQUILIBRIUM (LD)
 The terms “linkage equilibrium” and “linkage disequilibrium” were first used by Lewontin
and Kojima in 1960.
 Also known as gametic phase equilibrium.
Definition –
Linkage disequilibrium is the non-random association of alleles at different loci.
Loci are in linkage disequilibrium when the frequency of their different alleles is higher or
lower than by chance.
In LD, D ≠ 0.
D > 0; gamete is more frequent than expected
D < 0; it means the combination of these alleles are less frequent than expected.
Linkage
Alleles of two genes are inherited
together because they are located
close to each other in the same
chromosome.
LD
Non-random association between
alleles of two loci in a population
irrespective of their physical location
in the genome.
Note: Linkage between loci could
generate LD but significant LD can be
observed between even unlinked
genes.
7
EXAMPLES OF LINKAGE DISEQUILIBRIUM
Example 1:
1. Papilio memmon is an example
of high linkage disequilibrium.
Clarke and Sheppard studied
that, the allele T+ is almost
always combined with the other
alleles W1, F1, E1, and B1 rather
than with W2, W3, or W4 (and
equivalent alleles at the other
loci). There is a large excess of
the haplotypes T+W1F1E1B1 , T-
W2F2E2B2 , T-W3F3E3B3 , etc. whlie
haplotypes such as T+W2F2E2B2 ,
T+W1F2E2B2 or T+W1F1E2B2 are
almost absent. This LD in P.
memmon is caused by
selection. Reference: Evolution, a book by Mark Ridley, 3rd
edition.
8
Example 2:
The HLA system in human is a set of linked genes on human chromosomes 6 also
provide examples of linkage disequilibrium. Particular combinations of genes are
found in greater than random proportions. In North European population there is
characteristically an excess of the A1B8 haplotype.
If A1 and B8 combined in their population proportions, A1B8 would have frequency
of about 0.023(2.3%) but in fact it is found in about 9.3% of individual (0.093 –
0.023 = D = 0.07)
In all, the HLA-A and –B loci have six clear cases of linkage disequilibrium, A1B8
and A3B7 are the most striking.
Reference: Evolution, a book by Mark Ridley, 3rd
edition.
9
REASON BEHIND IT
 Selection – If selection favours individuals with particular combination of alleles,
then it produces linkage disequilibrium.
 Linkage – as the rate of recombination between two loci decreases the amount of
time that alleles can be non-randomly associated between them goes up.
 Random drift – Random processes have the interesting property of being able to
cause persistent, not just transitory, linkage disequilibrium. If random sampling
produces by chance an excess of a haplotype in a generation, linkage
disequilibrium will have risen.
 Non-random mating – If individuals with gene A1 tend to mate with B1 types rather
than B2 types, A1B1 haplotypes will have excess frequency over that for random
mating.
10
Measure of LD (D, D’, r2
)
To understand the calculation of linkage disequilibrium consider following example:
Let the gene frequency in the population of A1 = p1, A2 = p2, B1 = q1 and B2 = q2.Then
We can deduce linkage disequilibrium for each haplotype the deviation of observed
haplotype frequency from its corresponding allelic frequencies expected under equilibrium.
D11 = a - p1q1
D12 = b - p1q2
D21 = c – p2q1
D22 = d – p2q2
A1(p1) A2(p2)
B1(q1) A1B1 A2B1
B2(q2) A1B2 A2B2
Haplotype Frequencies in population
A1B1
A1B2
A2B1
A2B2
a= p1q1 + D
b= p1q2 – D
c= p2q1 - D
d= p2q2 + D
11
Calculation of LD measure :
Commonly used measure of linkage disequilibrium, D
D = a.d – b.c Or D = p11 . P22 – p21 . p12
Estimate of D in case of Linkage
Equilibrium
If allele frequencies of p1 and q1 are both 0.5
and equilibrium occurs.
p1q1 = p1 . q1 = 0.5 x 0.5 = 0.25
p1q2 = p1 . q2 = 0.5 x 0.5 = 0.25
p2q1 = p2 . q1 = 0.5 x 0.5 = 0.25
p2q2 = p2 . q2 = 0.5 x 0.5 = 0.25
D = 0
Estimate of D in case of Linkage
Disequilibrium
If allele frequencies of p1 and q1 are both 0.5
and there is complete non-random
association(only AB and ab exist in the
population) with equal allele frequencies at
all loci.
a= p1q1 + D = 0.25 + D = 0.5
b= p1q2 – D = 0.25 + D = 0.5
c= p2q1 – D = 0.25 – D = 0
d= p2q2 + D = 0.25 – D = 0
D = a.d – b.c = 0.25
STANDARDIZATION OF D
Sometimes depending on the allele frequency of two loci, the value of D can de
negative but actual gametic frequencies cannot be negative.
To overcome this issue, standardization methods have been proposed.
Lewontin suggested calculating the normalized linkage disequilibrium D’ by
dividing the observed and expected allele frequencies as follows:
The value of D’ range between 0 and 1..
When D ≥ 0 ; D’ = ; Where, Dmax is the smaller of p1q2 and p2q1.
When D < 0 ; D’ = ; Where, Dmax is the smaller of p1q1 and p2q2.
Another LD measure
Correlation between a pair of loci is calculated using the following formula, usually
expressed as r –
r=
12
13
Testing significance of LD
To test if LD is statistically significant we can do a X2
test :
X2
= ∑(obs – exp)2
/ exp Or X2
= r2
N
Where N is the number of chromosomes in the sample.
14
Practice Question :
Answer :
15
LD DECAY
In the absence of evolutionary forces other than random mating, Mendelian segregation, random
chromosomal assormant and chromosomal cross over ( i.e. in the absence of natural selection, inbreeding
and genetic drift), the linkage disequilibrium measure D converges to zero along the axis at a rate
depending on the magnitude of the recombination rate c between the two loci.
Since,
D = x11 – p1q1
In the next generation:
x’11 = (1 – c)x11 + cp1q1
It can be written as
x’11 – p1q1 = (1- c)(x11 - p1q1)
So that
D1 = (1 – c)D0
Where D at nth
generation is designated as Dn.
Dn = (1 – c)n
D0
If n  ∞, then (1 – c)n
 0 so that Dn converges to zero
16
SIGNIFICANCE OF LD
 Understanding Evolutionary Processes - LD can provide insights into the
evolutionary forces acting on a population, such as natural selection, genetic drift,
mutation, and recombination rates.
 Genetic Mapping - LD is fundamental in mapping genetic traits, particularly in
association studies. It allows researchers to identify chromosomal regions
associated with diseases or traits by analyzing the non-random association of
specific alleles with the trait of interest.
 Drug Development and Personalized Medicine - By understanding LD patterns,
researchers can pinpoint target genes that could be involved in disease
mechanisms and tailor personalized treatment plans based on an individual's
genetic profile.
 Conservation Genetics - LD can help in managing and conserving genetic diversity
within endangered populations by providing insights into their genetic structure
and identifying areas of reduced recombination or higher inbreeding.
17
THE FUTURE OF LD STUDIES
 Enhanced Precision Medicine
 Fine-Mapping of Complex Traits
 Population Genomics and Evolution
 CRISPR and Gene Editing
18
REFERENCES:
 Evolution, a book by Mark Ridley, 3rd
edition.
 Slatkin, M. (2008).“Linkage disequilibrium – understanding the evolutionary past
and mapping the medical future.” Nature Reviews Genetics,9(6) 477-485.
 Pritchard, J. K., & Prezeworski, M. (2001).“ Linkage disequilibrium in humans:
Models and data.” American Journal of Human Genetics,69(1), 1- 14.
19
MULTIPLE CHOICE QUESTIONS
1. In a population, calculate the amount of linkage
disequilibrium for the following haplotype
frequencies:
A1B1 = 0.2 A2B2 = 0.45 A1B2 = .15 A2B1 = 0.2
a. -0.03
b. 0.03
c. -0.06
d. 0.06
2. Linkage disequilibrium is the ______ association of
alleles at different loci.
a. Random
b. Non-random
c. Integrated
d. Both a and b
3. Rate of LD decay increases with
a. Increase in recombination
b. Constant gene flow
c. Decrease in recombination
d. Constant recombination
4. Linkage disequilibrium arises due to
a. Linkage
b. Selection
c. Non- random mating
d. All of the above
5.When D > 0, it signifies
a. Haplotype frequency is same as
expected frequency
b. Haplotype frequency is more than
expected frequency
c. Haplotype frequency is less than
expected frequency
d. Both b and c
MATING SYSTEMS
21
CONTENTS
 Concept of Mating System
 Types of Mating Systems
 Random Mating
 Non random Mating
 Applications in Conservation Biology
22
CONCEPT OF MATING SYSTEM
 Mating refer to selecting a mate by the
opposite sex who participate in sexual
reproduction there by transmitting
hereditary character from one
generation to another generation.
 Mating system concern the distribution
of genes in the population and ultimately
reproduction within a population
defining which male mate with which
female and the condition under which
those mating occur
CONCEPT OF MATING SYSTEM
Mating is restricted withing the species thus the genetic character are
transmitted through generation and confined to a given species
Mating within a species is compatible and mating between species in
unlikely and is supposed to be incompatible .
Organismal diversity is the existence of numerous mating strategies
Mating system are evolutionary liable and can respond to natural
selection hence understanding mating system diversity has been a
major theme in evolutionary biology
24
TYPES OF MATING SYSTEM
MONOGAMOUS SYSTEM
Monogamy is characterised by one
female mating with one male. Each
individual mates exclusively with one
partner over at least one breeding
season and sometime longer .
In monogamous mating system males
forego higher reproductive potential to
ensure the paternity and survival of their
offspring.
CONTINUE…
 In monogamous species, males and females are
morphologically that they may be difficult or impossible to
distinguish based on external characteristics.
 Monogamous is rare in organism(rare in mammals), only
occur 3-9 %.monogamy is high in Avian species(90%).
 Examples-alligator, swan, black vulture,penguin.
POLYGAMOUS /POLYGAMY
 Polygamy is defined as a mating system in which either males or
females have more than one mate during a given breeding season
/cycle.
 It may be of two type:-POLYGYNY AND POLYANDRY
 POLYGYNY :-a single male mates with multiple female.
 POLYANDRY :-a single female mates with multiple male.
 Secondary sexual character are more developed in polygamous.
POLYGYNY
 Involve a single male and many females .
 Polygynous species are generally Dimorphic (sexual
dimorphism) with male being showier and often larger than
female.
 In polygyny (Greek for many females ),one male with more than
one females but females mate only with one male. Female
receptiveness last from week to month
 Polygyny in birds occurs infrequently when compared to
mammals as monogamy is most commonly observed
 Example :-elephant ,seal gorilla, red winged warbler house
wren.
POLYANDRY
 In polyandry (Greek for many males ) one female mate with
several males but males mate with only one female.
 Involve single female have relationship with many males.
polyandrous species are often dimorphic but in this case female
are generally more ornamented and larger than males
 Polyandry is relatively less (less than 1%).
CONTINUE….
 Here, females take advantage of the increased resources available to
rear offspring by laying clutches of eggs with more than one
male .males provide all incubation and parenting and females mate
and leave egg with two or more males. Females may also mate several
males to genetically diversify their offspring which in turn increases
diseases resistance.
 Parental care :-males perform all or most parental duties ( males
incubate the egg and care for young )or group member do the
parental care.
 Sperm competition may result.
MATING SYSTEM
RANDOM
MATING
BASED ON PHENOTYPIC
RELATIONSHIP
1. PHENOTYPIC ASSORTATIVE
2. PHENOTYPIC DISASSORTATIVE
BASED ON GENOTYPIC /PEDIGREE
ANALYSIS
1. GENETIC ASSORTATIVE
2. GENETIC DISASSORTATIVE
NON RANDOM
MATING
Each female gamete has equal chances to unite with every male gamete.
It’s form of outbreeding.
In plant breeding some form of selection is practiced such mating system
called as random mating with selection.
With selection-
1. Increase frequency of alleles for witch selection is practiced.
2. Reduce frequency of other alleles
3. Increase variance
4. These changes are more pronounced when the character is highly
heritable and is governed by one or a
RANDOM MATING
CONTINUE…
Random mating in small population is unable to prevent an
increase in homozygosity due to inbreeding and genetic drift
Without selection –
1) Gene frequency-constant
2) Variation for character –constant
3) Correlation between relative or prepotency –constant
4) Degree of homozygosity-constant
USES OF RANDOM MATING IN PLANT BREEDING
Used for progeny testing
Production and maintenance of synthetic and
composite varieties
Production of polycross progenies
Evolutionary advantages – maintained high
level of diversity
GENETIC ASSORTIVE MATING SYSTEM
 Mating occur between individual that are more closely related by ancestry than in
random mating
 More commonly known as inbreeding.
Without selection
1. Increased total variability among lines
2. Decreased total variability within lines due to random fixation of genes in different
families
With selection
3. Variability is reduced towards the direction of selection
4. Homozygosity-increased due to fixation of genes
5. Heterozygosity-elimination of heterozygotes from a population due to fixation of
genes
GENETIC DISASSORTIVE MATING SYSTEM
Such individuals are mated which are less closely related by ancestry
than random mating
Commonly called as outbreeding
Totally unrelated individuals are mated
These individual belong to different population
e.g. inter varietal and interspecific crosses
1. Variability - increased due to combination of two or more genes from
two or more different sources
2. Heterozygosity - increased due to combination of genes from different
lines
CONTINUE…
3. Homozygosity - reduced rapidaly because outbreeding favoures
heterozygotes
4. Population mean – increased due to combining more dominant
genes from different lines
5. Genetic correlation – decreased due decreased in homozygosity
PHENOTYPIC ASSORTIVE MATING SYSTEM
 Mating between individual which are phenotypically more similar than would
be expected under randome mating
 Refers to mating of extreme types i.e. cross between Aa and AA, aa and aa,
also Aa and aa
 Only two extreme phenotype i,.e. lowest and highest remain in the population
 Variability : increased since it divides the population into two extreme
phenotype
 Homozygosity :lead to complete homozygosity in single generation
 Genetic correction :perfect genetic correlation between number of progenies
is achieved in one generation
 Population mean : divided into two according to variability
PHENOTYPIC DISASSORTATIVE MATING
SYSTEM
Mating between phenotypic dissimilar individual belonging to same population
Mating between individual having genotype AA and aa ,Aa and aa
Variability : constant since it reduces inbreeding
Heterozygosity :remain constant or slight increase
Genetic correlation : decrease due to decrease in progenies
 Gene frequency :remain constant or sometime may be slight increase in the
heterozygosity
 Mating of dominant x recessive are included in this type of mating
AA or Aa x aa
Aa or aa
APPLICATION IN CONSERVATION BIOLOGY
 MAINTAINING GENETIC DIVERSITY
 Understanding the genetic consequences of different mating system can inform conservation
strategies aimed at preserving genetic diversity in endangered species, such as the
introduction of new genetic material or the management of breeding program
 MITIGATING INBREEDING
 Knowledge of mating system dynamic can help identify and address issues related to
inbreeding depression in small or isolated population which can have detrimental effects on the
long term viability of a species.
 REINTRODUCTION PROGRAME
 Insight into mating system genetic can guide the development of successful
reintroduction program for endangered species ensuring that released individual have
the best chance of mating and reproducing successfully in their new environment
THANKYOU

Linkage Disequilibrium and Mating Systems: Genetic Interactions and Evolutionary Dynamics

  • 1.
    “LINKAGE DISEQUILIBRIUM”, AND “MATINGSYSTEMS” Guided By; Presented By; Dr. Ashish Kumar Vidhi Tripti Shahni Vikash Namdeo Shivani Singh
  • 2.
  • 3.
    3 CONTENTS:  Prior Knowledge Independent Vs. Non-independent Segregation  About Linkage Disequilibrium  Examples Of Linkage Disequilibrium  Reason Behind It  Measures Of Linkage Disequilibrium  LD Decay
  • 4.
    4 PRIOR KNOWLEDGE  Mendel’slaw of independent assortment :- It states that during sexual reproduction, alleles for different genes are sorted into gametes independently of each other. This means that the allele a gamete receives for one gene does not affect the allele it receives for another gene. Suppose there are two genes A and B at two separate loci with two alleles A1, A2 and B1,B2 respectively. Then according to independent assortment:- A1(0.7) A2(0.3) Total B1(0.4) A1B1(0.28) A2B1(0.12) 0.4 B2(0.6) A1B2(0.42) A2B2(0.18) 0.6 Total 0.7 0.3 pA1B1 = pA1 . pB1 pA1B1 . pA2B2 = pA1B2 . pA2B1
  • 5.
    5 INDEPENDENT VS NON-INDENDENTASSORTMENT  In Independent Assortment : pA1B1 = pA1 . pB1 pA1B1 . pA2B2 = pA1B2 . pA2B1 D = 0 (Linkage Equilibrium)  In Non-Independent Assortment: pA1B1 = pA1 . pB1 pA1B1 . pA2B2 = pA1B2 . pA2B1 This can happen for two reasons: 1. The loci may be very close together on chromosome (linkage). 2. Hybridization, genetic drift, and migration can cause deviations from what is expected of loci that assort independently. This is called linkage disequilibrium. D = pA1B1 - pA1 . pB1 D = pA1B1 . pA2B2 - pA1B2 . pA2B1 This D is the measure of linkage disequilibrium. A1(0.7) A2(0.3) Total B1(0.4) A1B1(0.28) A2B1(0.12) 0.4 B2(0.6) A1B2(0.42) A2B2(0.18) 0.6 Total 0.7 0.3
  • 6.
    6 LINKAGE DISEQUILIBRIUM (LD) The terms “linkage equilibrium” and “linkage disequilibrium” were first used by Lewontin and Kojima in 1960.  Also known as gametic phase equilibrium. Definition – Linkage disequilibrium is the non-random association of alleles at different loci. Loci are in linkage disequilibrium when the frequency of their different alleles is higher or lower than by chance. In LD, D ≠ 0. D > 0; gamete is more frequent than expected D < 0; it means the combination of these alleles are less frequent than expected. Linkage Alleles of two genes are inherited together because they are located close to each other in the same chromosome. LD Non-random association between alleles of two loci in a population irrespective of their physical location in the genome. Note: Linkage between loci could generate LD but significant LD can be observed between even unlinked genes.
  • 7.
    7 EXAMPLES OF LINKAGEDISEQUILIBRIUM Example 1: 1. Papilio memmon is an example of high linkage disequilibrium. Clarke and Sheppard studied that, the allele T+ is almost always combined with the other alleles W1, F1, E1, and B1 rather than with W2, W3, or W4 (and equivalent alleles at the other loci). There is a large excess of the haplotypes T+W1F1E1B1 , T- W2F2E2B2 , T-W3F3E3B3 , etc. whlie haplotypes such as T+W2F2E2B2 , T+W1F2E2B2 or T+W1F1E2B2 are almost absent. This LD in P. memmon is caused by selection. Reference: Evolution, a book by Mark Ridley, 3rd edition.
  • 8.
    8 Example 2: The HLAsystem in human is a set of linked genes on human chromosomes 6 also provide examples of linkage disequilibrium. Particular combinations of genes are found in greater than random proportions. In North European population there is characteristically an excess of the A1B8 haplotype. If A1 and B8 combined in their population proportions, A1B8 would have frequency of about 0.023(2.3%) but in fact it is found in about 9.3% of individual (0.093 – 0.023 = D = 0.07) In all, the HLA-A and –B loci have six clear cases of linkage disequilibrium, A1B8 and A3B7 are the most striking. Reference: Evolution, a book by Mark Ridley, 3rd edition.
  • 9.
    9 REASON BEHIND IT Selection – If selection favours individuals with particular combination of alleles, then it produces linkage disequilibrium.  Linkage – as the rate of recombination between two loci decreases the amount of time that alleles can be non-randomly associated between them goes up.  Random drift – Random processes have the interesting property of being able to cause persistent, not just transitory, linkage disequilibrium. If random sampling produces by chance an excess of a haplotype in a generation, linkage disequilibrium will have risen.  Non-random mating – If individuals with gene A1 tend to mate with B1 types rather than B2 types, A1B1 haplotypes will have excess frequency over that for random mating.
  • 10.
    10 Measure of LD(D, D’, r2 ) To understand the calculation of linkage disequilibrium consider following example: Let the gene frequency in the population of A1 = p1, A2 = p2, B1 = q1 and B2 = q2.Then We can deduce linkage disequilibrium for each haplotype the deviation of observed haplotype frequency from its corresponding allelic frequencies expected under equilibrium. D11 = a - p1q1 D12 = b - p1q2 D21 = c – p2q1 D22 = d – p2q2 A1(p1) A2(p2) B1(q1) A1B1 A2B1 B2(q2) A1B2 A2B2 Haplotype Frequencies in population A1B1 A1B2 A2B1 A2B2 a= p1q1 + D b= p1q2 – D c= p2q1 - D d= p2q2 + D
  • 11.
    11 Calculation of LDmeasure : Commonly used measure of linkage disequilibrium, D D = a.d – b.c Or D = p11 . P22 – p21 . p12 Estimate of D in case of Linkage Equilibrium If allele frequencies of p1 and q1 are both 0.5 and equilibrium occurs. p1q1 = p1 . q1 = 0.5 x 0.5 = 0.25 p1q2 = p1 . q2 = 0.5 x 0.5 = 0.25 p2q1 = p2 . q1 = 0.5 x 0.5 = 0.25 p2q2 = p2 . q2 = 0.5 x 0.5 = 0.25 D = 0 Estimate of D in case of Linkage Disequilibrium If allele frequencies of p1 and q1 are both 0.5 and there is complete non-random association(only AB and ab exist in the population) with equal allele frequencies at all loci. a= p1q1 + D = 0.25 + D = 0.5 b= p1q2 – D = 0.25 + D = 0.5 c= p2q1 – D = 0.25 – D = 0 d= p2q2 + D = 0.25 – D = 0 D = a.d – b.c = 0.25
  • 12.
    STANDARDIZATION OF D Sometimesdepending on the allele frequency of two loci, the value of D can de negative but actual gametic frequencies cannot be negative. To overcome this issue, standardization methods have been proposed. Lewontin suggested calculating the normalized linkage disequilibrium D’ by dividing the observed and expected allele frequencies as follows: The value of D’ range between 0 and 1.. When D ≥ 0 ; D’ = ; Where, Dmax is the smaller of p1q2 and p2q1. When D < 0 ; D’ = ; Where, Dmax is the smaller of p1q1 and p2q2. Another LD measure Correlation between a pair of loci is calculated using the following formula, usually expressed as r – r= 12
  • 13.
    13 Testing significance ofLD To test if LD is statistically significant we can do a X2 test : X2 = ∑(obs – exp)2 / exp Or X2 = r2 N Where N is the number of chromosomes in the sample.
  • 14.
  • 15.
    15 LD DECAY In theabsence of evolutionary forces other than random mating, Mendelian segregation, random chromosomal assormant and chromosomal cross over ( i.e. in the absence of natural selection, inbreeding and genetic drift), the linkage disequilibrium measure D converges to zero along the axis at a rate depending on the magnitude of the recombination rate c between the two loci. Since, D = x11 – p1q1 In the next generation: x’11 = (1 – c)x11 + cp1q1 It can be written as x’11 – p1q1 = (1- c)(x11 - p1q1) So that D1 = (1 – c)D0 Where D at nth generation is designated as Dn. Dn = (1 – c)n D0 If n  ∞, then (1 – c)n  0 so that Dn converges to zero
  • 16.
    16 SIGNIFICANCE OF LD Understanding Evolutionary Processes - LD can provide insights into the evolutionary forces acting on a population, such as natural selection, genetic drift, mutation, and recombination rates.  Genetic Mapping - LD is fundamental in mapping genetic traits, particularly in association studies. It allows researchers to identify chromosomal regions associated with diseases or traits by analyzing the non-random association of specific alleles with the trait of interest.  Drug Development and Personalized Medicine - By understanding LD patterns, researchers can pinpoint target genes that could be involved in disease mechanisms and tailor personalized treatment plans based on an individual's genetic profile.  Conservation Genetics - LD can help in managing and conserving genetic diversity within endangered populations by providing insights into their genetic structure and identifying areas of reduced recombination or higher inbreeding.
  • 17.
    17 THE FUTURE OFLD STUDIES  Enhanced Precision Medicine  Fine-Mapping of Complex Traits  Population Genomics and Evolution  CRISPR and Gene Editing
  • 18.
    18 REFERENCES:  Evolution, abook by Mark Ridley, 3rd edition.  Slatkin, M. (2008).“Linkage disequilibrium – understanding the evolutionary past and mapping the medical future.” Nature Reviews Genetics,9(6) 477-485.  Pritchard, J. K., & Prezeworski, M. (2001).“ Linkage disequilibrium in humans: Models and data.” American Journal of Human Genetics,69(1), 1- 14.
  • 19.
    19 MULTIPLE CHOICE QUESTIONS 1.In a population, calculate the amount of linkage disequilibrium for the following haplotype frequencies: A1B1 = 0.2 A2B2 = 0.45 A1B2 = .15 A2B1 = 0.2 a. -0.03 b. 0.03 c. -0.06 d. 0.06 2. Linkage disequilibrium is the ______ association of alleles at different loci. a. Random b. Non-random c. Integrated d. Both a and b 3. Rate of LD decay increases with a. Increase in recombination b. Constant gene flow c. Decrease in recombination d. Constant recombination 4. Linkage disequilibrium arises due to a. Linkage b. Selection c. Non- random mating d. All of the above 5.When D > 0, it signifies a. Haplotype frequency is same as expected frequency b. Haplotype frequency is more than expected frequency c. Haplotype frequency is less than expected frequency d. Both b and c
  • 20.
  • 21.
    21 CONTENTS  Concept ofMating System  Types of Mating Systems  Random Mating  Non random Mating  Applications in Conservation Biology
  • 22.
    22 CONCEPT OF MATINGSYSTEM  Mating refer to selecting a mate by the opposite sex who participate in sexual reproduction there by transmitting hereditary character from one generation to another generation.  Mating system concern the distribution of genes in the population and ultimately reproduction within a population defining which male mate with which female and the condition under which those mating occur
  • 23.
    CONCEPT OF MATINGSYSTEM Mating is restricted withing the species thus the genetic character are transmitted through generation and confined to a given species Mating within a species is compatible and mating between species in unlikely and is supposed to be incompatible . Organismal diversity is the existence of numerous mating strategies Mating system are evolutionary liable and can respond to natural selection hence understanding mating system diversity has been a major theme in evolutionary biology
  • 24.
  • 25.
    MONOGAMOUS SYSTEM Monogamy ischaracterised by one female mating with one male. Each individual mates exclusively with one partner over at least one breeding season and sometime longer . In monogamous mating system males forego higher reproductive potential to ensure the paternity and survival of their offspring.
  • 26.
    CONTINUE…  In monogamousspecies, males and females are morphologically that they may be difficult or impossible to distinguish based on external characteristics.  Monogamous is rare in organism(rare in mammals), only occur 3-9 %.monogamy is high in Avian species(90%).  Examples-alligator, swan, black vulture,penguin.
  • 27.
    POLYGAMOUS /POLYGAMY  Polygamyis defined as a mating system in which either males or females have more than one mate during a given breeding season /cycle.  It may be of two type:-POLYGYNY AND POLYANDRY  POLYGYNY :-a single male mates with multiple female.  POLYANDRY :-a single female mates with multiple male.  Secondary sexual character are more developed in polygamous.
  • 28.
    POLYGYNY  Involve asingle male and many females .  Polygynous species are generally Dimorphic (sexual dimorphism) with male being showier and often larger than female.  In polygyny (Greek for many females ),one male with more than one females but females mate only with one male. Female receptiveness last from week to month  Polygyny in birds occurs infrequently when compared to mammals as monogamy is most commonly observed  Example :-elephant ,seal gorilla, red winged warbler house wren.
  • 29.
    POLYANDRY  In polyandry(Greek for many males ) one female mate with several males but males mate with only one female.  Involve single female have relationship with many males. polyandrous species are often dimorphic but in this case female are generally more ornamented and larger than males  Polyandry is relatively less (less than 1%).
  • 30.
    CONTINUE….  Here, femalestake advantage of the increased resources available to rear offspring by laying clutches of eggs with more than one male .males provide all incubation and parenting and females mate and leave egg with two or more males. Females may also mate several males to genetically diversify their offspring which in turn increases diseases resistance.  Parental care :-males perform all or most parental duties ( males incubate the egg and care for young )or group member do the parental care.  Sperm competition may result.
  • 31.
    MATING SYSTEM RANDOM MATING BASED ONPHENOTYPIC RELATIONSHIP 1. PHENOTYPIC ASSORTATIVE 2. PHENOTYPIC DISASSORTATIVE BASED ON GENOTYPIC /PEDIGREE ANALYSIS 1. GENETIC ASSORTATIVE 2. GENETIC DISASSORTATIVE NON RANDOM MATING
  • 32.
    Each female gametehas equal chances to unite with every male gamete. It’s form of outbreeding. In plant breeding some form of selection is practiced such mating system called as random mating with selection. With selection- 1. Increase frequency of alleles for witch selection is practiced. 2. Reduce frequency of other alleles 3. Increase variance 4. These changes are more pronounced when the character is highly heritable and is governed by one or a RANDOM MATING
  • 33.
    CONTINUE… Random mating insmall population is unable to prevent an increase in homozygosity due to inbreeding and genetic drift Without selection – 1) Gene frequency-constant 2) Variation for character –constant 3) Correlation between relative or prepotency –constant 4) Degree of homozygosity-constant
  • 34.
    USES OF RANDOMMATING IN PLANT BREEDING Used for progeny testing Production and maintenance of synthetic and composite varieties Production of polycross progenies Evolutionary advantages – maintained high level of diversity
  • 35.
    GENETIC ASSORTIVE MATINGSYSTEM  Mating occur between individual that are more closely related by ancestry than in random mating  More commonly known as inbreeding. Without selection 1. Increased total variability among lines 2. Decreased total variability within lines due to random fixation of genes in different families With selection 3. Variability is reduced towards the direction of selection 4. Homozygosity-increased due to fixation of genes 5. Heterozygosity-elimination of heterozygotes from a population due to fixation of genes
  • 36.
    GENETIC DISASSORTIVE MATINGSYSTEM Such individuals are mated which are less closely related by ancestry than random mating Commonly called as outbreeding Totally unrelated individuals are mated These individual belong to different population e.g. inter varietal and interspecific crosses 1. Variability - increased due to combination of two or more genes from two or more different sources 2. Heterozygosity - increased due to combination of genes from different lines
  • 37.
    CONTINUE… 3. Homozygosity -reduced rapidaly because outbreeding favoures heterozygotes 4. Population mean – increased due to combining more dominant genes from different lines 5. Genetic correlation – decreased due decreased in homozygosity
  • 38.
    PHENOTYPIC ASSORTIVE MATINGSYSTEM  Mating between individual which are phenotypically more similar than would be expected under randome mating  Refers to mating of extreme types i.e. cross between Aa and AA, aa and aa, also Aa and aa  Only two extreme phenotype i,.e. lowest and highest remain in the population  Variability : increased since it divides the population into two extreme phenotype  Homozygosity :lead to complete homozygosity in single generation  Genetic correction :perfect genetic correlation between number of progenies is achieved in one generation  Population mean : divided into two according to variability
  • 39.
    PHENOTYPIC DISASSORTATIVE MATING SYSTEM Matingbetween phenotypic dissimilar individual belonging to same population Mating between individual having genotype AA and aa ,Aa and aa Variability : constant since it reduces inbreeding Heterozygosity :remain constant or slight increase Genetic correlation : decrease due to decrease in progenies  Gene frequency :remain constant or sometime may be slight increase in the heterozygosity  Mating of dominant x recessive are included in this type of mating AA or Aa x aa Aa or aa
  • 40.
    APPLICATION IN CONSERVATIONBIOLOGY  MAINTAINING GENETIC DIVERSITY  Understanding the genetic consequences of different mating system can inform conservation strategies aimed at preserving genetic diversity in endangered species, such as the introduction of new genetic material or the management of breeding program  MITIGATING INBREEDING  Knowledge of mating system dynamic can help identify and address issues related to inbreeding depression in small or isolated population which can have detrimental effects on the long term viability of a species.  REINTRODUCTION PROGRAME  Insight into mating system genetic can guide the development of successful reintroduction program for endangered species ensuring that released individual have the best chance of mating and reproducing successfully in their new environment
  • 41.