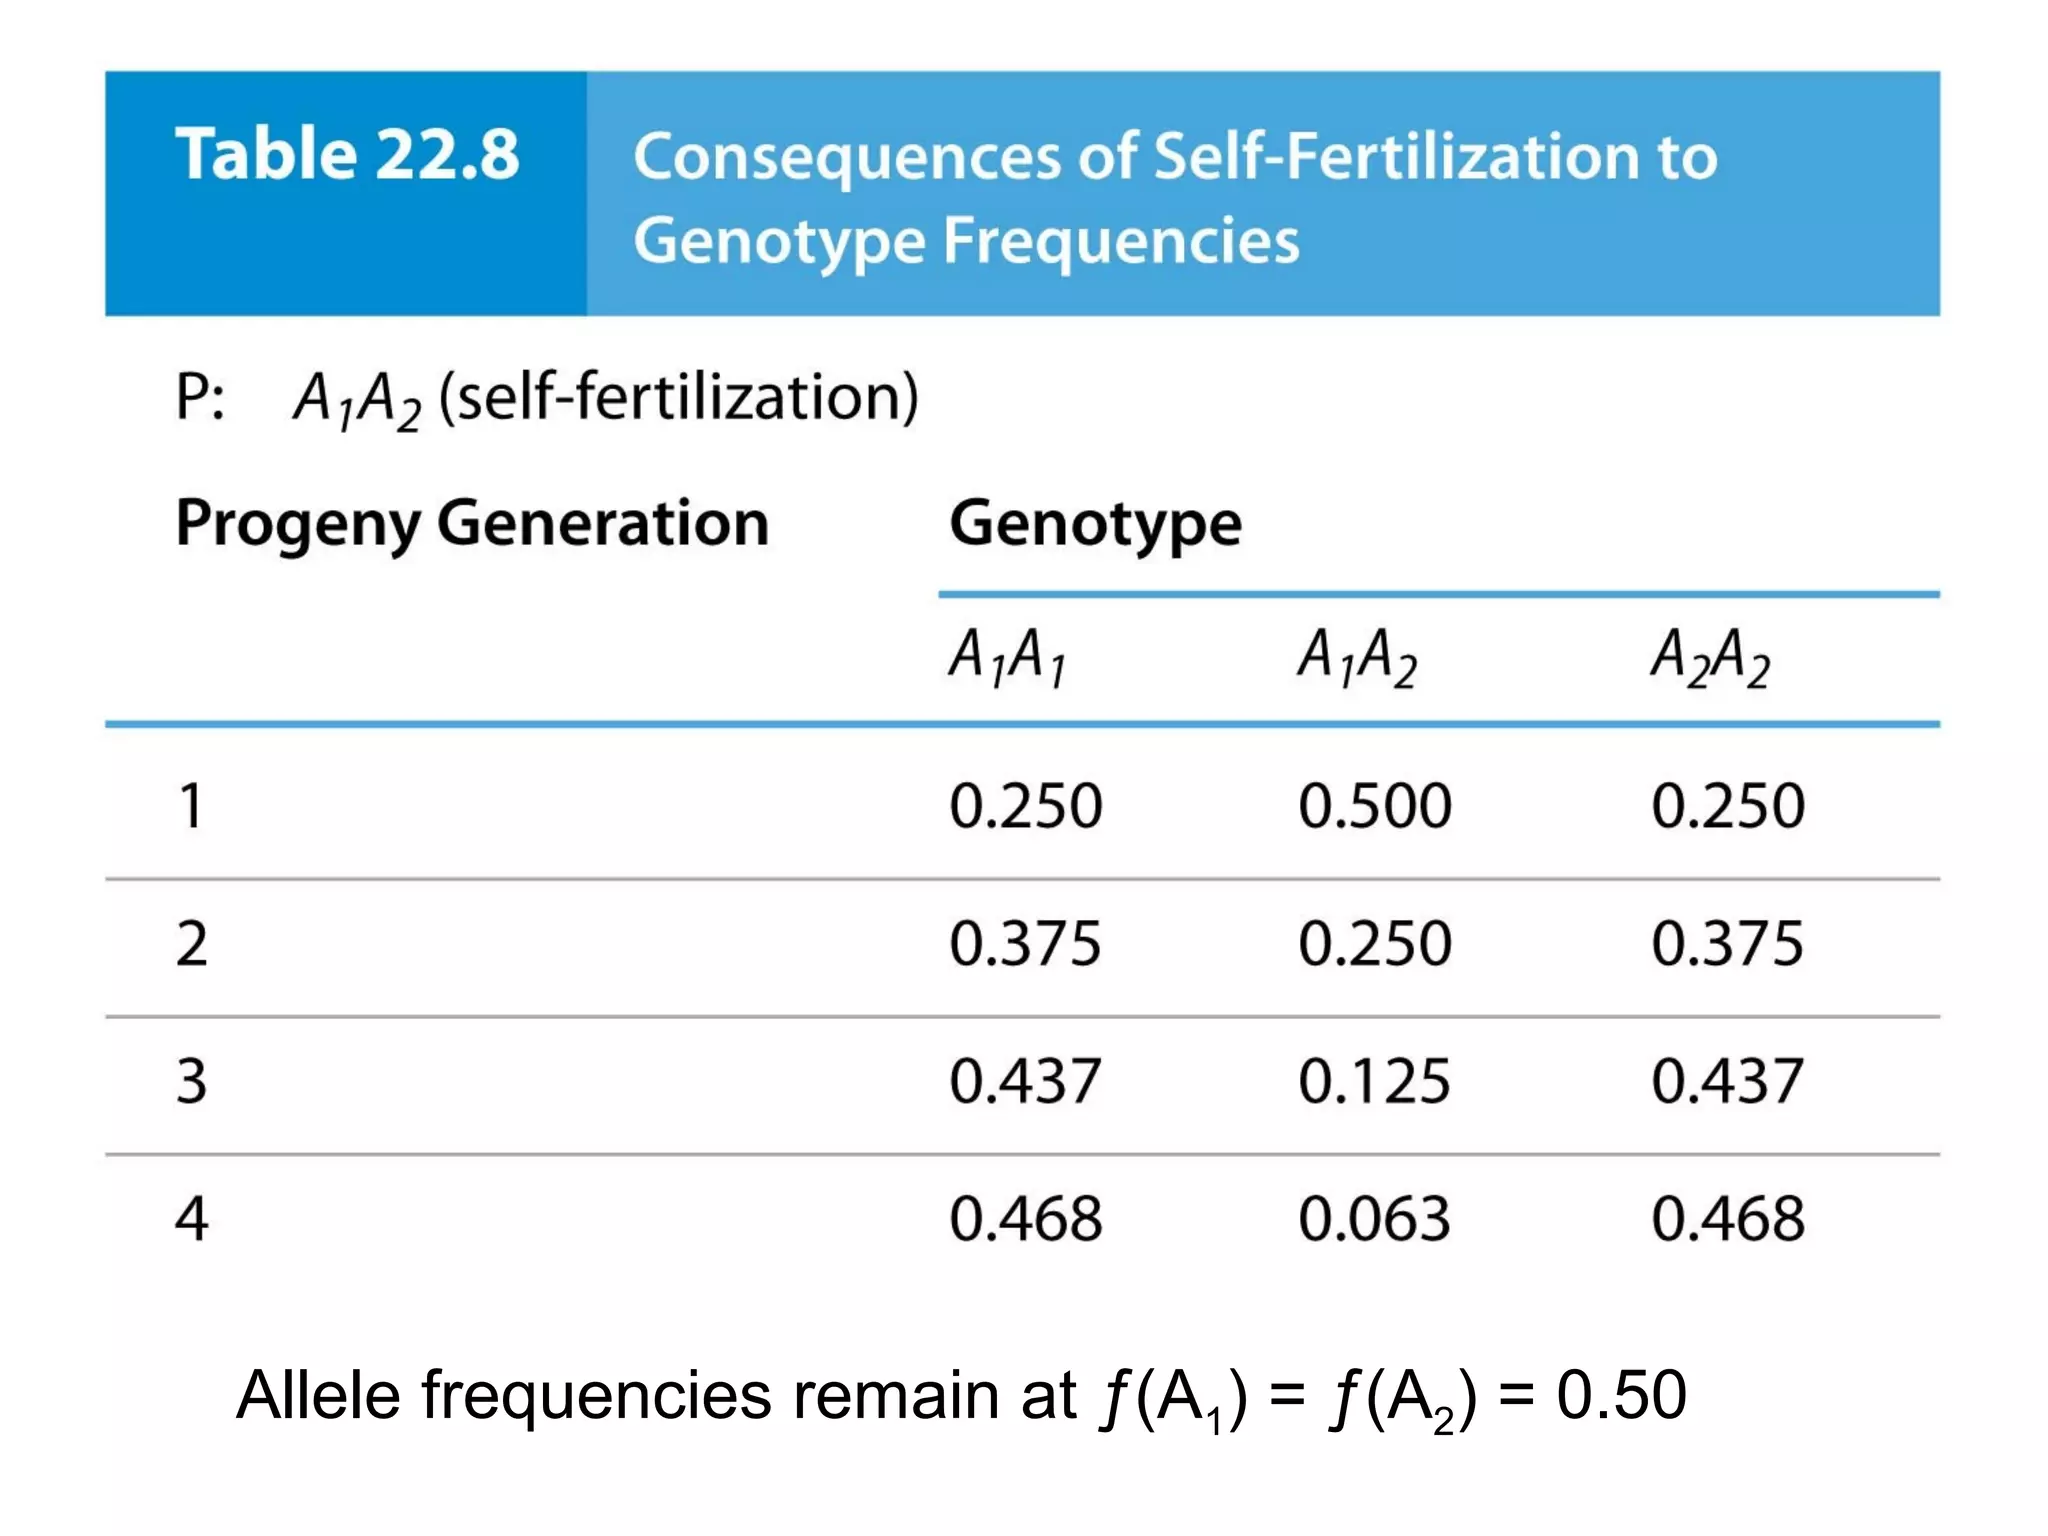
This document discusses population genetics and the Hardy-Weinberg equilibrium. It begins by defining key terms like population, gene pool, and alleles. It then explains the Hardy-Weinberg equilibrium, which describes the relationship between allele and genotype frequencies in a population with random mating and no evolutionary forces. The document provides examples of how to calculate genotype and allele frequencies and discusses factors that can disrupt Hardy-Weinberg equilibrium like natural selection, migration, genetic drift, and nonrandom mating.


![40
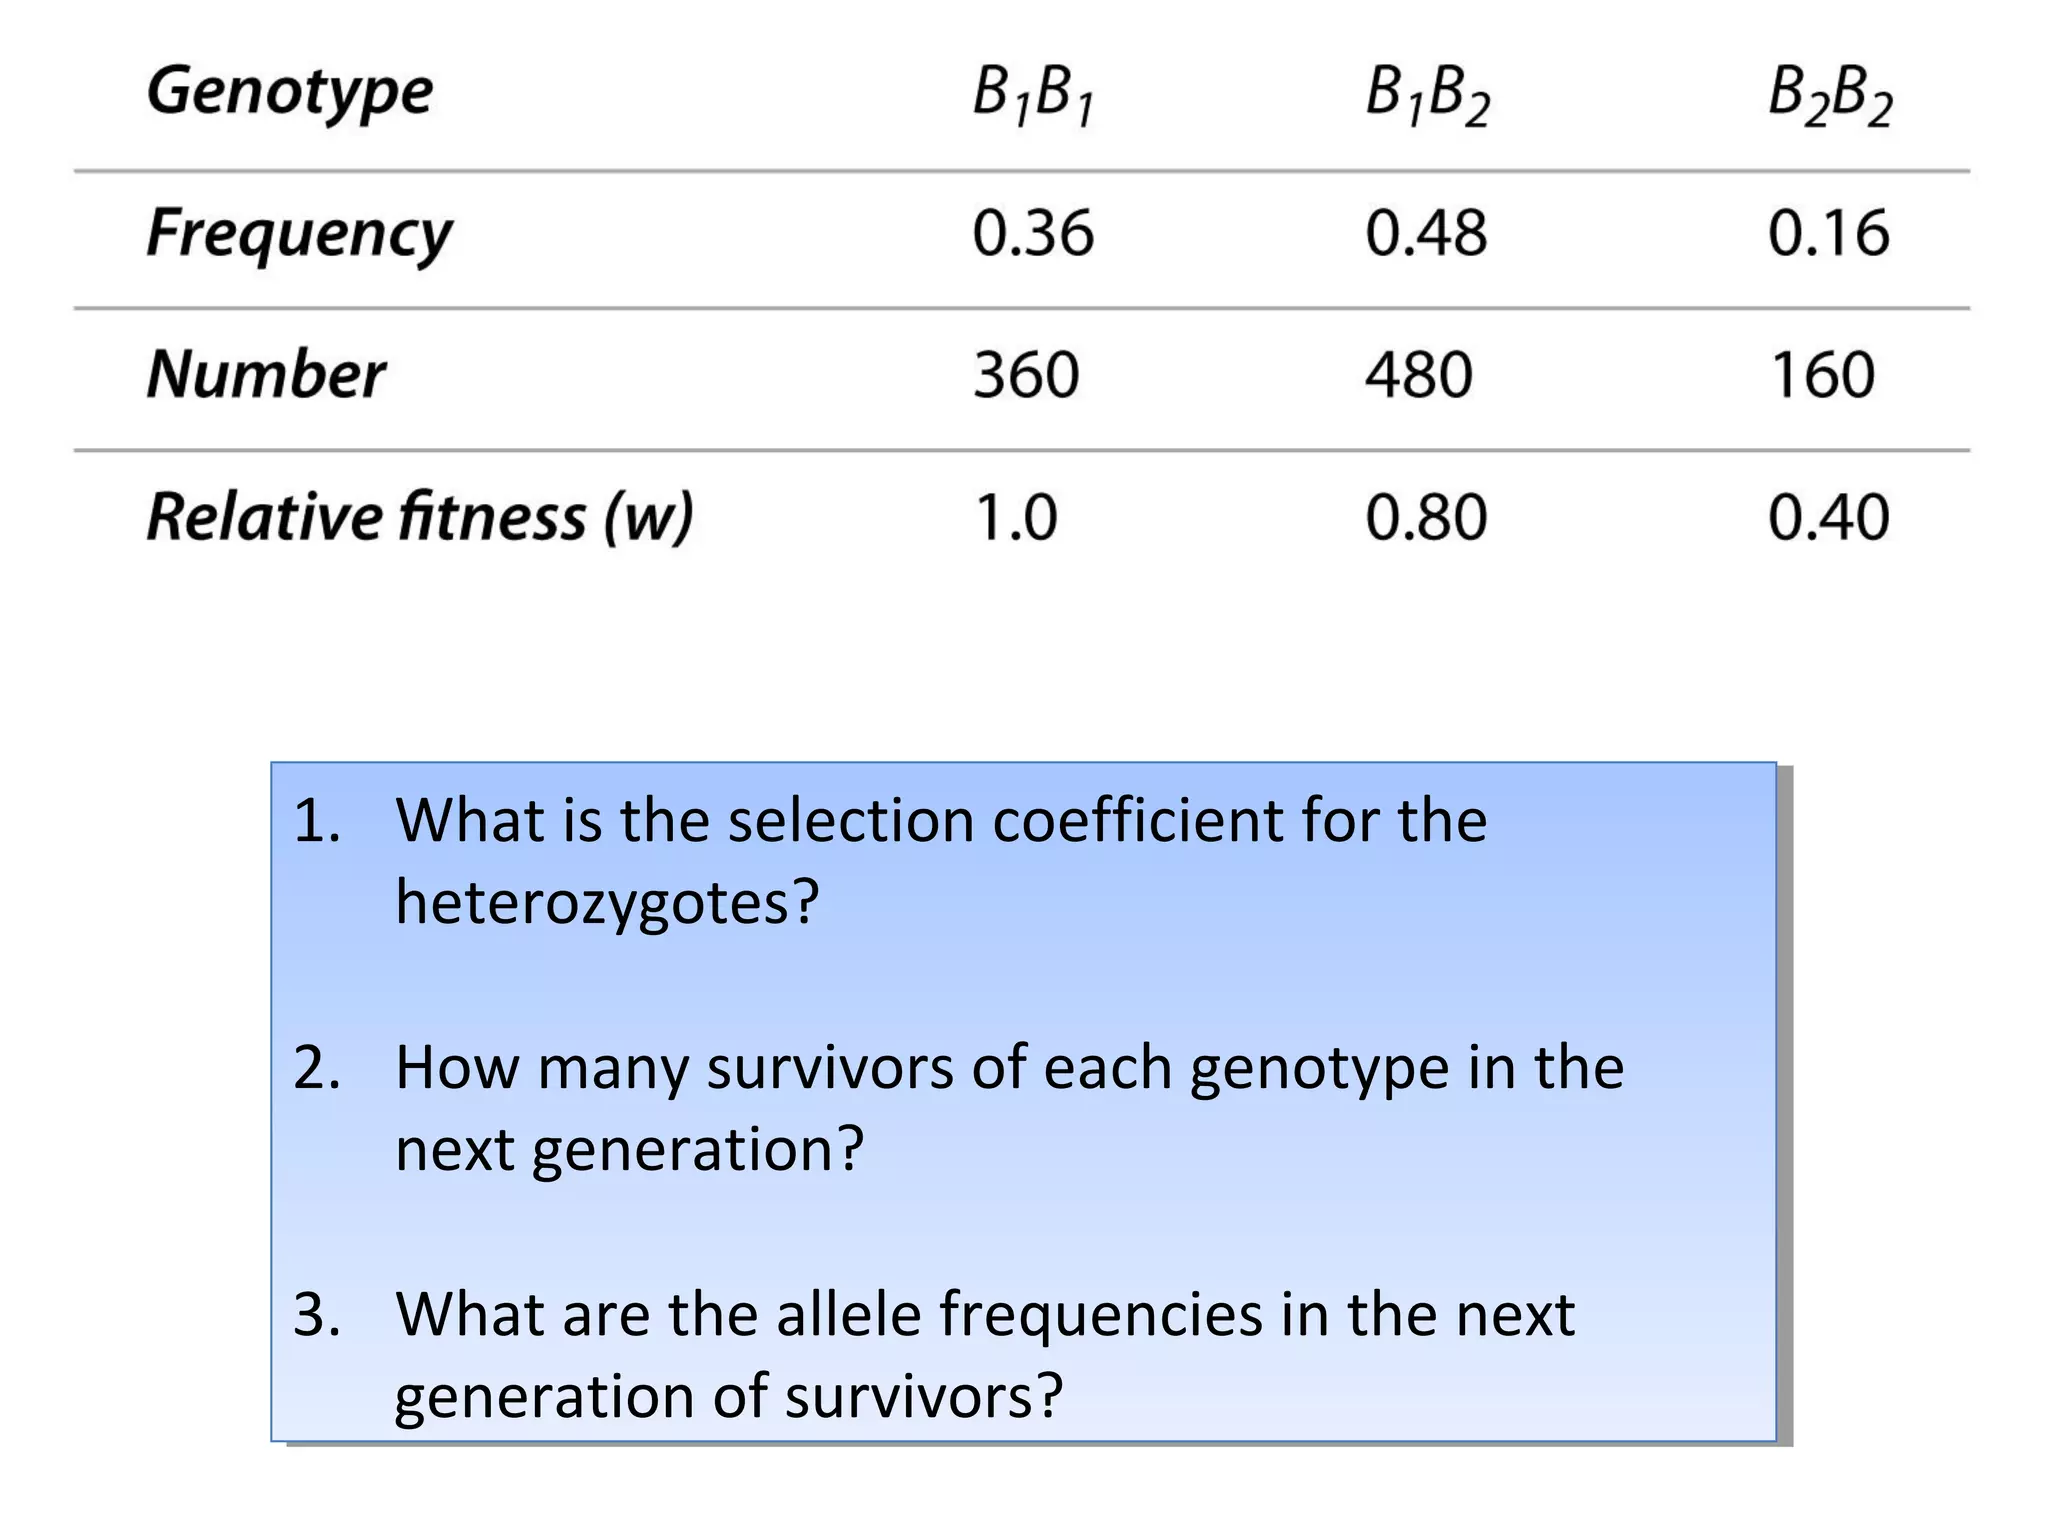
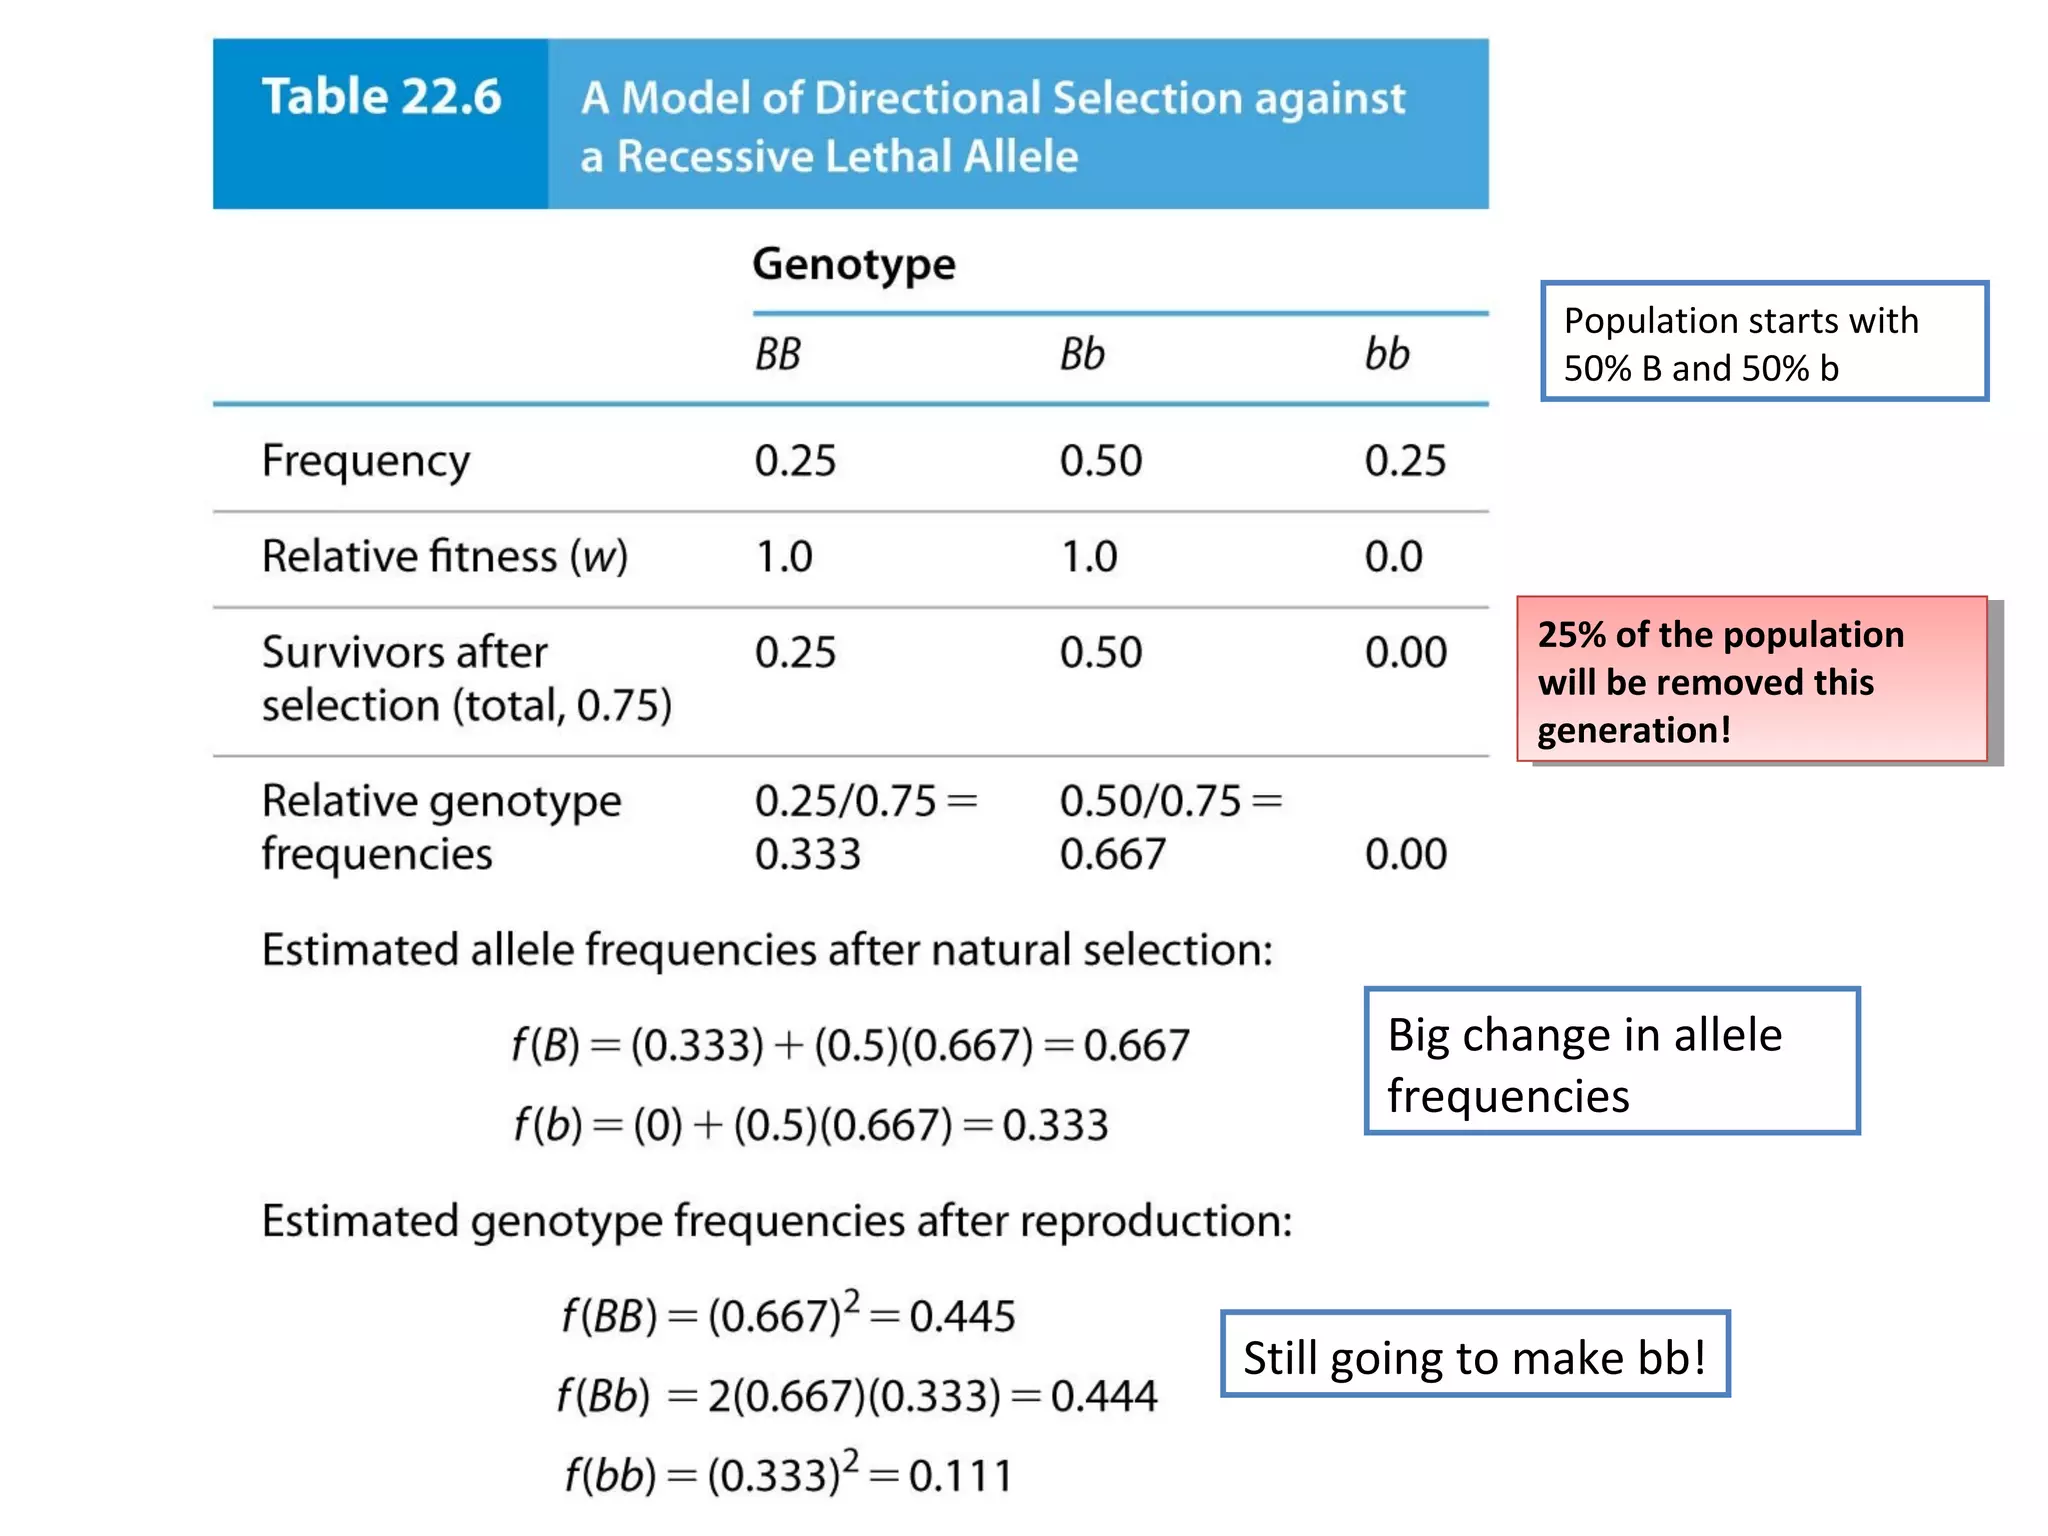
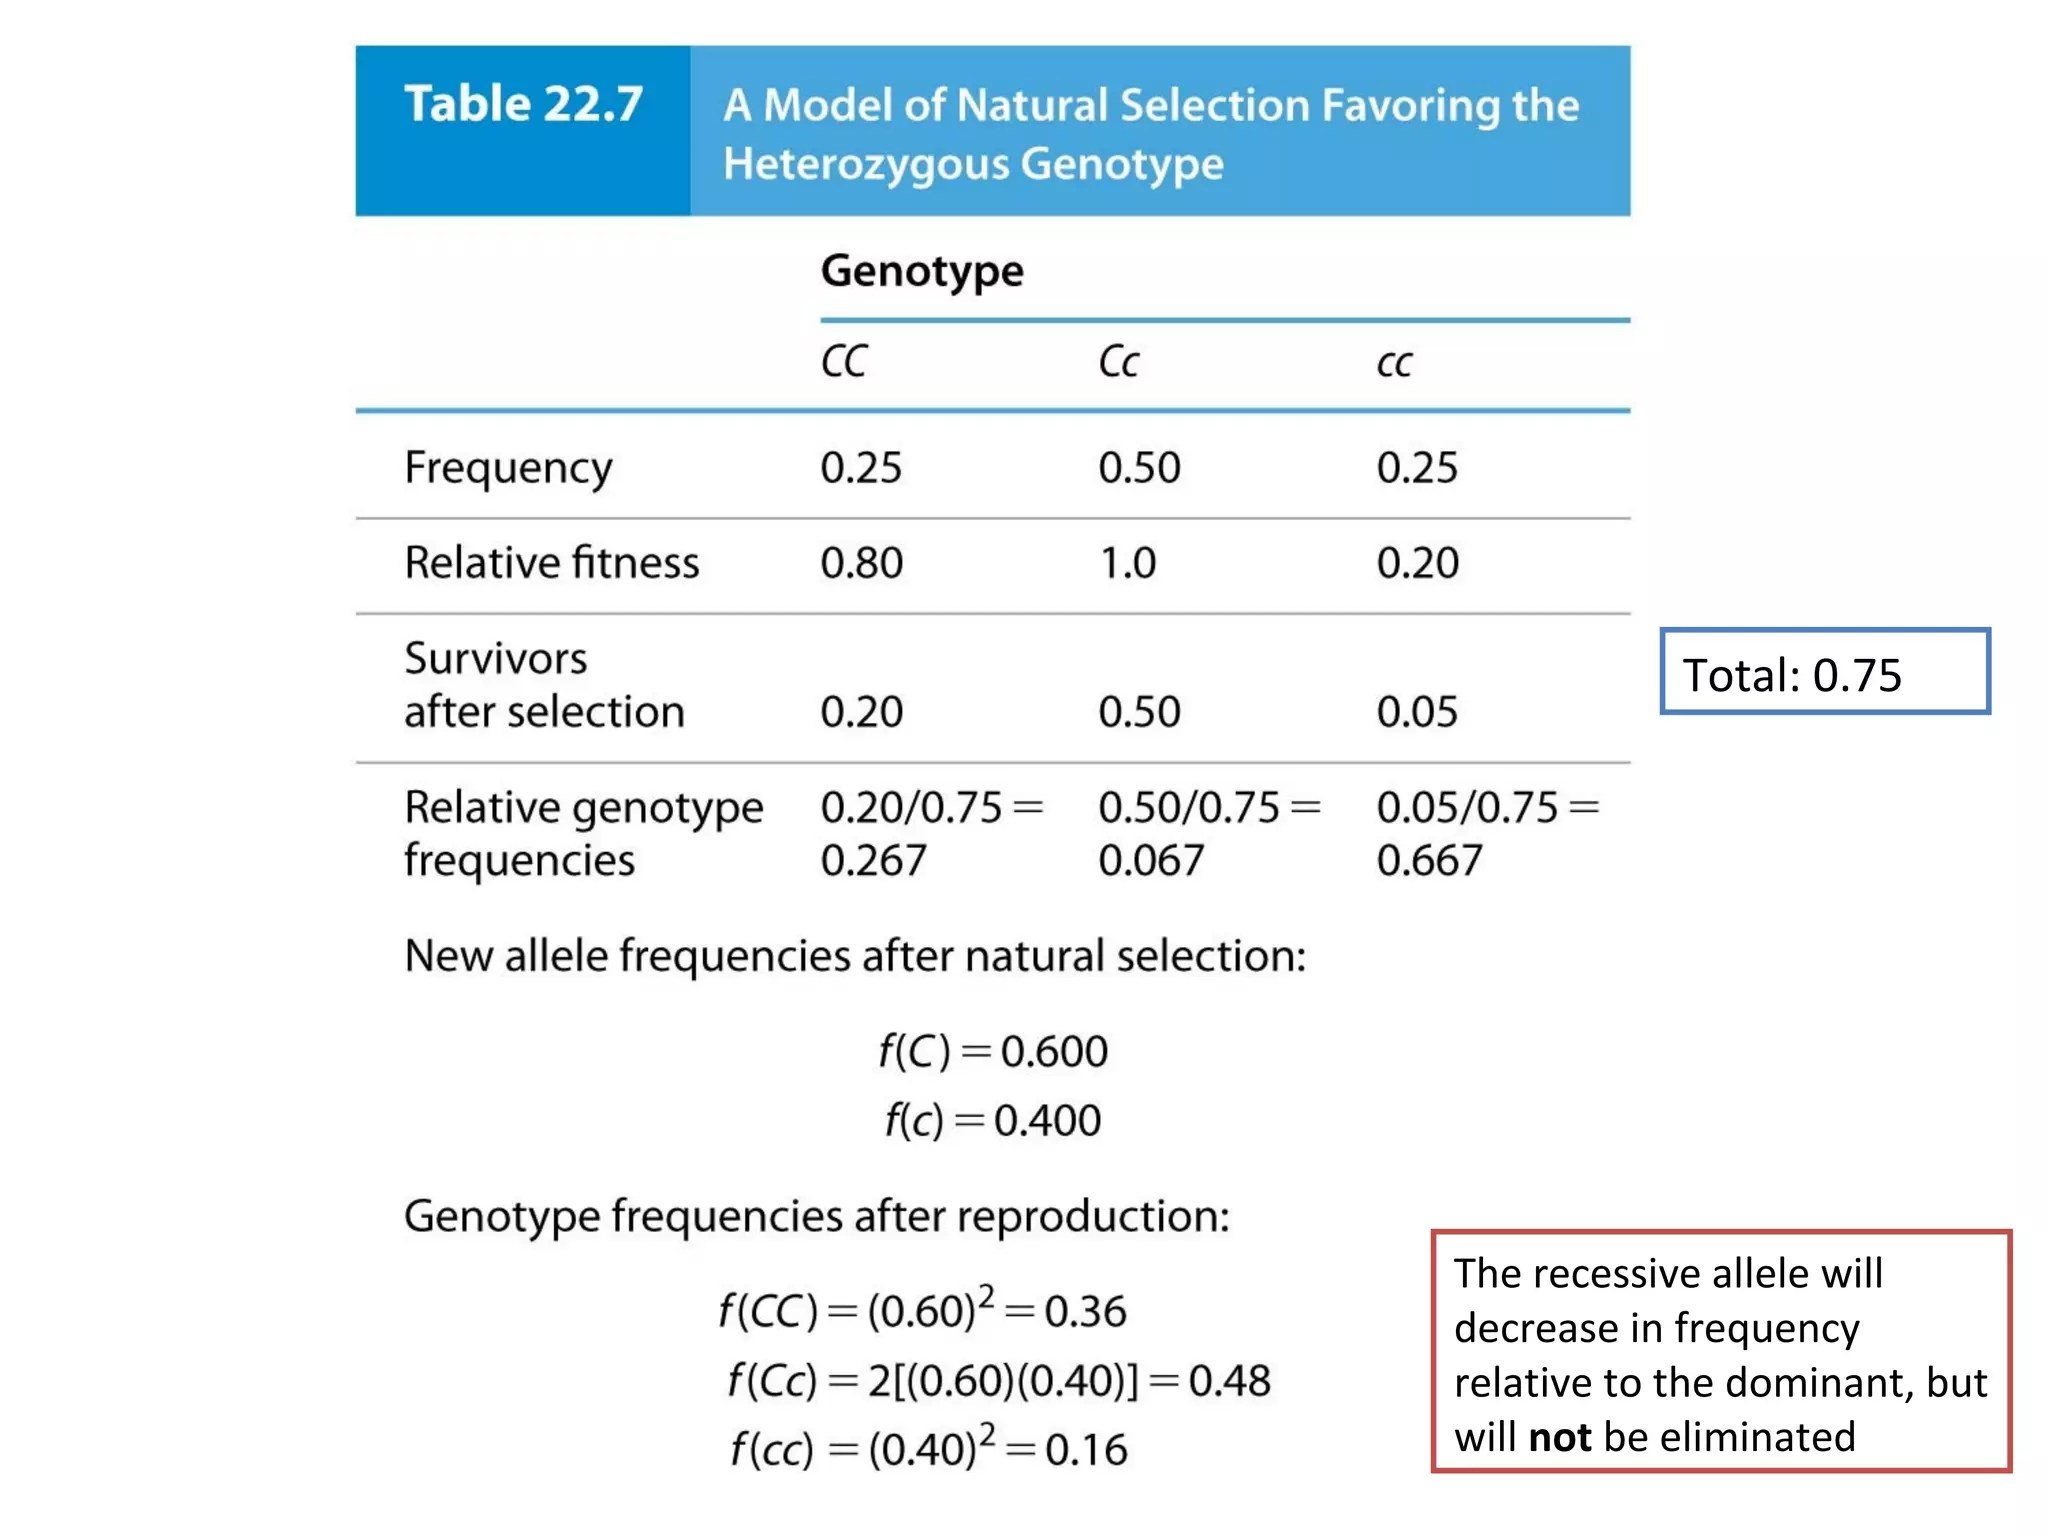
1. Survivors of each genotype:
B1B1 = (1.0)(360) = 360
B1B2 = (0.80)(480) = 384
B2B2 = (0.40)(160) = 64
2. Allele frequencies next generation:
f(B1) = [(2)(360) + (384)]/1616 = 0.683
f(B2) = [(2)(64) + (384)]/1616 = 0.317
808 of the original
1,000 organisms
remain after
natural selection!
808 of the original
1,000 organisms
remain after
natural selection!](https://image.slidesharecdn.com/geneticschapter22-140409154810-phpapp01/75/Genetics-chapter-22-40-2048.jpg)


![Biology 16 2 evolution as genetic change[1]](https://cdn.slidesharecdn.com/ss_thumbnails/biology16-2evolutionasgeneticchange1-110817154216-phpapp02-thumbnail.jpg?width=640&height=640&fit=bounds)


