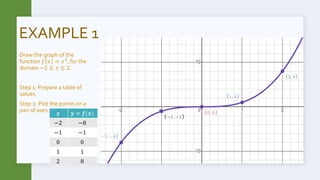
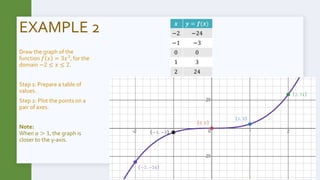
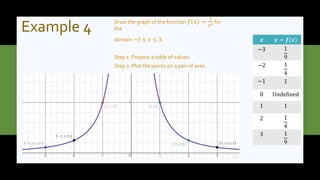
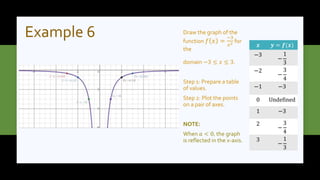
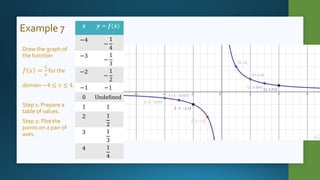
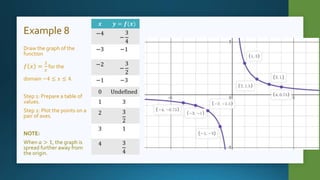
This document discusses non-linear functions of the form y=ax^n, where a is a constant and n is -1, -2, or 3. It provides examples of drawing graphs of cubic, square, and inverse functions by preparing tables of values and plotting points. The key effects of changing the constant a are noted - when a>1, the graph is spread further from the origin for squares and cubes or closer to the y-axis for cubes; when a<0, the graph is reflected across the x-axis for squares or y-axis for cubes and inverses. Step-by-step worked examples are given to illustrate graphing these types of functions.