Download to read offline
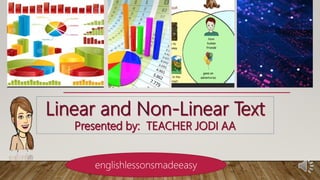
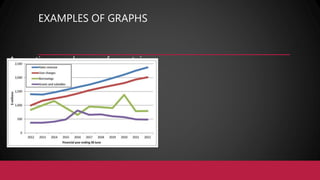
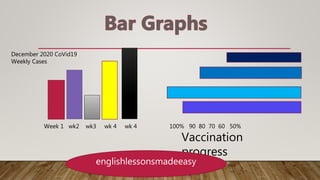
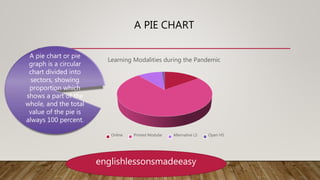
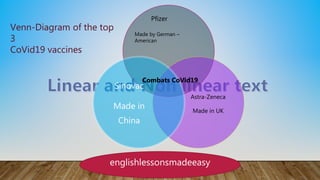
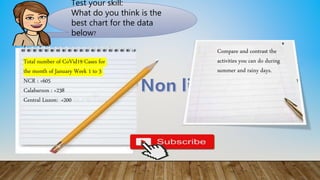
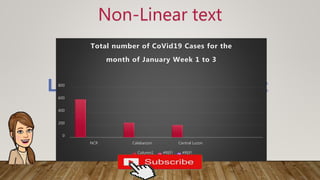
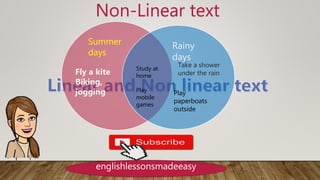

This document discusses linear and non-linear texts. Linear texts like poems and novels are understood through reading words in order. Non-linear texts use graphs, charts or maps to interpret information in a text. Examples given include line graphs to show changes over time, pie charts to divide parts of a whole, and Venn diagrams to compare items. The document tests recognizing bar graphs as best for comparing COVID-19 case numbers by location. It also provides a two-column chart to compare activities during summer versus rainy days in a non-linear format.


![Recognizing-Positive-and-Negative-Messages [Autosaved].pptx](https://cdn.slidesharecdn.com/ss_thumbnails/recognizing-positive-and-negative-messagesautosaved-230216020059-27a69639-thumbnail.jpg?width=640&height=640&fit=bounds)