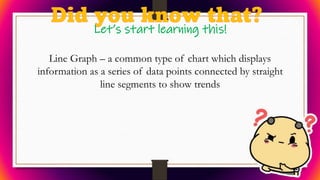
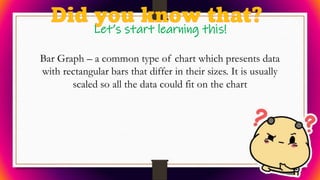
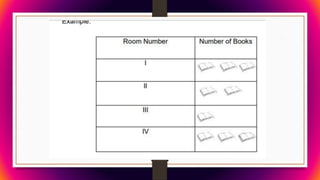
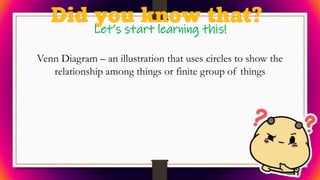
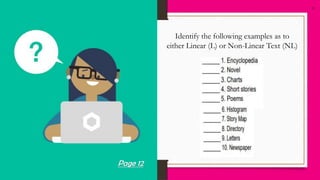
3
4
Objective/s
at the end of this lesson, you are expected to:
Transcode information from linear
to non-linear texts and vice-versa
(EN8RC-IIe-11)
Let’s start learning this!
• Linear text refers to traditional text
that needs to be read from beginning to
the end.
• Linear reading is the traditional mode of
reading we are all taught early on; reading
left to right, from start to finish.
Let’s start learning this!
Non-linear text is the opposite of linear text. As
its name suggests, it is nonlinear and non-
sequential. In other words, the readers do not have
to go through the text in a sequential manner in
order to make sense of the text. This type of text
has many reading paths since it’s the readers who
decide the sequence of reading, not the author of
the text.
The Graphic Organizers
Let’s have them one by one!
Let’s start learning this!
Line Graph – a common type of chart which displays
information as a series of data points connected by straight
line segments to show trends
Let’s start learning this!
Bar Graph – a common type of chart which presents data
with rectangular bars that differ in their sizes. It is usually
scaled so all the data could fit on the chart
Let’s start learning this!
Pie Graph – a circular chart which is divided into slices or
portions to illustrate proportion.
Let’s start learning this!
Pictograph – a chart that uses pictorial symbols to convey the
meaning of statistical information.
Let’s start learning this!
Venn Diagram – an illustration that uses circles to show the
relationship among things or finite group of things
Let’s start learning this!
Concept Diagram – a diagram that represents ideas and
information as boxes and circle and uses lines to show the
relationship between them.
20
21
Identify the following examples as to
either Linear (L) or Non-Linear Text (NL)
Page 12
22
B.1 Interpret the bar graph
and answer the guide
questions that follow.
Encircle the letter of your
answer
Page 13
23
24
B.2 Analyze the pie chart below, then
transcode its information to a linear text.
Follow the guide questions in constructing
your linear text and write it in paragraph
form.
Page 13
25
26
C. Read the selection below,
then transcode its information
to a non-linear text by creating
a story map
Page 13
27

LECTURES AND OTHER LEARNING MATERIALS NEEDED

  • 3.
  • 4.
    4 Objective/s at the endof this lesson, you are expected to: Transcode information from linear to non-linear texts and vice-versa (EN8RC-IIe-11)
  • 5.
    Let’s start learningthis! • Linear text refers to traditional text that needs to be read from beginning to the end. • Linear reading is the traditional mode of reading we are all taught early on; reading left to right, from start to finish.
  • 6.
    Let’s start learningthis! Non-linear text is the opposite of linear text. As its name suggests, it is nonlinear and non- sequential. In other words, the readers do not have to go through the text in a sequential manner in order to make sense of the text. This type of text has many reading paths since it’s the readers who decide the sequence of reading, not the author of the text.
  • 7.
    The Graphic Organizers Let’shave them one by one!
  • 9.
    Let’s start learningthis! Line Graph – a common type of chart which displays information as a series of data points connected by straight line segments to show trends
  • 11.
    Let’s start learningthis! Bar Graph – a common type of chart which presents data with rectangular bars that differ in their sizes. It is usually scaled so all the data could fit on the chart
  • 13.
    Let’s start learningthis! Pie Graph – a circular chart which is divided into slices or portions to illustrate proportion.
  • 15.
    Let’s start learningthis! Pictograph – a chart that uses pictorial symbols to convey the meaning of statistical information.
  • 17.
    Let’s start learningthis! Venn Diagram – an illustration that uses circles to show the relationship among things or finite group of things
  • 19.
    Let’s start learningthis! Concept Diagram – a diagram that represents ideas and information as boxes and circle and uses lines to show the relationship between them.
  • 20.
  • 21.
    21 Identify the followingexamples as to either Linear (L) or Non-Linear Text (NL) Page 12
  • 22.
    22 B.1 Interpret thebar graph and answer the guide questions that follow. Encircle the letter of your answer Page 13
  • 23.
  • 24.
    24 B.2 Analyze thepie chart below, then transcode its information to a linear text. Follow the guide questions in constructing your linear text and write it in paragraph form. Page 13
  • 25.
  • 26.
    26 C. Read theselection below, then transcode its information to a non-linear text by creating a story map Page 13
  • 27.