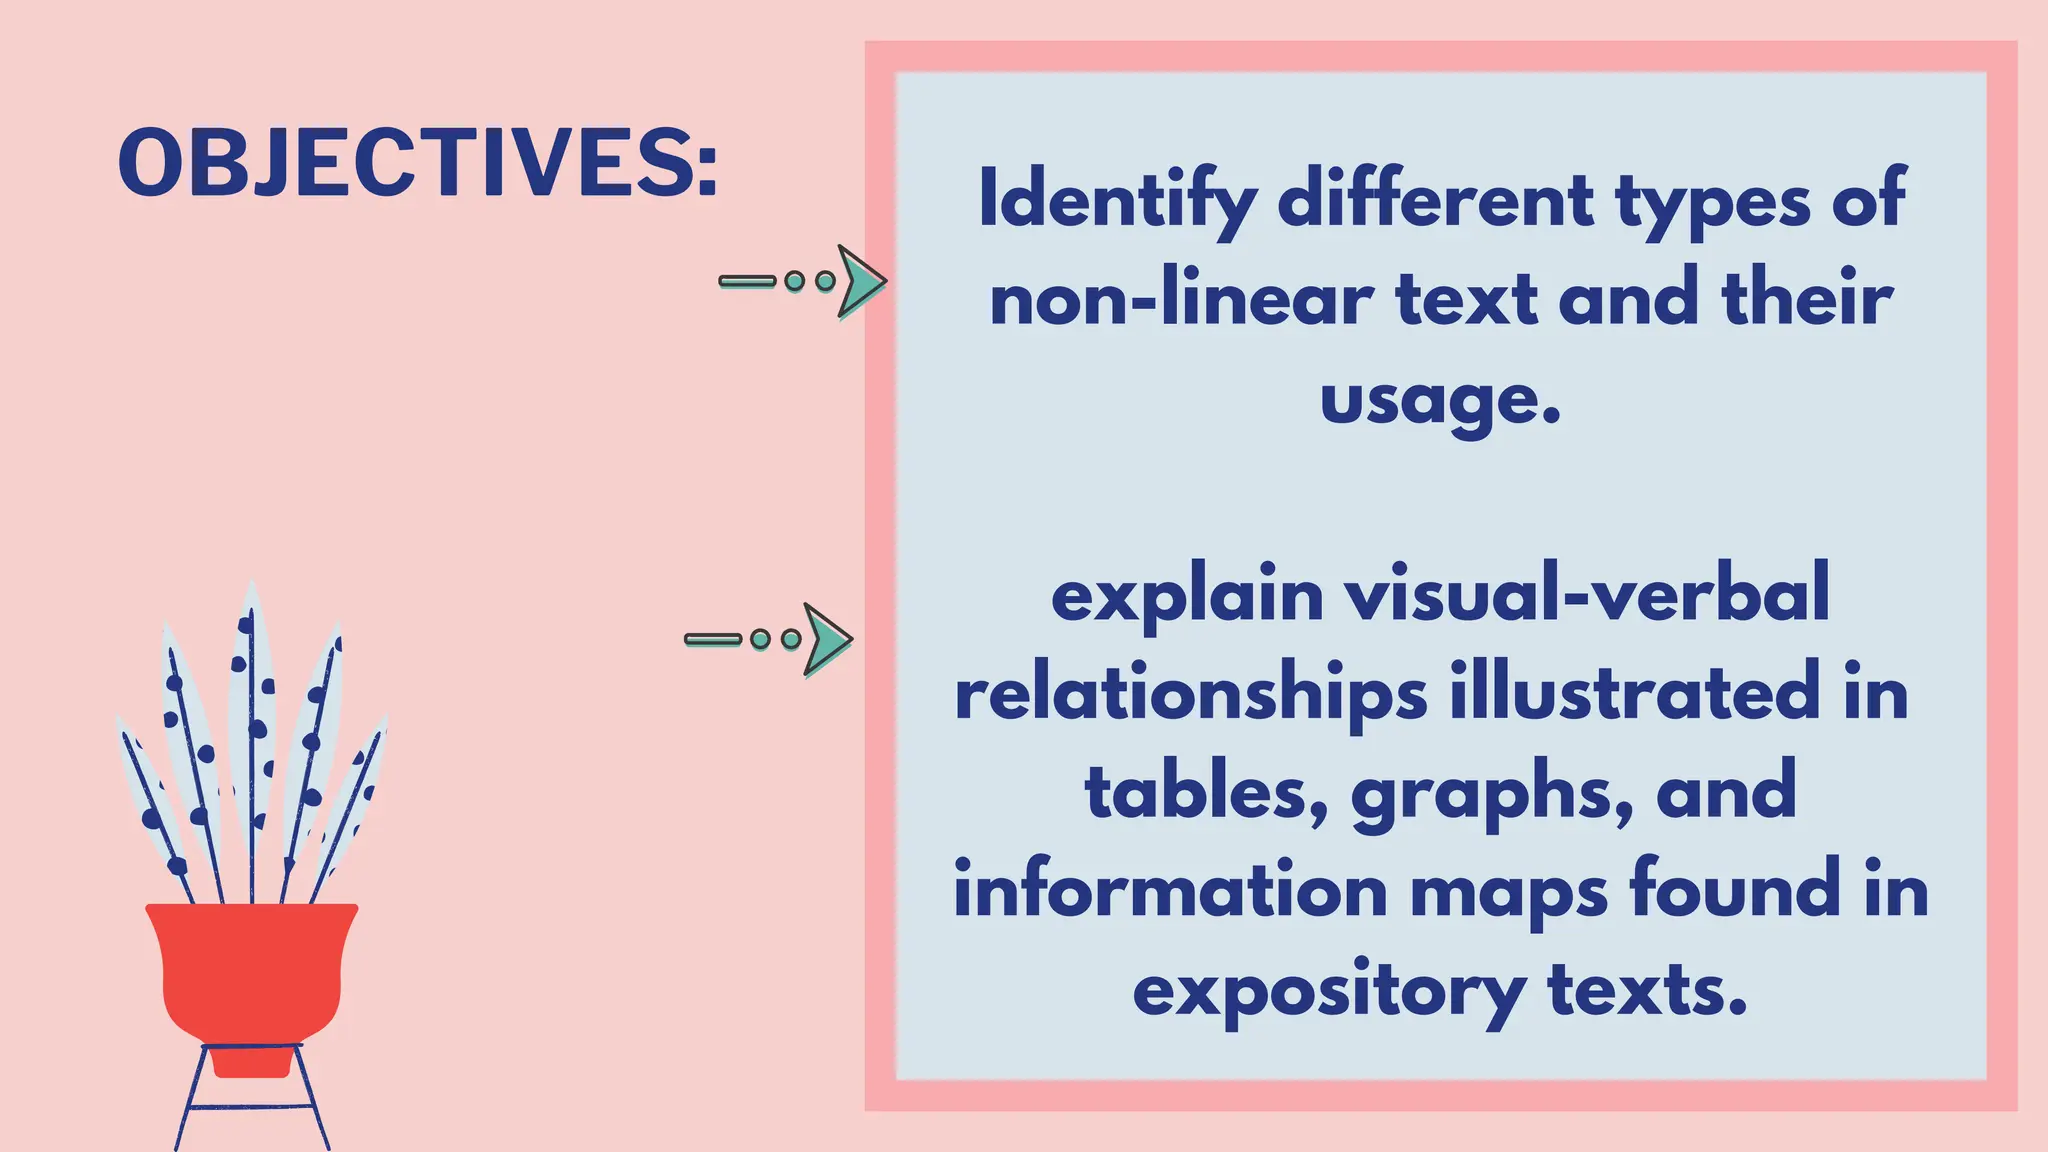
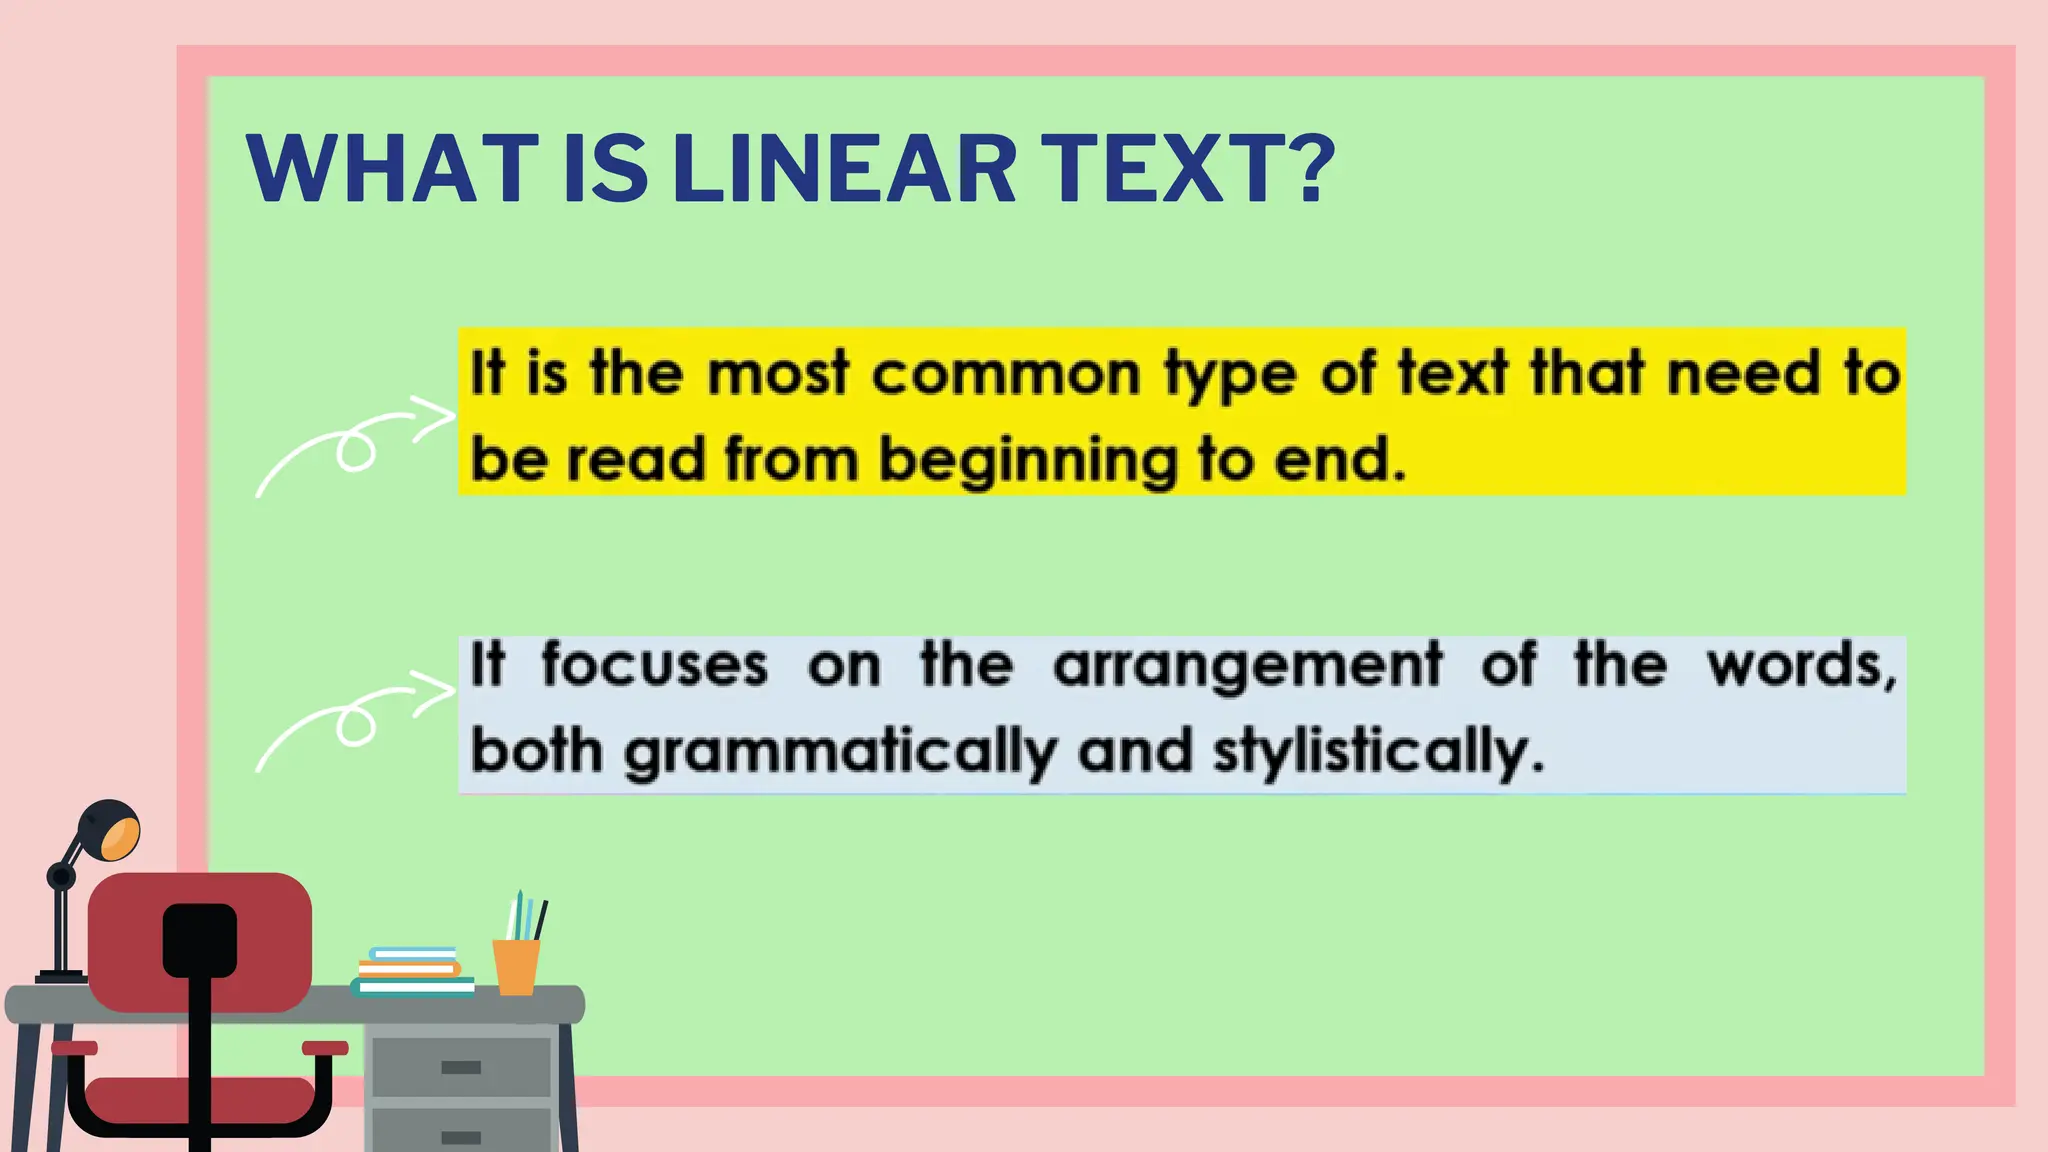
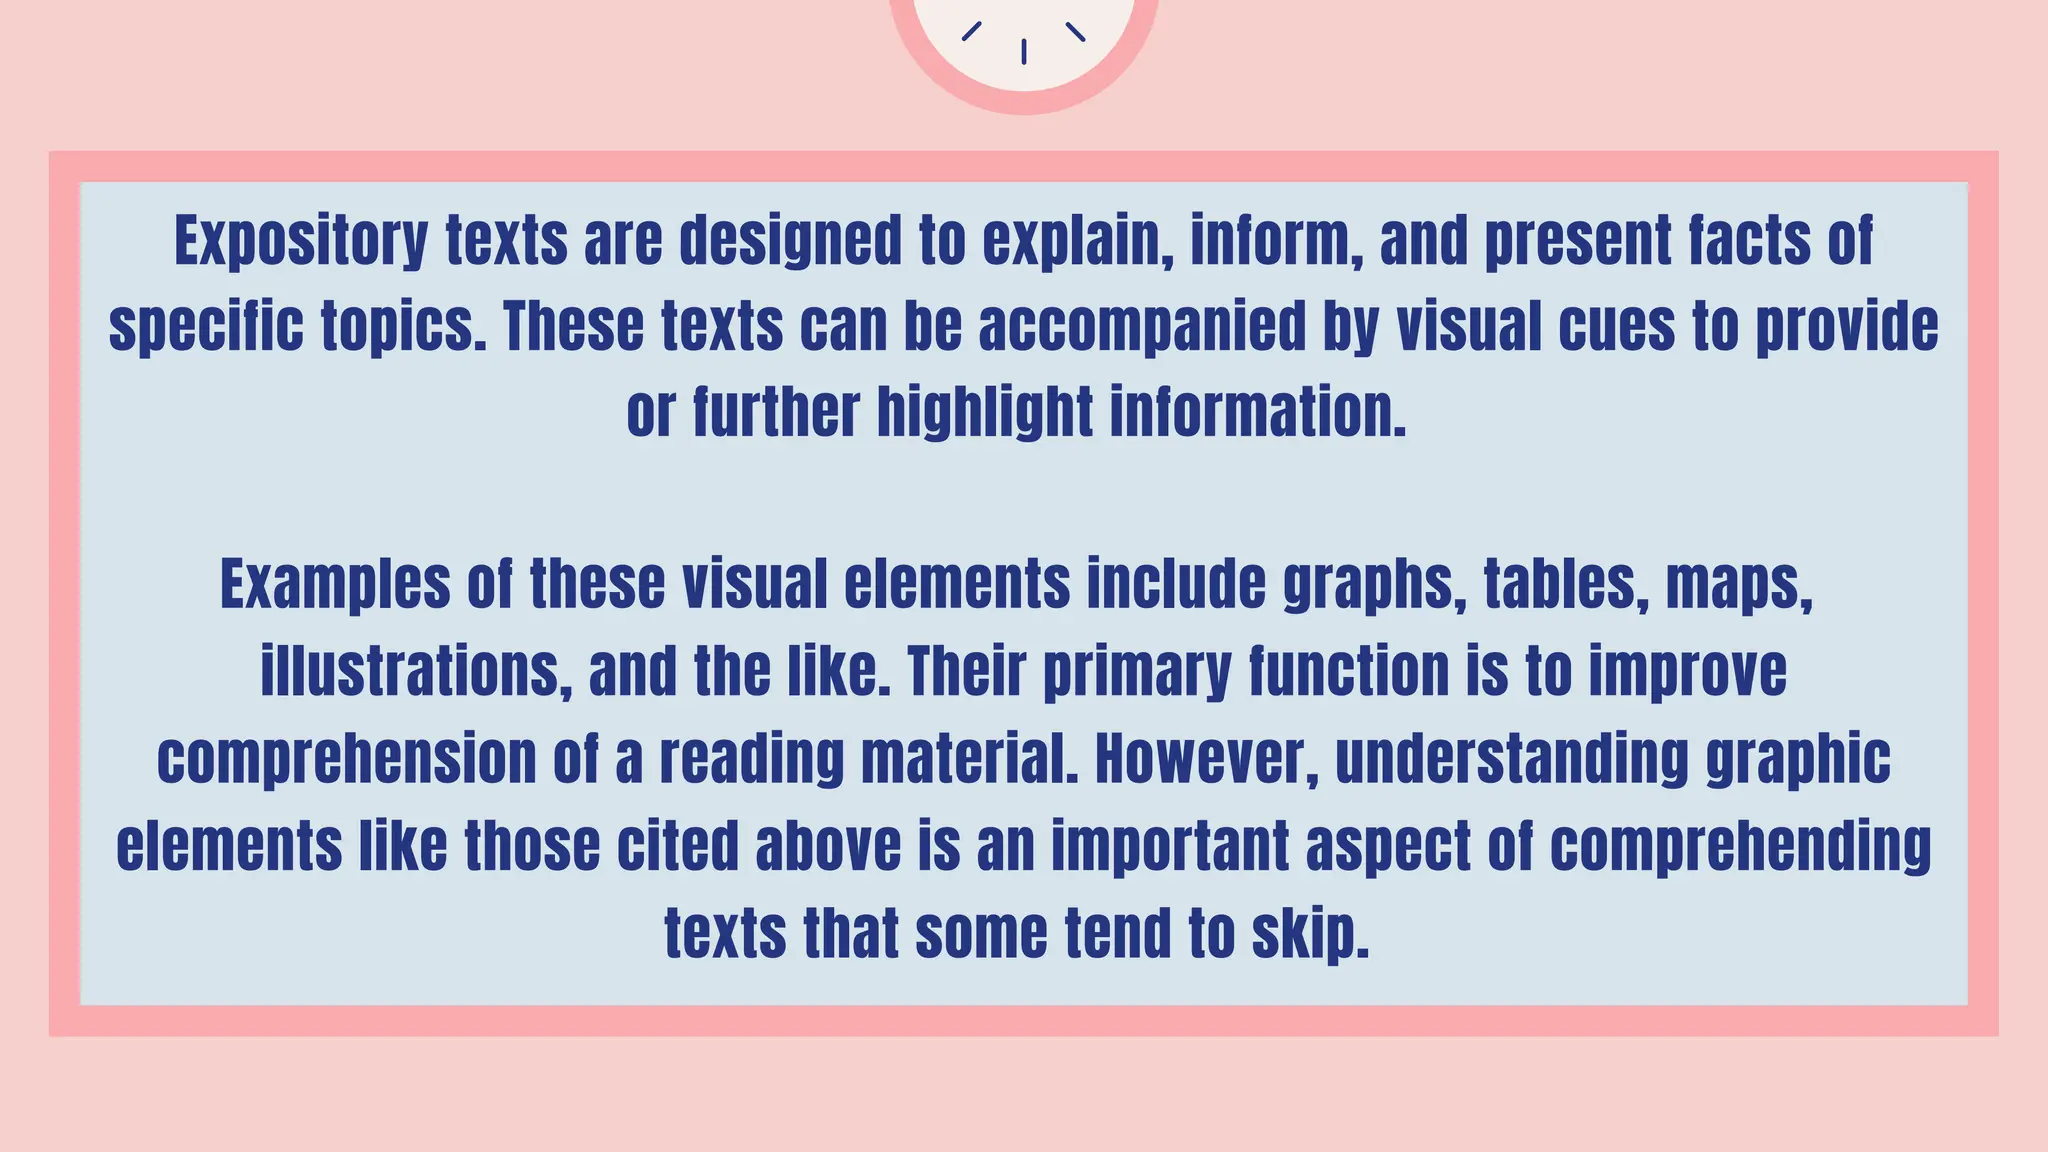
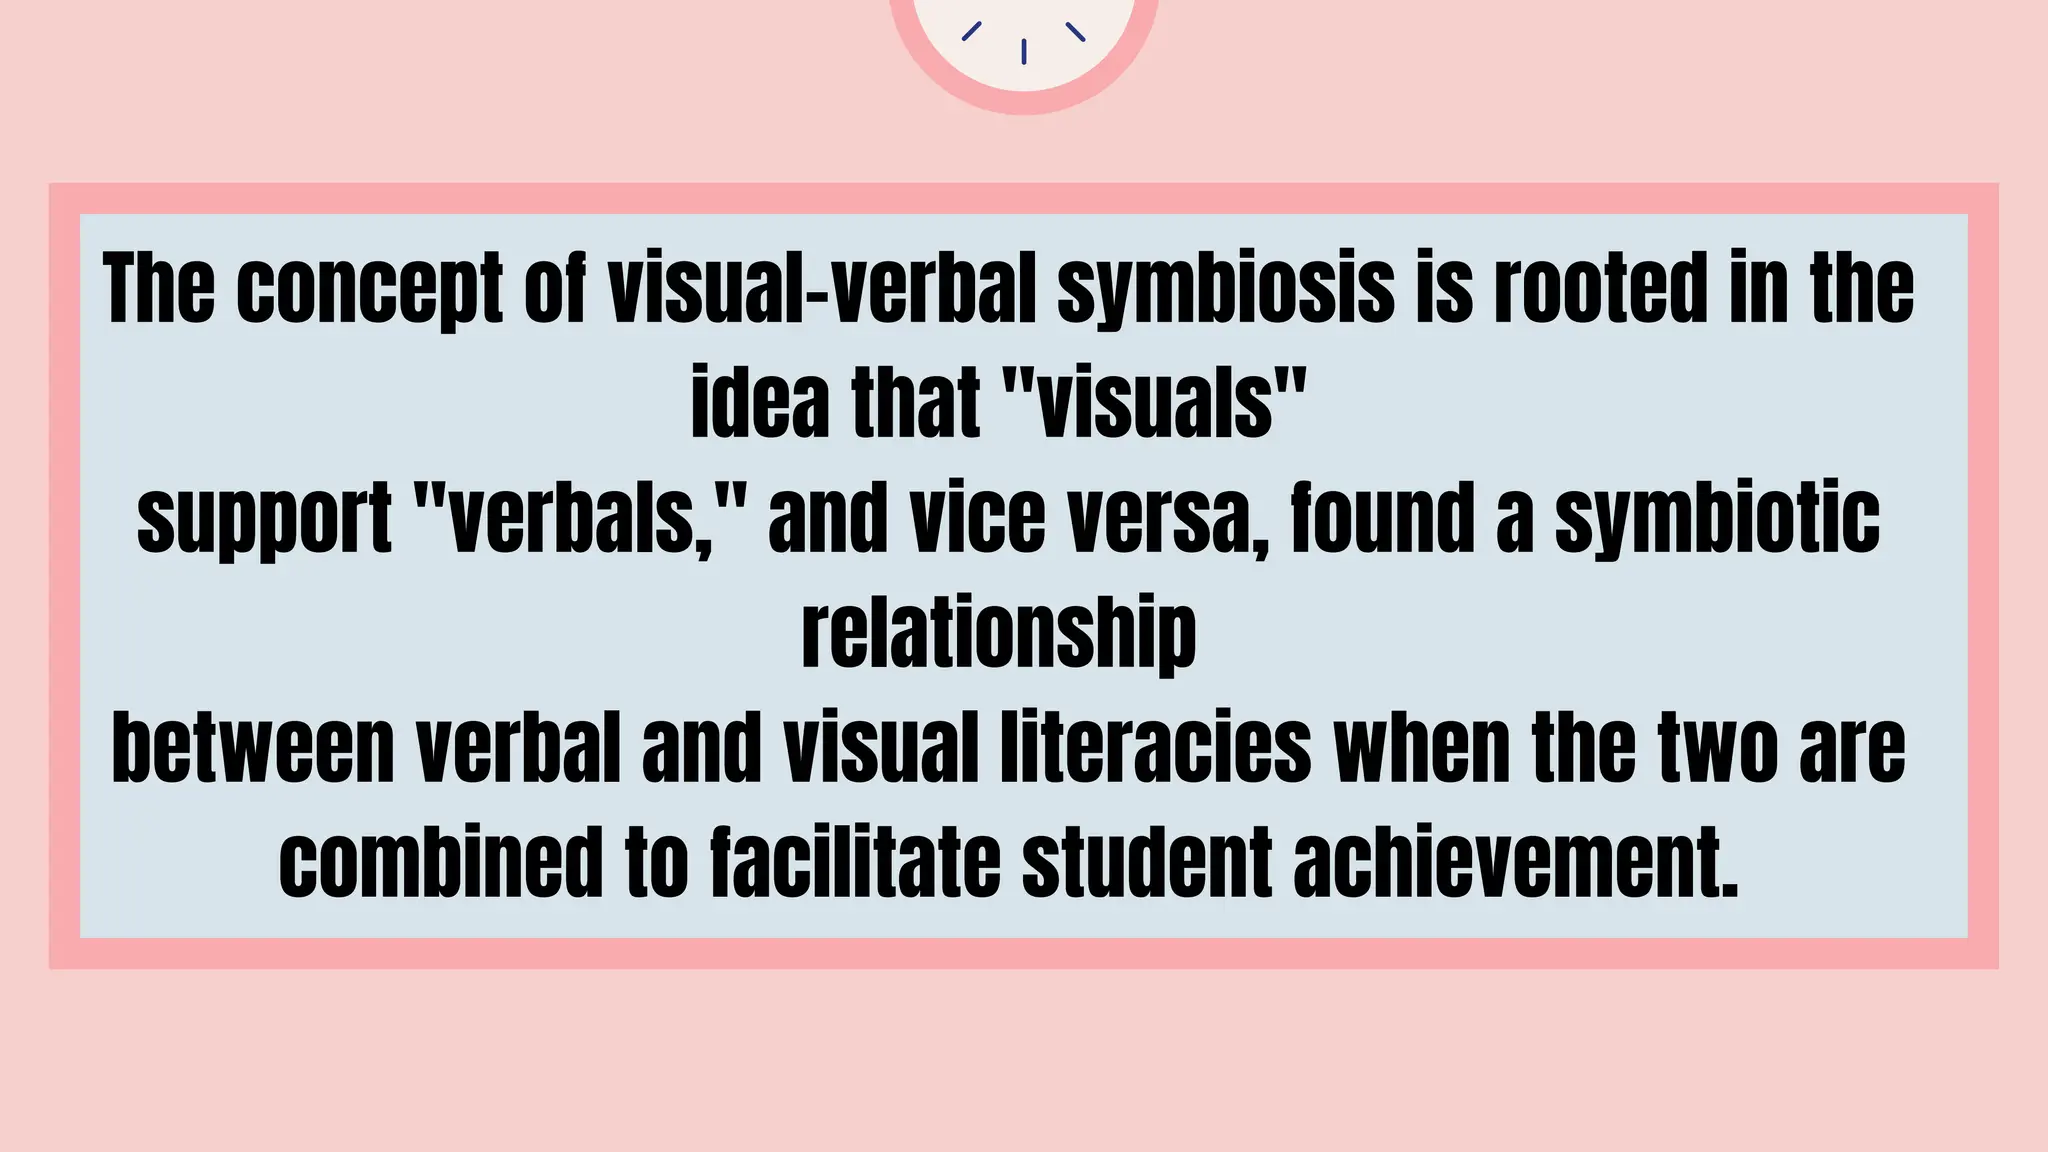
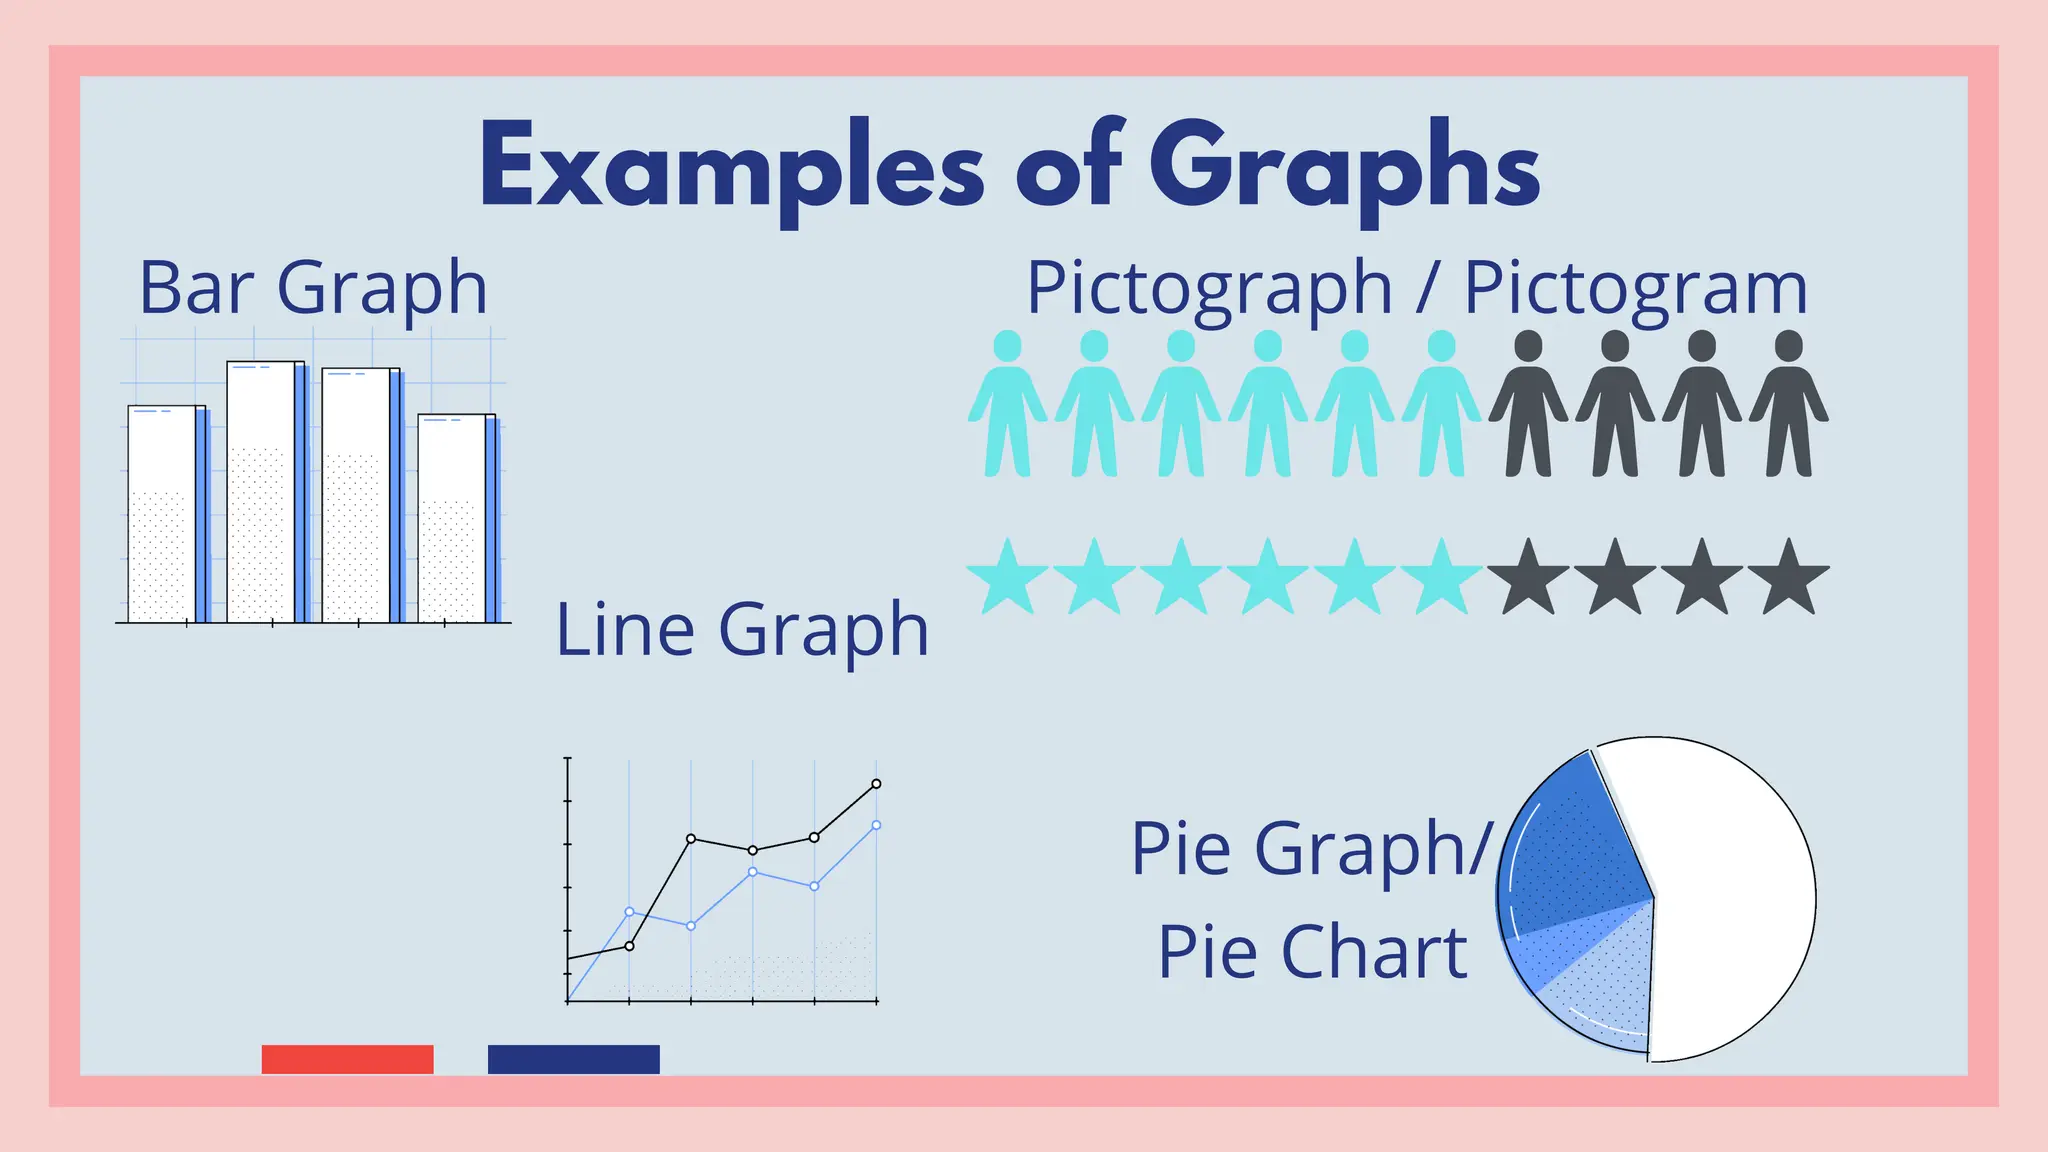
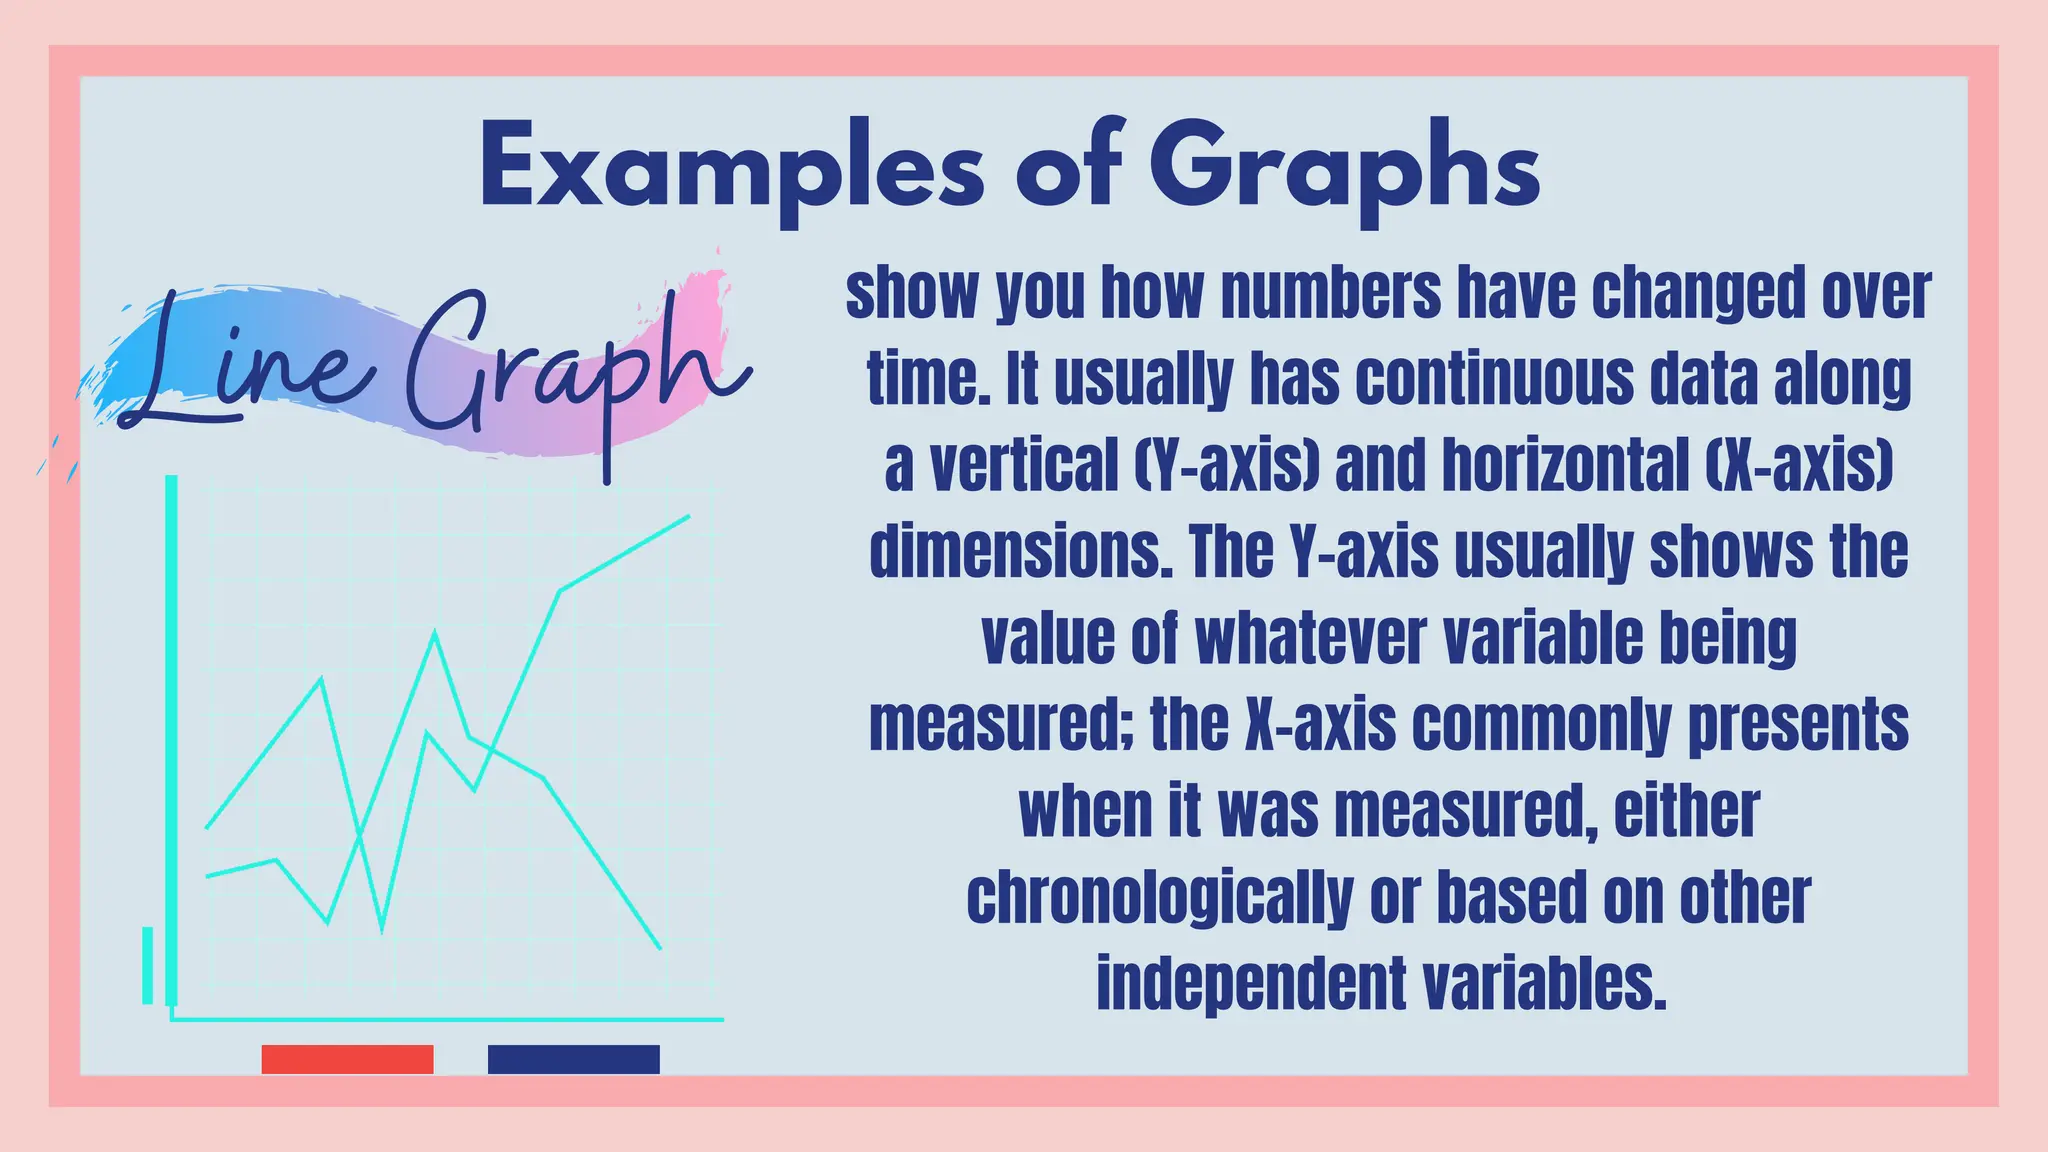
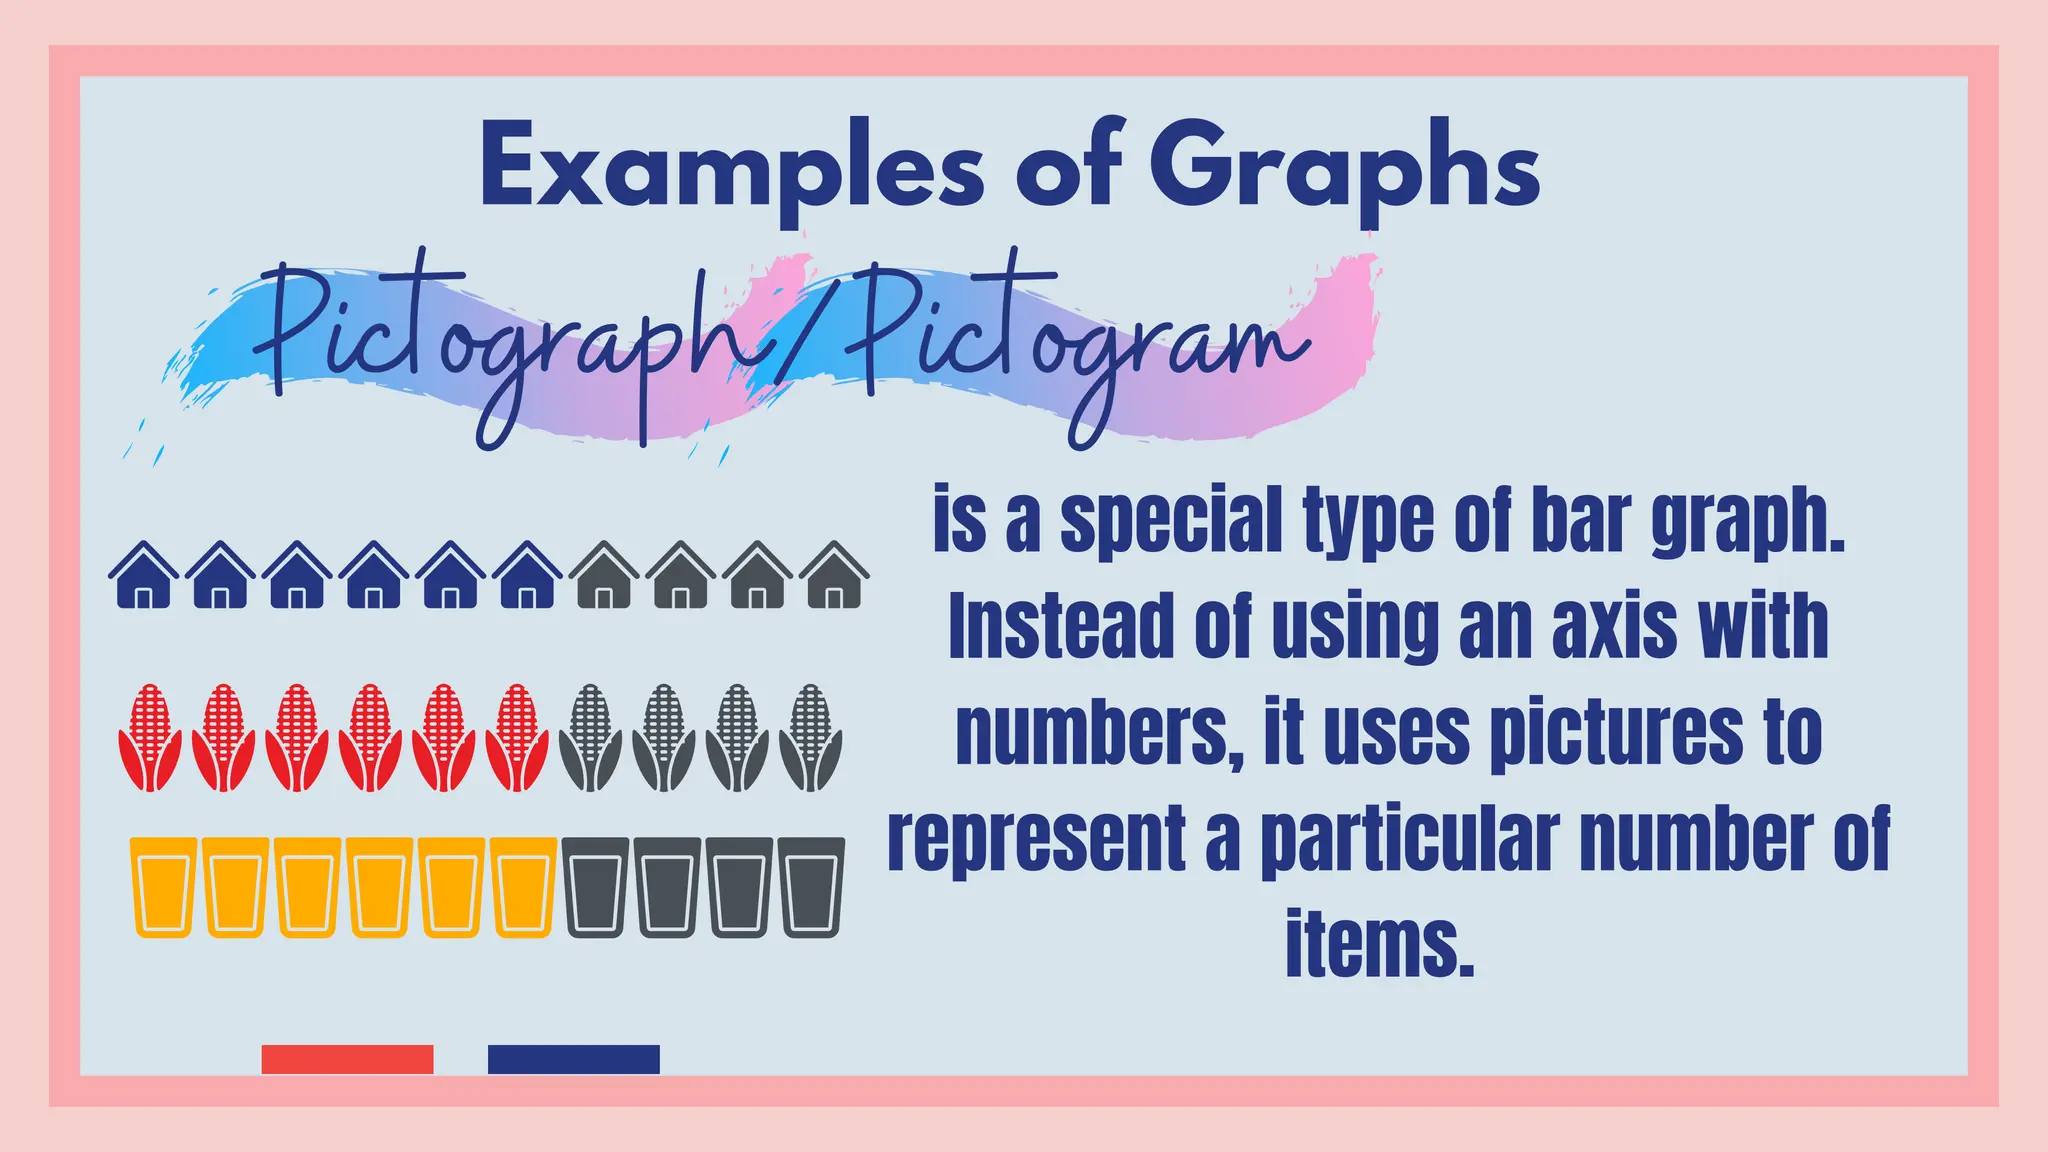
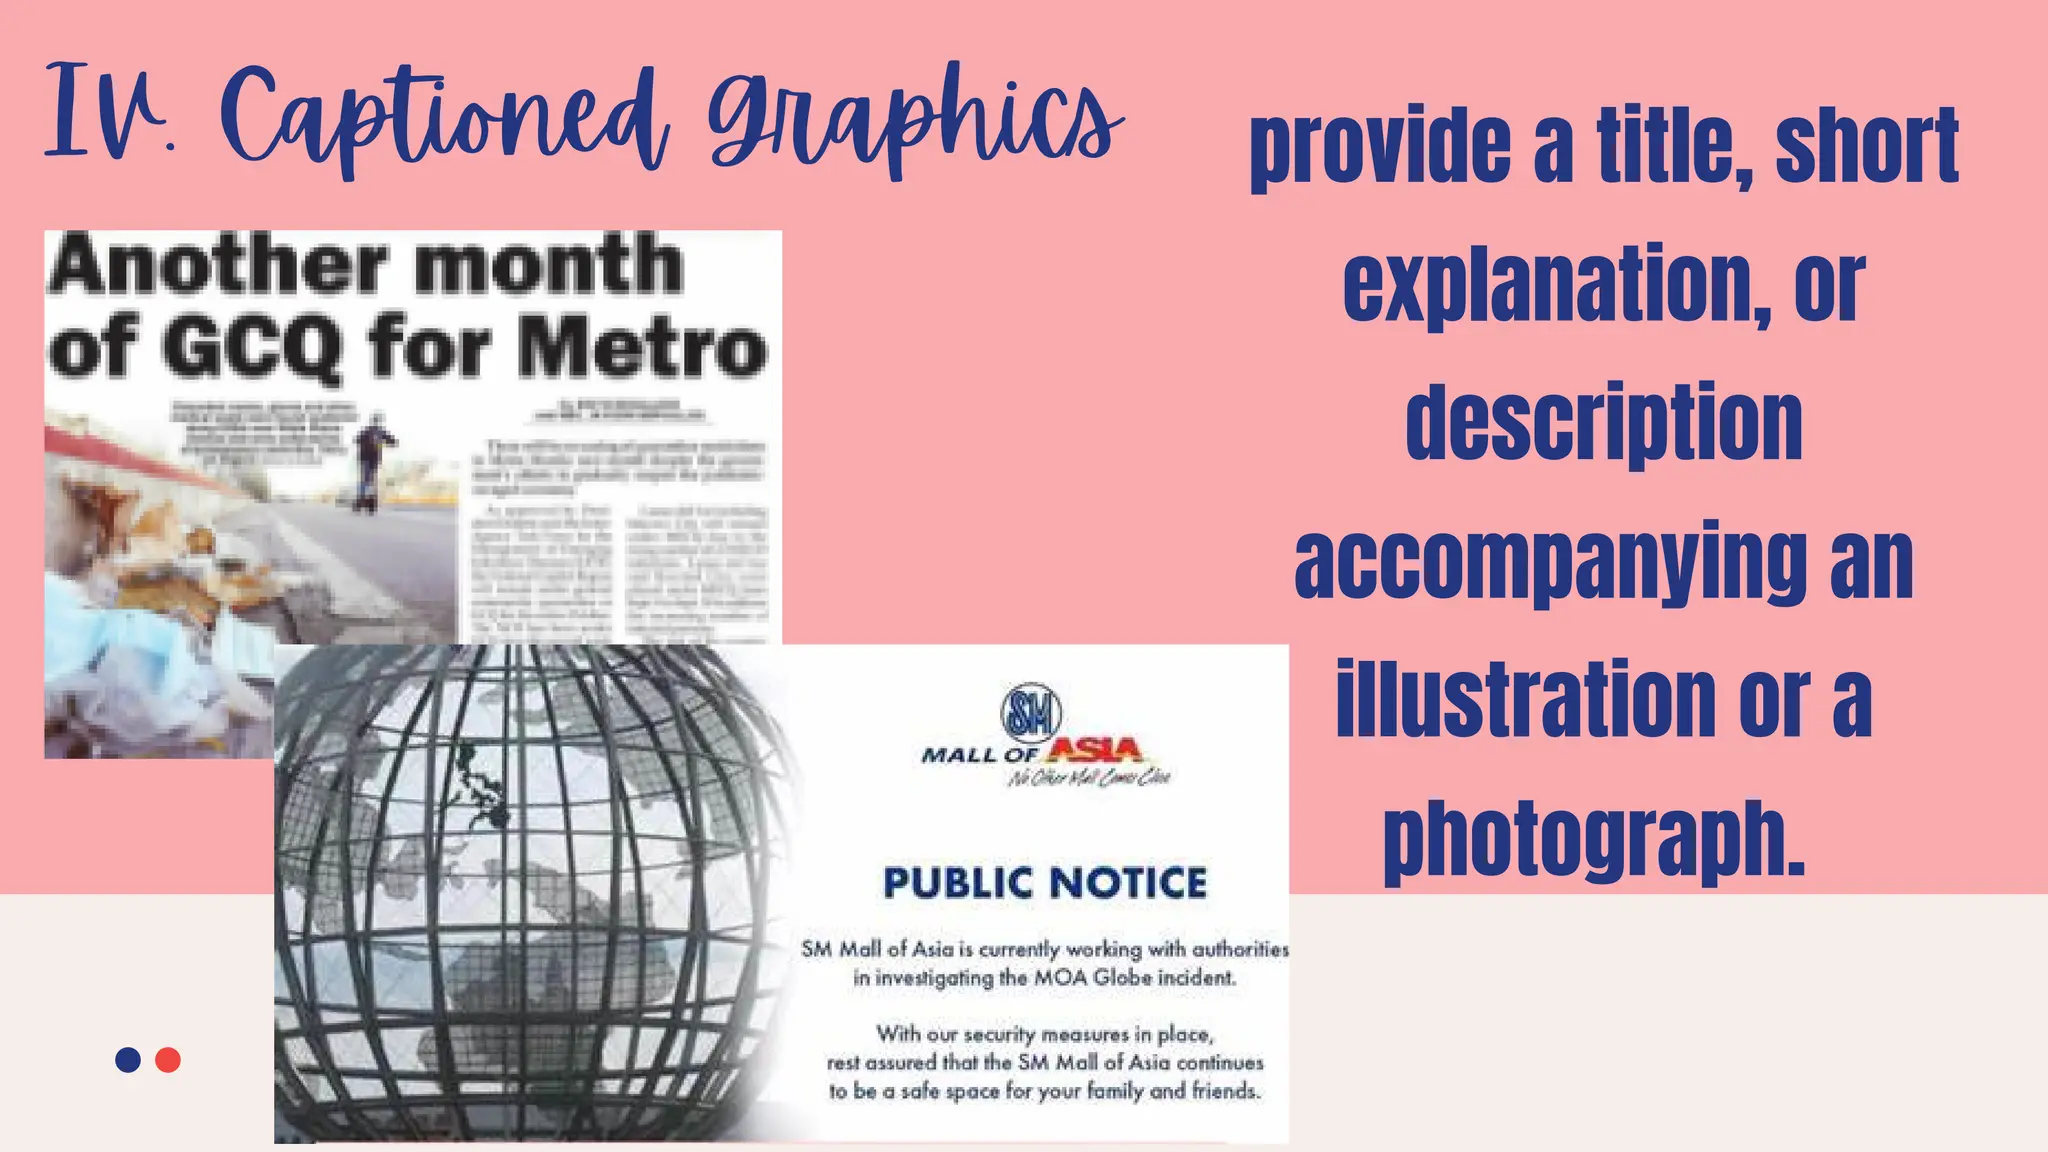
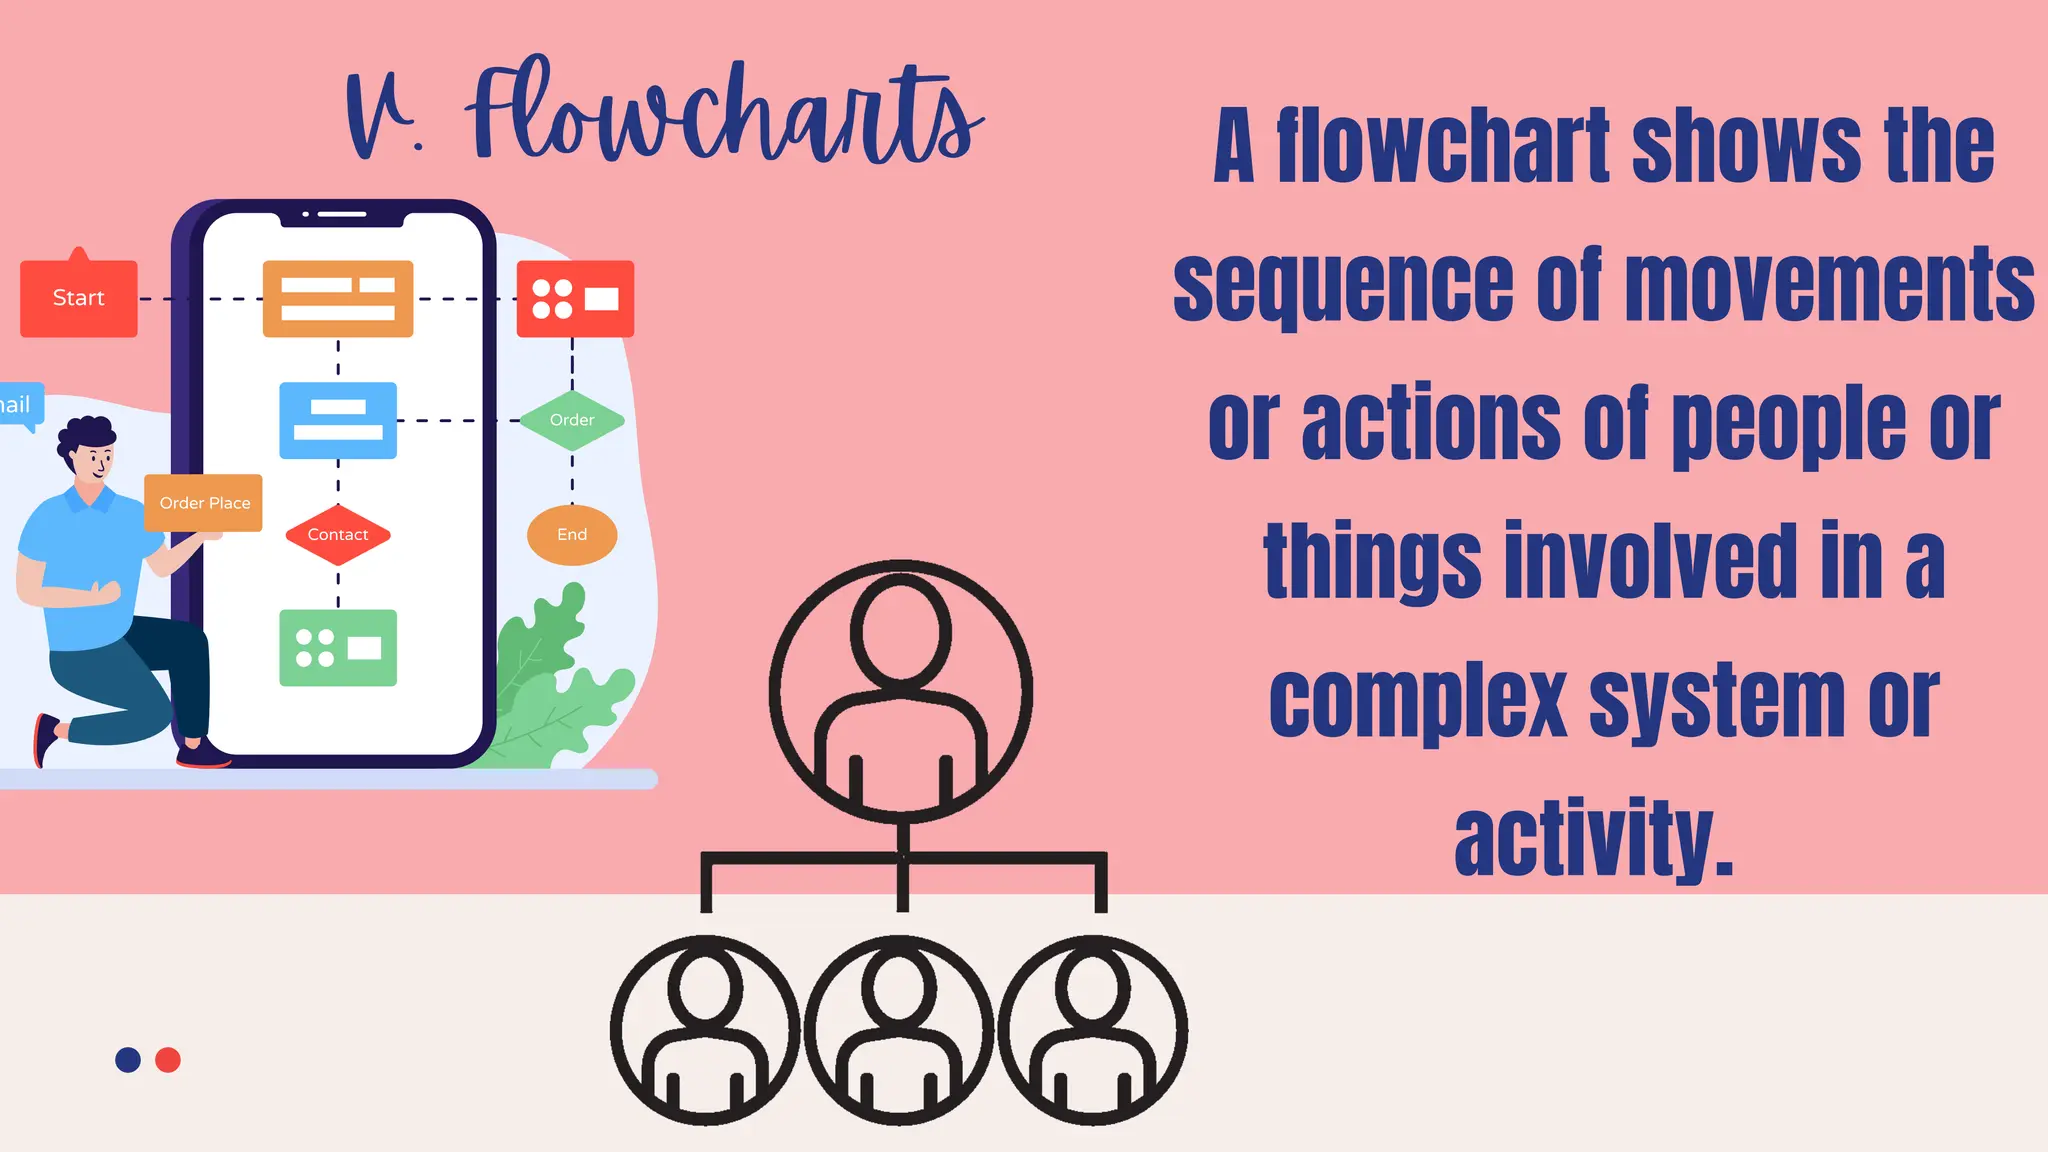
Grade 8
English Class
Ma'am Marife Gaspi
English Class | Southville 8B National High School
Grade 8
English Class
Ma'am Marife Gaspi
English Class | Southville 8B National High School
How are you?
We are now on the Second Quarter.
Are you ready to learn more?
OBJECTIVES: Identify different types of
non-linear text and their
usage.
explain visual-verbal
relationships illustrated in
tables, graphs, and
information maps found in
expository texts.
3 PICS 1 WORD
ACTIVITY:
_ _ R _ R_ _ _
BAR GRAPH
_ _ N _ _ _ A _ _
LINE GRAPH
_ L _ _ _ H_ _ _
FLOW CHART
_ A_ _ _ _
TABLES
Visual-verbal
Relationship illustrated
in expository text.
WHAT IS LINEAR TEXT?
Examples of Linear Texts
NOVELS
POEMS
SHORTS STORIES
LETTERS
EDUCATIONAL TEXTS
What is
Non-linear
Text?
Examples of Non-Linear Text
Graphs
Tables
Flowcharts
Maps
Visual-Verbal
Relationship
Example of Wordy Report
uninteresting or too
tiresome to read
because its wordy
That's the reason why we need to learn
how to present information effectively
using textual aids especially if we
extract them from expository texts.
Expository texts are designed to explain, inform, and present facts of
specific topics. These texts can be accompanied by visual cues to provide
or further highlight information.
Examples of these visual elements include graphs, tables, maps,
illustrations, and the like. Their primary function is to improve
comprehension of a reading material. However, understanding graphic
elements like those cited above is an important aspect of comprehending
texts that some tend to skip.
The concept of visual-verbal symbiosis is rooted in the
idea that "visuals"
support "verbals," and vice versa, found a symbiotic
relationship
between verbal and visual literacies when the two are
combined to facilitate student achievement.
I. Graphs
These are diagrams showing
the relation between variable
quantities, typically of two
variables, each measured
along a pair of axes at right
angles.
Examples of Graphs
Bar Graph
Line Graph
Pie Graph/
Pie Chart
Pictograph / Pictogram
Examples of Graphs
Bar Graphshow numbers that are
independent of each
other,
show you how numbers have changed over
time. It usually has continuous data along
a vertical (Y-axis) and horizontal (X-axis)
dimensions. The Y-axis usually shows the
value of whatever variable being
measured; the X-axis commonly presents
when it was measured, either
chronologically or based on other
independent variables.
Examples of Graphs
Line Graph
is a special type of bar graph.
Instead of using an axis with
numbers, it uses pictures to
represent a particular number of
items.
Examples of Graphs
Pictograph/Pictogram
shows you how a whole is
divided into different parts, i.e.
showing how a budget had been
spent on different items in a
particular year
Examples of Graphs
Pie Graph/ Pie Chart
II. Tables
A table, also known as
matrix, refers an orderly
arranged quantitative
data in columns and
rows.
III. Maps A map refers to
collection of data
showing the spatial
arrangement or
distribution of something
over an area.
IV. Captioned Graphics provide a title, short
explanation, or
description
accompanying an
illustration or a
photograph.
V. Flowcharts A flowchart shows the
sequence of movements
or actions of people or
things involved in a
complex system or
activity.
Steps in
transforming
Linear Text to
Non- Linear
Texts
Read and analyze the text and get
the main idea.
Extract the important details for
the visual representation.
Remember to use keywords or
phrases only.
Classify information into
categories.
Use the appropriate textual aid to
present information
1.
2.
3.
4.
5.
ACTIVITY
TIME!
VISUAL-VERBAL RELATIONSHIP LESSON FOR GRADE EIGHT

VISUAL-VERBAL RELATIONSHIP LESSON FOR GRADE EIGHT

  • 1.
    Grade 8 English Class Ma'amMarife Gaspi English Class | Southville 8B National High School
  • 2.
    Grade 8 English Class Ma'amMarife Gaspi English Class | Southville 8B National High School How are you? We are now on the Second Quarter. Are you ready to learn more?
  • 3.
    OBJECTIVES: Identify differenttypes of non-linear text and their usage. explain visual-verbal relationships illustrated in tables, graphs, and information maps found in expository texts.
  • 4.
    3 PICS 1WORD ACTIVITY:
  • 5.
    _ _ R_ R_ _ _
  • 6.
  • 7.
    _ _ N_ _ _ A _ _
  • 8.
  • 9.
    _ L __ _ H_ _ _
  • 10.
  • 11.
    _ A_ __ _
  • 12.
  • 13.
  • 14.
  • 15.
    Examples of LinearTexts NOVELS POEMS SHORTS STORIES LETTERS EDUCATIONAL TEXTS
  • 16.
  • 17.
    Examples of Non-LinearText Graphs Tables Flowcharts Maps
  • 18.
  • 19.
    Example of WordyReport uninteresting or too tiresome to read because its wordy That's the reason why we need to learn how to present information effectively using textual aids especially if we extract them from expository texts.
  • 20.
    Expository texts aredesigned to explain, inform, and present facts of specific topics. These texts can be accompanied by visual cues to provide or further highlight information. Examples of these visual elements include graphs, tables, maps, illustrations, and the like. Their primary function is to improve comprehension of a reading material. However, understanding graphic elements like those cited above is an important aspect of comprehending texts that some tend to skip.
  • 21.
    The concept ofvisual-verbal symbiosis is rooted in the idea that "visuals" support "verbals," and vice versa, found a symbiotic relationship between verbal and visual literacies when the two are combined to facilitate student achievement.
  • 22.
    I. Graphs These arediagrams showing the relation between variable quantities, typically of two variables, each measured along a pair of axes at right angles.
  • 23.
    Examples of Graphs BarGraph Line Graph Pie Graph/ Pie Chart Pictograph / Pictogram
  • 24.
    Examples of Graphs BarGraphshow numbers that are independent of each other,
  • 25.
    show you hownumbers have changed over time. It usually has continuous data along a vertical (Y-axis) and horizontal (X-axis) dimensions. The Y-axis usually shows the value of whatever variable being measured; the X-axis commonly presents when it was measured, either chronologically or based on other independent variables. Examples of Graphs Line Graph
  • 26.
    is a specialtype of bar graph. Instead of using an axis with numbers, it uses pictures to represent a particular number of items. Examples of Graphs Pictograph/Pictogram
  • 27.
    shows you howa whole is divided into different parts, i.e. showing how a budget had been spent on different items in a particular year Examples of Graphs Pie Graph/ Pie Chart
  • 28.
    II. Tables A table,also known as matrix, refers an orderly arranged quantitative data in columns and rows.
  • 29.
    III. Maps Amap refers to collection of data showing the spatial arrangement or distribution of something over an area.
  • 30.
    IV. Captioned Graphicsprovide a title, short explanation, or description accompanying an illustration or a photograph.
  • 31.
    V. Flowcharts Aflowchart shows the sequence of movements or actions of people or things involved in a complex system or activity.
  • 32.
    Steps in transforming Linear Textto Non- Linear Texts Read and analyze the text and get the main idea. Extract the important details for the visual representation. Remember to use keywords or phrases only. Classify information into categories. Use the appropriate textual aid to present information 1. 2. 3. 4. 5.
  • 33.