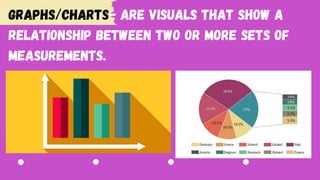
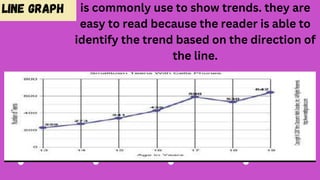
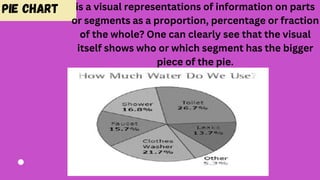
This document discusses different types of non-linear text such as diagrams, charts, graphs, and maps. It explains that graphs and charts visually show relationships between measurements, with common types being line graphs, bar graphs, and pie charts. Diagrams are symbolic visual representations of information. Examples of different graph types are provided, including bar graphs to compare variables or frequencies, line graphs to show trends over time, and pie charts to proportion parts of a whole.