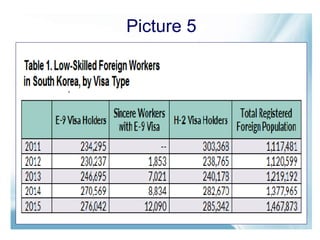
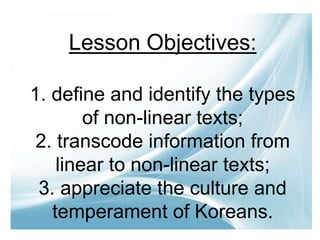
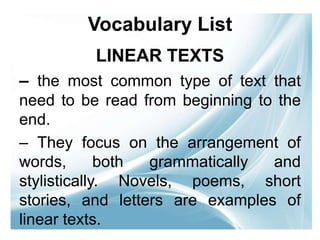
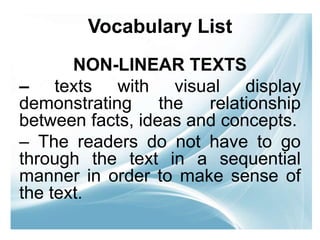
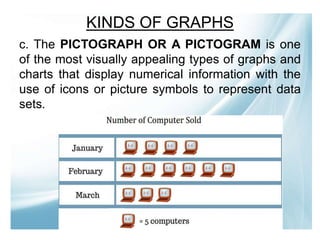
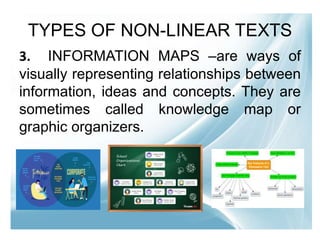
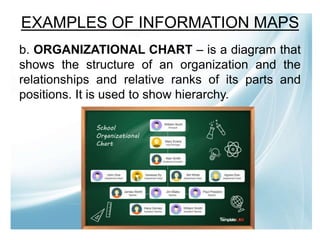
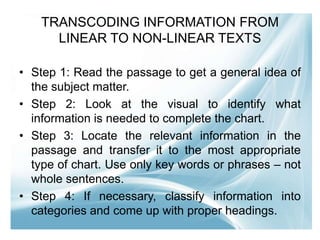
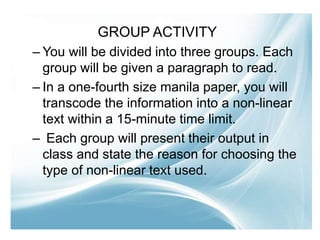
Welcome
Dear Students!
INTERPRETIN
G
NON-LINEAR
TEXTS
MOCG.09.march.2021
ACTIVITY: MEMORY GAME
Directions:
A set of pictures will be shown for a
time limit of 15 seconds each. You
have to remember as much detail
about the pictures as possible
within the given time because after
seeing each picture, you will be
asked a question about it.
ARE
YOU
READY?
Picture 1
Picture 2
Picture 3
Picture 4
Picture 5
QUESTION:
- Do you find difficulty in
reading lengthy texts?
- How do you address this
challenge?
Lesson Objectives:
1. define and identify the types
of non-linear texts;
2. transcode information from
linear to non-linear texts;
3. appreciate the culture and
temperament of Koreans.
Vocabulary List
LINEAR TEXTS
– the most common type of text that
need to be read from beginning to the
end.
– They focus on the arrangement of
words, both grammatically and
stylistically. Novels, poems, short
stories, and letters are examples of
linear texts.
Vocabulary List
NON-LINEAR TEXTS
– texts with visual display
demonstrating the relationship
between facts, ideas and concepts.
– The readers do not have to go
through the text in a sequential
manner in order to make sense of
the text.
Let us have an example:
Now, compare the previous example to
this next example:
•Which one is easier to
understand?
•Why do you say so?
• Non-linear texts are used
to present data in an
orderly way and also to
enable the readers to see
large quantities of
information at a glance.
• They contain valuable
information which, when
written in sentences or
paragraphs may be difficult
to understand.
Non-Linear Texts are used to:
• Summarize figures
• Show trends
• Show comparisons
• Show relationships
• Clarify difficult concepts
TYPES OF NON-LINEAR TEXTS
1. GRAPHS - these are the representation
of data represented by symbols or
legends.
KINDS OF GRAPHS
a. A CIRCLE GRAPH is a round-shaped diagram
that is divided into fractions that look like pieces of a
pie, so sometimes it is called a pie graph. The
fractional parts are different colors and a legend
explains the meaning of the colors.
KINDS OF GRAPHS
b. A BAR GRAPH uses bars to show data. The bars
can be vertical (up and down), or horizontal
(across). The data can be in words or numbers.
KINDS OF GRAPHS
c. The PICTOGRAPH OR A PICTOGRAM is one
of the most visually appealing types of graphs and
charts that display numerical information with the
use of icons or picture symbols to represent data
sets.
KINDS OF GRAPHS
d. A LINE GRAPH displays data that changes
continuously over time. Each line graph consists of
points that connect data to show a trend (continuous
change). Line graphs have an x-axis and a y-axis.
TYPES OF NON-LINEAR TEXTS
2. TABLES - are structured for
organizing and displaying information,
with data arranged in columns and rows.
Information is displayed as text, using
words and numbers, and grid lines may
be present or not.
TYPES OF NON-LINEAR TEXTS
3. INFORMATION MAPS –are ways of
visually representing relationships between
information, ideas and concepts. They are
sometimes called knowledge map or
graphic organizers.
EXAMPLES OF INFORMATION MAPS
a. VENN DIAGRAM - is great for helping to find
similarities and differences between concepts. The
similarities in a Venn diagram are placed in the union
between two or more circles, while the differences are
placed where the previous circles don‘t meet.
EXAMPLES OF INFORMATION MAPS
b. ORGANIZATIONAL CHART – is a diagram that
shows the structure of an organization and the
relationships and relative ranks of its parts and
positions. It is used to show hierarchy.
EXAMPLES OF INFORMATION MAPS
C. CONCEPT MAP – This is used to brainstorm an idea
or topic using related information. Most concept maps
depict ideas as boxes or circles which are connected
with lines or arrows. These lines are labeled with linking
words and phrases to help explain the connections
between concepts.
TRANSCODING INFORMATION FROM
LINEAR TO NON-LINEAR TEXTS
• Step 1: Read the passage to get a general idea of
the subject matter.
• Step 2: Look at the visual to identify what
information is needed to complete the chart.
• Step 3: Locate the relevant information in the
passage and transfer it to the most appropriate
type of chart. Use only key words or phrases – not
whole sentences.
• Step 4: If necessary, classify information into
categories and come up with proper headings.
Directions: Analyze the given illustration
and answer the following questions.
QUESTIONS:
1. What type of graph is illustrated?
2. What is the graph all about?
3. What age range has the highest
percentage?
4. What indication can you give in this
graph?
5. How did the graph help you
understand the illustration?
GROUP ACTIVITY
– You will be divided into three groups. Each
group will be given a paragraph to read.
– In a one-fourth size manila paper, you will
transcode the information into a non-linear
text within a 15-minute time limit.
– Each group will present their output in
class and state the reason for choosing the
type of non-linear text used.
Scoring Guide:
Content – 10 points
Presentation – 10 points
Cooperation – 10 points
Total – 30 points
Assignment:
Compare and contrast the
culture of Koreans and Filipinos.
Use the appropriate non-linear text
for your output.
Thank You for your
participation and
have a great day
ahead!

DEMO.Non-linear texts.FINAL.pptx

  • 1.
  • 2.
  • 3.
    ACTIVITY: MEMORY GAME Directions: Aset of pictures will be shown for a time limit of 15 seconds each. You have to remember as much detail about the pictures as possible within the given time because after seeing each picture, you will be asked a question about it.
  • 4.
  • 5.
  • 6.
  • 7.
  • 8.
  • 9.
  • 10.
    QUESTION: - Do youfind difficulty in reading lengthy texts? - How do you address this challenge?
  • 11.
    Lesson Objectives: 1. defineand identify the types of non-linear texts; 2. transcode information from linear to non-linear texts; 3. appreciate the culture and temperament of Koreans.
  • 12.
    Vocabulary List LINEAR TEXTS –the most common type of text that need to be read from beginning to the end. – They focus on the arrangement of words, both grammatically and stylistically. Novels, poems, short stories, and letters are examples of linear texts.
  • 13.
    Vocabulary List NON-LINEAR TEXTS –texts with visual display demonstrating the relationship between facts, ideas and concepts. – The readers do not have to go through the text in a sequential manner in order to make sense of the text.
  • 14.
    Let us havean example:
  • 15.
    Now, compare theprevious example to this next example:
  • 16.
    •Which one iseasier to understand? •Why do you say so?
  • 17.
    • Non-linear textsare used to present data in an orderly way and also to enable the readers to see large quantities of information at a glance.
  • 18.
    • They containvaluable information which, when written in sentences or paragraphs may be difficult to understand.
  • 19.
    Non-Linear Texts areused to: • Summarize figures • Show trends • Show comparisons • Show relationships • Clarify difficult concepts
  • 20.
    TYPES OF NON-LINEARTEXTS 1. GRAPHS - these are the representation of data represented by symbols or legends.
  • 21.
    KINDS OF GRAPHS a.A CIRCLE GRAPH is a round-shaped diagram that is divided into fractions that look like pieces of a pie, so sometimes it is called a pie graph. The fractional parts are different colors and a legend explains the meaning of the colors.
  • 22.
    KINDS OF GRAPHS b.A BAR GRAPH uses bars to show data. The bars can be vertical (up and down), or horizontal (across). The data can be in words or numbers.
  • 23.
    KINDS OF GRAPHS c.The PICTOGRAPH OR A PICTOGRAM is one of the most visually appealing types of graphs and charts that display numerical information with the use of icons or picture symbols to represent data sets.
  • 24.
    KINDS OF GRAPHS d.A LINE GRAPH displays data that changes continuously over time. Each line graph consists of points that connect data to show a trend (continuous change). Line graphs have an x-axis and a y-axis.
  • 25.
    TYPES OF NON-LINEARTEXTS 2. TABLES - are structured for organizing and displaying information, with data arranged in columns and rows. Information is displayed as text, using words and numbers, and grid lines may be present or not.
  • 27.
    TYPES OF NON-LINEARTEXTS 3. INFORMATION MAPS –are ways of visually representing relationships between information, ideas and concepts. They are sometimes called knowledge map or graphic organizers.
  • 28.
    EXAMPLES OF INFORMATIONMAPS a. VENN DIAGRAM - is great for helping to find similarities and differences between concepts. The similarities in a Venn diagram are placed in the union between two or more circles, while the differences are placed where the previous circles don‘t meet.
  • 29.
    EXAMPLES OF INFORMATIONMAPS b. ORGANIZATIONAL CHART – is a diagram that shows the structure of an organization and the relationships and relative ranks of its parts and positions. It is used to show hierarchy.
  • 30.
    EXAMPLES OF INFORMATIONMAPS C. CONCEPT MAP – This is used to brainstorm an idea or topic using related information. Most concept maps depict ideas as boxes or circles which are connected with lines or arrows. These lines are labeled with linking words and phrases to help explain the connections between concepts.
  • 31.
    TRANSCODING INFORMATION FROM LINEARTO NON-LINEAR TEXTS • Step 1: Read the passage to get a general idea of the subject matter. • Step 2: Look at the visual to identify what information is needed to complete the chart. • Step 3: Locate the relevant information in the passage and transfer it to the most appropriate type of chart. Use only key words or phrases – not whole sentences. • Step 4: If necessary, classify information into categories and come up with proper headings.
  • 32.
    Directions: Analyze thegiven illustration and answer the following questions.
  • 33.
    QUESTIONS: 1. What typeof graph is illustrated? 2. What is the graph all about? 3. What age range has the highest percentage? 4. What indication can you give in this graph? 5. How did the graph help you understand the illustration?
  • 34.
    GROUP ACTIVITY – Youwill be divided into three groups. Each group will be given a paragraph to read. – In a one-fourth size manila paper, you will transcode the information into a non-linear text within a 15-minute time limit. – Each group will present their output in class and state the reason for choosing the type of non-linear text used.
  • 35.
    Scoring Guide: Content –10 points Presentation – 10 points Cooperation – 10 points Total – 30 points
  • 36.
    Assignment: Compare and contrastthe culture of Koreans and Filipinos. Use the appropriate non-linear text for your output.
  • 37.
    Thank You foryour participation and have a great day ahead!