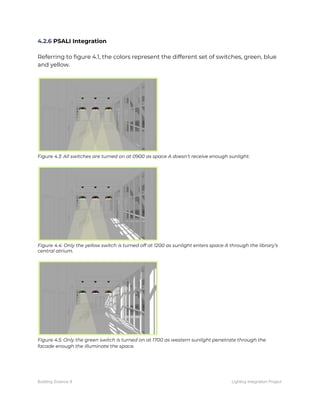
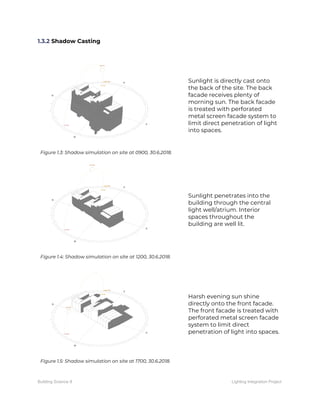
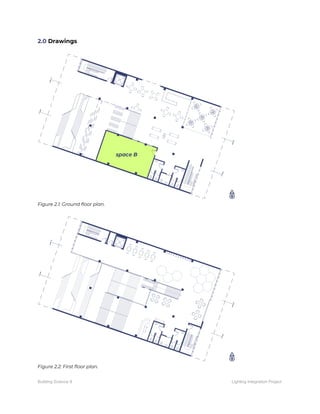
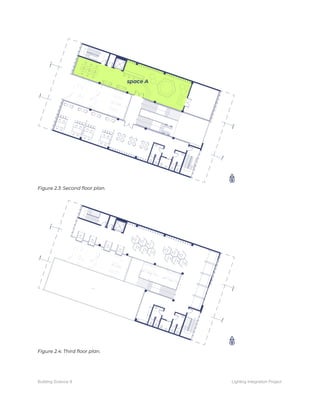
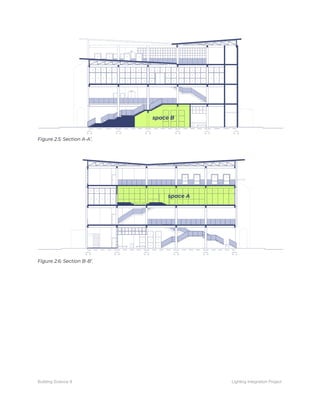
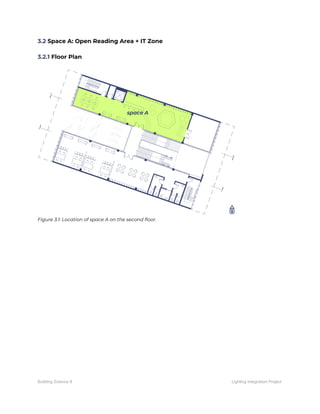
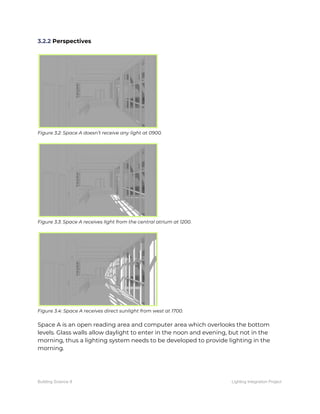
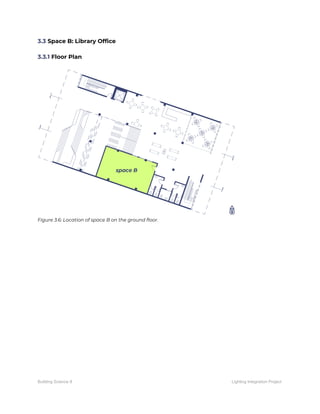
This document outlines a lighting integration project for a community library in Klang, Malaysia. It discusses daylighting and artificial lighting strategies for two spaces - an open reading area (Space A) and a library office (Space B). For Space A, the document calculates the average daylight factor to be 8.223% and determines artificial lighting is needed in the morning. For Space B, the average daylight factor is a poor 0.702%, requiring artificial lighting all day. Layouts, calculations and conclusions are provided for the artificial lighting designs of both spaces to meet illumination standards.

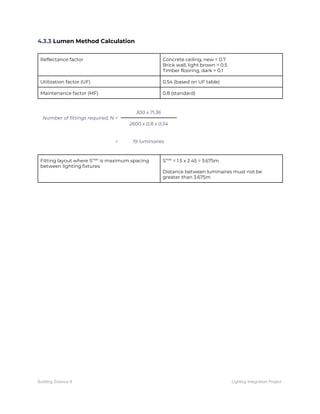
![3.2.3 Daylight contour
Figure 3.5: Space A daylight contour.
3.2.4 Average Daylight Factor Calculation
Area of windows (W, m²) L = 26.4m
H = 3.4m
W = 26.4 x 3.4 = 89.76m²
Total area of internal surfaces (A, m²) (Perimeter x Height) + (Total floor area x 2)
= [(14.05 + 6.2 + 23.7 + 3.8 + 9.65 + 2.4) x 3.8] + (123.78 x 2)
= 474.8m²
Glass transmittance corrected for dirt (T) 0.6 (for double glazed window in clean environment)
Visible sky angle in degrees from the
centre of the window (Ø)
43.5°
average reflectance of area A (R) 0.4 (not all light is reflected back into space)
Average DF =
W
x
TØ
A ( 1 - R )
=
89.76
x
0.6 (43.5)
474.8 (1 - 0.4)
= 8.223%
Building Science II Lighting Integration Project](https://image.slidesharecdn.com/lightingintegration-180709082748/85/Lighting-Integration-Project-12-320.jpg)
![3.3.4 Average Daylight Factor Calculation
Area of windows (W, m²) L = 3.6m
H = 3.48m
W = 3.6 x 3.48 = 12.52m²
Total area of internal surfaces (A, m²) (Walls) + (Total floor area x 2)
= [(45.405 x 2) + (6.45 x 2.2) + (6.45 X 4.2)] + (71.9 x 2)
= 132.09 + 143.8
= 275.89m²
Glass transmittance corrected for dirt (T) 0.6 (for double glazed window in clean environment)
Visible sky angle in degrees from the
centre of the window (Ø)
15.47°
average reflectance of area A (R) 0.4 (not all light is reflected back into space)
Average DF =
W
x
TØ
A ( 1 - R )
=
12.52
x
0.6 (15.47)
275.89 (1 - 0.4)
= 0.702%
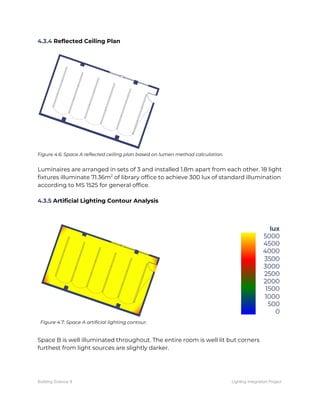
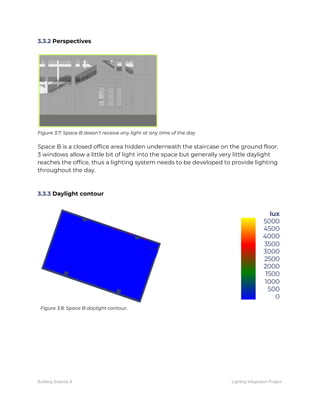
3.3.5 Conclusion
Space B has a distribution of daylight factor of 0.702%, which is very poor compared
to the the standard room illumination standard recommended by MS1525. Artificial
lighting is needed throughout the day as very little daylight reaches the space.
Building Science II Lighting Integration Project](https://image.slidesharecdn.com/lightingintegration-180709082748/85/Lighting-Integration-Project-16-320.jpg)