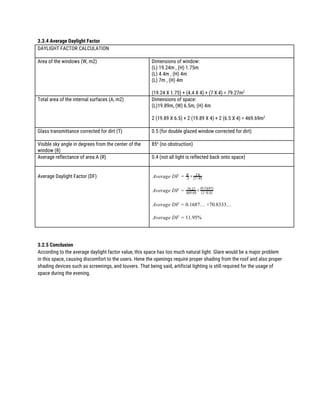
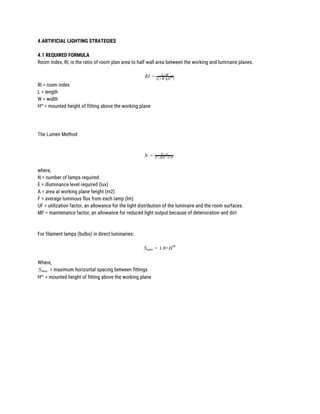
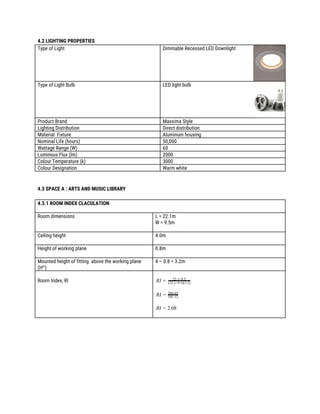
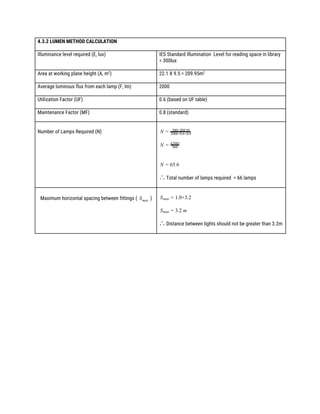
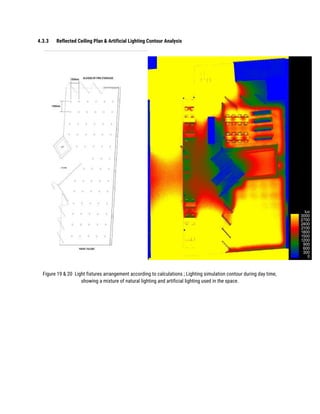
BUILDING SCIENCE II 
[BLD 61303 / ARC 3413] 
 
 
PROJECT 2: INTEGRATION PROJECT 


NAME : NICOLE FOO SHULI 
STUDENT ID: 0325517 
TUTOR:  MR EDWIN  


CONTENTS 
 
1. INTRODUCTION TO PROJECT 
1.1 SITE PLAN 
1.2 CLIMATIC STUDIES 
 
2. DRAWINGS 
2.1 FLOOR PLANS 
2.2 SECTIONAL PERSPECTIVE 
 
3. DAYLIGHTING STRATEGIES 
 
3.1 REQUIRED FORMULA 
 
3.2 SPACE A : ARTS AND MUSIC LIBRARY 
3.2.1 Floor Plan 
3.2.2 Sectional Perspective 
3.2.3 Daylight Contour 
3.2.4 Average Daylight Factor 
3.2.5 Conclusion 
 
3.3 SPACE B: CULTURAL COLLECTION 2 
3.3.1 Floor Plan 
3.3.2 Sectional Perspective 
3.3.3 Daylight Contour 
3.3.4 Average Daylight Factor 
3.3.5 Conclusion 
 
4. ARTIFICIAL LIGHTING STRATEGIES 
  
4.1 REQUIRED FORMULA 
4.2 LIGHT FIXTURES PROPERTIES 
 
4.3 SPACE A: ARTS AND MUSIC LIBRARY 
4.3.1 Room Index Calculations 
4.3.2 Lumen Method Calculation 
4.3.3 Reflected Ceiling Plan & Artificial Lighting Contour Analysis 
4.3.4 PSALI Intergration 
 
4.4 SPACE B: CULTURAL COLLECTION 2 
4.4.1 Room Index Calculations 
4.4.2 Lumen Method Calculation 
4.4.3 Reflected Ceiling Plan & Artificial Lighting Contour Analysis 
4.4.4 PSALI Intergration 


1 .INTRODUCTION TO SITE 
 
1.1 SITE PLAN 
The site is located along Jalan Hang Kasturi, Kuala Lumpur. The library has the coordinates of Latitude = 3.146792, 
Longitude = 101.696084, with the back façade receiving eastern sunlight and the front façade receiving western 
sunlight. 
 
 
Figure 1 Site plan showing location and orientation of site. 


1.2 SUNPATH STUDIES 
 
Figure 2 Shadow simulation diagram of site on 22​nd​
December at 9am. 
 
 
Figure 3 Shadow simulation diagram of site on 22​nd​
December at 1pm. 


Figure 4 Shadow simulation diagram of site on 22​nd​
December at 4pm. 
 
Both front and back facades are covered with horizontal timber batten screenings. At 9am, the top half of the back                                       
facade receives eastern sunlight, while the lower half of the building is shaded by the block of buildings behind it. At                                         
1pm, the sun penetrates the building from the glass roof directly below it, lighting up majoirity of the spaces within the                                         
building. At 4pm, the front façade is fully exposed to the western sun without being blocked by any buildings, causing                                       
the spaces you be lit with light that diffuses through the screening. 


3. DAYLIGHT STRATEGIES 
 
3.1 REQUIRED FORMULA 
The average daylight factor is used to assess the adequacy of daylight in a building /space. 
 
verage DF ×A = A
W Tθ
(1−R)
 
W is the area of the windows (m2) 
A is the total area of the internal surfaces (m2) 
T is the glass transmittance corrected for dirt 
θ is visible sky angle in degrees from the center of the window 
R is the average reflectance of area A. 
 
3.2 SPACE A: ARTS AND MUSIC LIBRARY 
3.2.1 Floor Plan 
 
Figure 11 Isolated floor plan of The Arts and Music Library. 


3.2.2 Sectional Perspective (Short Section) 
 
 
Figure 12 The Arts and Music Library receives little natural daylight at 9am. 


Figure 13 The Arts and Music Library receives close to no natural daylight at 4pm 
. 
Located on the 1​st
Floor of the building, the Arts and Music Library receives natural daylight very poorly as it is mostly                                           
shaded the the 2​nd
Floor. This space has a concrete wall on one side and wooden screenings as wall on the other. The                                             
openings of this space is made of rotatable floor to ceiling glass panels as door.  


3.2.3 Daylight Contour 
The front of this room is directly coupled with the front                     
façade, the back of the space is shaded by the fire staircase.                       
As seen in the daylight simulation diagram, the glass doors                   
are the main places where natural light can travel into the                     
space, other than that the space is rather dark. 


Figure 14 Daylight simulation of the Arts & Music Library. 
 
3.2.4 Average Daylight Factor 
DAYLIGHT FACTOR CALCULATION 
 
Area of the windows (W, m2)  Dimensions of window: 
(L) 6.15m , (H) 4m  
 
6.15 X 4 = 24.6m​2 
Total area of the internal surfaces (A, m2) 
 
Dimensions of space:  
(L) 22.1m, (W) 9.5m, (H) 4m, (void on floor) 8.28mx4.9m 
 
(22.1 X 9.5) + ( (22.1 X 9.5) – (8.28 X 4.9)) + 2 (22.1 X 4) + 2 (9.5 X 
4) = 632.13m​2 
 
Glass transmittance corrected for dirt (T)  0.6 (for double glazed window in clean environment) 
 
Visible sky angle in degrees from the center of the 
window (θ) 
54​o
  
 
Average reflectance of area A (R) 
 
0.4 (not all light is reflected back onto space) 
 
Average Daylight Factor (DF) 
 
verage DF ×A = A
W Tθ
(1−R)
 
verage DF ×A = 24.6
632.13 (1−0.4)
(0.6)(54)
 
verage DF .0389… ×54A = 0
 
verage DF .10%A = 2


3.2.5 Conclusion 
According to the average daylight factor, this space is not well lit. The sole dependence on natural daylight to lit this 
space is not ideal and not sufficient. For users to use the space comfortably, artificial lighting is very much needed. 
Artificial lighting system should be designed according to to PSALI. 


3.3 SPACE B : CULTURAL COLLECTION 2 
3.3.1 Floor Plan 
 
 
Figure 15 Isolated floor plan of Cultural Collection 2. 
 
Located on the 3​rd
Floor of the building, the Cultural Collection 2 space wooden screenings as wall on 3 sides and a                                           
concrete wall with a glass window on the other. The pair of glass doors, glass walls and windows are the openings in                                           
this space which natural daylight is introduced into the space. 


3.3.2 Sectional Perspective 
 
Figure 16 The Cultural Collection 2 receives a lot of natural daylight at 9am. 
 
Figure 17 the space is still lit up by natural daylight at 4pm, but not by direct  
sunlight as sunlight has been blocked by the roof. 
 
 
3.3.3 Daylight Contour 
The front and back of this room is directly coupled with the front and                           
back timber screening façades. As seen in the daylight simulation                   
diagram, this space is well lit with natural daylight. 


Figure 18 Daylight simulation of the Cultural Collection 2 space. 
3.3.4 Average Daylight Factor 
DAYLIGHT FACTOR CALCULATION 
 
Area of the windows (W, m2)  Dimensions of window: 
(L) 19.24m , (H) 1.75m 
(L) 4.4m , (H) 4m 
(L) 7m , (H) 4m 
 
(19.24 X 1.75) + (4.4 X 4) + (7 X 4) = 79.27m​2 
Total area of the internal surfaces (A, m2) 
 
Dimensions of space:  
(L)19.89m, (W) 6.5m, (H) 4m 
 
2 (19.89 X 6.5) + 2 (19.89 X 4) + 2 (6.5 X 4) = 469.69m​2 
 
Glass transmittance corrected for dirt (T)  0.5 (for double glazed window corrected for dirt) 
 
Visible sky angle in degrees from the center of the 
window (θ) 
85​o​
(no obstruction) 
 
Average reflectance of area A (R) 
 
0.4 (not all light is reflected back onto space) 
 
Average Daylight Factor (DF) 
 
verage DF ×A = A
W Tθ
(1−R)
 
verage DF ×A = 79.27
469.69 (1−0.4)
(0.5)(85)
 
verage DF .1687… ×70.8333…A = 0
 
verage DF 1.95%A = 1


3.2.5 Conclusion 
According to the average daylight factor value, this space has too much natural light. Glare would be a major problem 
in this space, causing discomfort to the users. Hene the openings require proper shading from the roof and also proper 
shading devices such as screenings, and louvers. That being said, artificial lighting is still required for the usage of 
space during the evening.   
4.ARTIFICIAL LIGHTING STRATEGIES 
 
4.1 REQUIRED FORMULA 
Room Index, RI, is the ratio of room plan area to half wall area between the working and luminaire planes. 
 
IR = L×W
(L+W)(H )
m
RI = room index 
L = length 
W = width 
H​m​
= mounted height of fitting above the working plane 


The Lumen Method 
 
 
N = E×A
F×MF×UF
 
where, 
N = number of lamps required. 
E = illuminance level required (lux) 
A = area at working plane height (m2) 
F = average luminous flux from each lamp (lm) 
UF = utilization factor, an allowance for the light distribution of the luminaire and the room surfaces. 
MF = maintenance factor, an allowance for reduced light output because of deterioration and dirt 
 
 
For filament lamps (bulbs) in direct luminaries: 
 
.0×HSmax = 1
m
 
Where,  
= maximum horizontal spacing between fittingsSmax  
H​m ​
= mounted height of fitting above the working plane 


4.2 LIGHTING PROPERTIES 
Type of Light  Dimmable Recessed LED Downlight 
Type of Light Bulb  LED light bulb  
Product Brand  Maxxima Style 
Lighting Distribution  Direct distribution 
Material Fixture  Aluminum housing 
Nominal Life (hours)  50,000 
Wattage Range (W)  60 
Luminous Flux (lm)  2000 
Colour Temperature (k)  3000 
Colour Designation  Warm white 
 
 
4.3 SPACE A : ARTS AND MUSIC LIBRARY 
 
4.3.1 ROOM INDEX CLACULATION 
 
Room dimensions  L = 22.1m  
W = 9.5m 
 
Ceiling height  4.0m 
 
Height of working plane  0.8m 
 
Mounted height of fitting above the working plane 
(H​m​
) 
4 – 0.8 = 3.2m 
 
 
Room Index, RI 
 
IR = 22.1×9.5
(22.1+9.5)(3.2)
 
IR = 101.12
209.95
 
I .08R = 2


4.3.2 LUMEN METHOD CALCULATION 
 
Illuminance level required (E, lux) 
 
IES Standard Illumination Level for reading space in library 
= 300lux 
 
Area at working plane height (A, m​2​
) 
 
22.1 X 9.5 = 209.95m​2 
Average luminous flux from each lamp (F, lm) 
 
2000 
Utilization Factor (UF)  0.6 (based on UF table) 
 
Maintenance Factor (MF)  0.8 (standard) 
 
 
Number of Lamps Required (N) 
 
N = 300×209.95
2000×0.6×0.8
 
N = 960
62985
 
 
5.6N = 6
 
∴ ​Total number of lamps required = 66 lamps 
 
 
Maximum horizontal spacing between fittings ( )Smax  


.0×3.2Smax = 1
 
.2 mSmax = 3
 
∴ ​Distance between lights should not be greater than 3.2m 


4.3.3 Reflected Ceiling Plan & Artificial Lighting Contour Analysis  


Figure 19 & 20 Light fixtures arrangement according to calculations ; Lighting simulation contour during day time, 
showing a mixture of natural lighting and artificial lighting used in the space.   


PSALI Intergration 
 
Figure 21 Separation of lighting systems. 
 
Since the areas directly next to the glass doors are the areas that receive more natural light, lighting that are above                                         
those areas should be grouped to one switch (highlighted in red in Figure 21). And the remaining lights should be                                       
grouped as another switch (highlighted in blue in Figure 21). This gives the users an option to control the surrounding                                       
lights and center lights separately. 
 
During the day, this space is mainly dependent on artificial lighting. But it is important to separate and group the blue                                         
lighting systems according to the function of space directly below it. 
 
During the night, this space will be fully dependent on artificial lighting. 


4.4 SPACE B : CULTURAL COLLECTION 2 
4.4.1 ROOM INDEX CLACULATION 
 
Room dimensions  L = 19.89m  
W = 6.5m 
 
Ceiling height  4.0m 
 
Height of working plane  0.8m 
 
Mounted height of fitting above the working plane 
(H​m​
) 
4 – 0.8 = 3.2m 
 
Room Index, RI  IR = 19.89×6.5
(19.89+6.5)(3.2)
 
IR = 84.448
129.285
 
I .53R = 1


4.4.2 LUMEN METHOD CALCULATION 
 
Illuminance level required (E, lux) 
 
IES Standard Illumination Level for reading space in library 
= 300lux 
 
Area at working plane height (A, m​2​
) 
 
19.89 X 6.5 = 129.285m​2 
Average luminous flux from each lamp (F, lm) 
 
2000 
Utilization Factor (UF)  0.6 (based on UF table) 
 
Maintenance Factor (MF)  0.8 (standard) 
 
Number of Lamps Required (N)  N = 300×129.285
2000×0.6×0.8
 
N = 960
38785.5
 
0.4N = 4
 
∴ ​Total number of lamps required = 40 lamps 
 
Maximum horizontal spacing between fittings ( )Smax  
 
 
.0×3.2Smax = 1
 
.2 mSmax = 3
 
∴ ​Distance between lights should not be greater than 3.2m 


4.4.3. Reflected Ceiling Plan & Artificial Lighting Contour Analysis  
 
 
Figure 22 & 23 Light fixtures arrangement according to calculations ; Lighting simulation contour during an evening 
setting with the space being fully dependent on artificial lighting. 


4.4.4. PSALI Intergration 
 
Proper shading and screening devices are added onto openings 
to overcome the issue of glare providing users with a much 
more visually comfortable space. Ideally this space should be 
fully dependent on natural daylight and independent of artificial 
lighting during the day. 
 
Since the areas directly next to the openings and façade 
screenings are the areas that receive more natural light, lighting 
that are above those areas should be grouped to one switch 
(highlighted in red in Figure 24). And the remaining lights that 
are in the center should be grouped as another switch 
(highlighted in blue in Figure 24). This gives the users an option 
to control the surrounding lights and center lights separately. 
 
During the night, this space will be fully dependent on artificial 
lighting. 


Figure 24 Separation of lighting system. 

Building Science 2 (P2): Intergration Project

  • 1.
    BUILDING SCIENCE II  [BLD61303 / ARC 3413]      PROJECT 2: INTEGRATION PROJECT          NAME : NICOLE FOO SHULI  STUDENT ID: 0325517  TUTOR:  MR EDWIN                  
  • 2.
      CONTENTS    1. INTRODUCTION TOPROJECT  1.1 SITE PLAN  1.2 CLIMATIC STUDIES    2. DRAWINGS  2.1 FLOOR PLANS  2.2 SECTIONAL PERSPECTIVE    3. DAYLIGHTING STRATEGIES    3.1 REQUIRED FORMULA    3.2 SPACE A : ARTS AND MUSIC LIBRARY  3.2.1 Floor Plan  3.2.2 Sectional Perspective  3.2.3 Daylight Contour  3.2.4 Average Daylight Factor  3.2.5 Conclusion    3.3 SPACE B: CULTURAL COLLECTION 2  3.3.1 Floor Plan  3.3.2 Sectional Perspective  3.3.3 Daylight Contour  3.3.4 Average Daylight Factor  3.3.5 Conclusion    4. ARTIFICIAL LIGHTING STRATEGIES     4.1 REQUIRED FORMULA  4.2 LIGHT FIXTURES PROPERTIES    4.3 SPACE A: ARTS AND MUSIC LIBRARY  4.3.1 Room Index Calculations  4.3.2 Lumen Method Calculation  4.3.3 Reflected Ceiling Plan & Artificial Lighting Contour Analysis  4.3.4 PSALI Intergration    4.4 SPACE B: CULTURAL COLLECTION 2  4.4.1 Room Index Calculations  4.4.2 Lumen Method Calculation  4.4.3 Reflected Ceiling Plan & Artificial Lighting Contour Analysis  4.4.4 PSALI Intergration     
  • 3.
      1 .INTRODUCTION TOSITE    1.1 SITE PLAN  The site is located along Jalan Hang Kasturi, Kuala Lumpur. The library has the coordinates of Latitude = 3.146792,  Longitude = 101.696084, with the back façade receiving eastern sunlight and the front façade receiving western  sunlight.      Figure 1 Site plan showing location and orientation of site.                                   
  • 4.
    1.2 SUNPATH STUDIES    Figure2 Shadow simulation diagram of site on 22​nd​ December at 9am.      Figure 3 Shadow simulation diagram of site on 22​nd​ December at 1pm.     
  • 5.
      Figure 4 Shadowsimulation diagram of site on 22​nd​ December at 4pm.    Both front and back facades are covered with horizontal timber batten screenings. At 9am, the top half of the back                                        facade receives eastern sunlight, while the lower half of the building is shaded by the block of buildings behind it. At                                          1pm, the sun penetrates the building from the glass roof directly below it, lighting up majoirity of the spaces within the                                          building. At 4pm, the front façade is fully exposed to the western sun without being blocked by any buildings, causing                                        the spaces you be lit with light that diffuses through the screening.   
  • 6.
  • 7.
  • 8.
  • 9.
    3. DAYLIGHT STRATEGIES    3.1REQUIRED FORMULA  The average daylight factor is used to assess the adequacy of daylight in a building /space.    verage DF ×A = A W Tθ (1−R)   W is the area of the windows (m2)  A is the total area of the internal surfaces (m2)  T is the glass transmittance corrected for dirt  θ is visible sky angle in degrees from the center of the window  R is the average reflectance of area A.    3.2 SPACE A: ARTS AND MUSIC LIBRARY  3.2.1 Floor Plan    Figure 11 Isolated floor plan of The Arts and Music Library.       
  • 10.
    3.2.2 Sectional Perspective(Short Section)      Figure 12 The Arts and Music Library receives little natural daylight at 9am.        Figure 13 The Arts and Music Library receives close to no natural daylight at 4pm  .  Located on the 1​st Floor of the building, the Arts and Music Library receives natural daylight very poorly as it is mostly                                            shaded the the 2​nd Floor. This space has a concrete wall on one side and wooden screenings as wall on the other. The                                              openings of this space is made of rotatable floor to ceiling glass panels as door.         3.2.3 Daylight Contour  The front of this room is directly coupled with the front                      façade, the back of the space is shaded by the fire staircase.                        As seen in the daylight simulation diagram, the glass doors                    are the main places where natural light can travel into the                      space, other than that the space is rather dark.                        Figure 14 Daylight simulation of the Arts & Music Library. 
  • 11.
      3.2.4 Average DaylightFactor  DAYLIGHT FACTOR CALCULATION    Area of the windows (W, m2)  Dimensions of window:  (L) 6.15m , (H) 4m     6.15 X 4 = 24.6m​2  Total area of the internal surfaces (A, m2)    Dimensions of space:   (L) 22.1m, (W) 9.5m, (H) 4m, (void on floor) 8.28mx4.9m    (22.1 X 9.5) + ( (22.1 X 9.5) – (8.28 X 4.9)) + 2 (22.1 X 4) + 2 (9.5 X  4) = 632.13m​2    Glass transmittance corrected for dirt (T)  0.6 (for double glazed window in clean environment)    Visible sky angle in degrees from the center of the  window (θ)  54​o      Average reflectance of area A (R)    0.4 (not all light is reflected back onto space)    Average Daylight Factor (DF)    verage DF ×A = A W Tθ (1−R)   verage DF ×A = 24.6 632.13 (1−0.4) (0.6)(54)   verage DF .0389… ×54A = 0   verage DF .10%A = 2       3.2.5 Conclusion  According to the average daylight factor, this space is not well lit. The sole dependence on natural daylight to lit this  space is not ideal and not sufficient. For users to use the space comfortably, artificial lighting is very much needed.  Artificial lighting system should be designed according to to PSALI.                             
  • 12.
    3.3 SPACE B: CULTURAL COLLECTION 2  3.3.1 Floor Plan      Figure 15 Isolated floor plan of Cultural Collection 2.    Located on the 3​rd Floor of the building, the Cultural Collection 2 space wooden screenings as wall on 3 sides and a                                            concrete wall with a glass window on the other. The pair of glass doors, glass walls and windows are the openings in                                            this space which natural daylight is introduced into the space.             
  • 13.
    3.3.2 Sectional Perspective    Figure16 The Cultural Collection 2 receives a lot of natural daylight at 9am.    Figure 17 the space is still lit up by natural daylight at 4pm, but not by direct   sunlight as sunlight has been blocked by the roof.      3.3.3 Daylight Contour  The front and back of this room is directly coupled with the front and                            back timber screening façades. As seen in the daylight simulation                    diagram, this space is well lit with natural daylight.                                          Figure 18 Daylight simulation of the Cultural Collection 2 space. 
  • 14.
    3.3.4 Average DaylightFactor  DAYLIGHT FACTOR CALCULATION    Area of the windows (W, m2)  Dimensions of window:  (L) 19.24m , (H) 1.75m  (L) 4.4m , (H) 4m  (L) 7m , (H) 4m    (19.24 X 1.75) + (4.4 X 4) + (7 X 4) = 79.27m​2  Total area of the internal surfaces (A, m2)    Dimensions of space:   (L)19.89m, (W) 6.5m, (H) 4m    2 (19.89 X 6.5) + 2 (19.89 X 4) + 2 (6.5 X 4) = 469.69m​2    Glass transmittance corrected for dirt (T)  0.5 (for double glazed window corrected for dirt)    Visible sky angle in degrees from the center of the  window (θ)  85​o​ (no obstruction)    Average reflectance of area A (R)    0.4 (not all light is reflected back onto space)    Average Daylight Factor (DF)    verage DF ×A = A W Tθ (1−R)   verage DF ×A = 79.27 469.69 (1−0.4) (0.5)(85)   verage DF .1687… ×70.8333…A = 0   verage DF 1.95%A = 1       3.2.5 Conclusion  According to the average daylight factor value, this space has too much natural light. Glare would be a major problem  in this space, causing discomfort to the users. Hene the openings require proper shading from the roof and also proper  shading devices such as screenings, and louvers. That being said, artificial lighting is still required for the usage of  space during the evening.   
  • 15.
    4.ARTIFICIAL LIGHTING STRATEGIES    4.1REQUIRED FORMULA  Room Index, RI, is the ratio of room plan area to half wall area between the working and luminaire planes.    IR = L×W (L+W)(H ) m RI = room index  L = length  W = width  H​m​ = mounted height of fitting above the working plane        The Lumen Method      N = E×A F×MF×UF   where,  N = number of lamps required.  E = illuminance level required (lux)  A = area at working plane height (m2)  F = average luminous flux from each lamp (lm)  UF = utilization factor, an allowance for the light distribution of the luminaire and the room surfaces.  MF = maintenance factor, an allowance for reduced light output because of deterioration and dirt      For filament lamps (bulbs) in direct luminaries:    .0×HSmax = 1 m   Where,   = maximum horizontal spacing between fittingsSmax   H​m ​ = mounted height of fitting above the working plane                           
  • 16.
    4.2 LIGHTING PROPERTIES  Typeof Light  Dimmable Recessed LED Downlight  Type of Light Bulb  LED light bulb   Product Brand  Maxxima Style  Lighting Distribution  Direct distribution  Material Fixture  Aluminum housing  Nominal Life (hours)  50,000  Wattage Range (W)  60  Luminous Flux (lm)  2000  Colour Temperature (k)  3000  Colour Designation  Warm white      4.3 SPACE A : ARTS AND MUSIC LIBRARY    4.3.1 ROOM INDEX CLACULATION    Room dimensions  L = 22.1m   W = 9.5m    Ceiling height  4.0m    Height of working plane  0.8m    Mounted height of fitting above the working plane  (H​m​ )  4 – 0.8 = 3.2m      Room Index, RI    IR = 22.1×9.5 (22.1+9.5)(3.2)   IR = 101.12 209.95   I .08R = 2                  
  • 17.
    4.3.2 LUMEN METHODCALCULATION    Illuminance level required (E, lux)    IES Standard Illumination Level for reading space in library  = 300lux    Area at working plane height (A, m​2​ )    22.1 X 9.5 = 209.95m​2  Average luminous flux from each lamp (F, lm)    2000  Utilization Factor (UF)  0.6 (based on UF table)    Maintenance Factor (MF)  0.8 (standard)      Number of Lamps Required (N)    N = 300×209.95 2000×0.6×0.8   N = 960 62985     5.6N = 6   ∴ ​Total number of lamps required = 66 lamps      Maximum horizontal spacing between fittings ( )Smax         .0×3.2Smax = 1   .2 mSmax = 3   ∴ ​Distance between lights should not be greater than 3.2m                                           
  • 18.
    4.3.3 Reflected CeilingPlan & Artificial Lighting Contour Analysis                                                                   Figure 19 & 20 Light fixtures arrangement according to calculations ; Lighting simulation contour during day time,  showing a mixture of natural lighting and artificial lighting used in the space.                             
  • 19.
    PSALI Intergration    Figure 21Separation of lighting systems.    Since the areas directly next to the glass doors are the areas that receive more natural light, lighting that are above                                          those areas should be grouped to one switch (highlighted in red in Figure 21). And the remaining lights should be                                        grouped as another switch (highlighted in blue in Figure 21). This gives the users an option to control the surrounding                                        lights and center lights separately.    During the day, this space is mainly dependent on artificial lighting. But it is important to separate and group the blue                                          lighting systems according to the function of space directly below it.    During the night, this space will be fully dependent on artificial lighting.             
  • 20.
    4.4 SPACE B: CULTURAL COLLECTION 2  4.4.1 ROOM INDEX CLACULATION    Room dimensions  L = 19.89m   W = 6.5m    Ceiling height  4.0m    Height of working plane  0.8m    Mounted height of fitting above the working plane  (H​m​ )  4 – 0.8 = 3.2m    Room Index, RI  IR = 19.89×6.5 (19.89+6.5)(3.2)   IR = 84.448 129.285   I .53R = 1       4.4.2 LUMEN METHOD CALCULATION    Illuminance level required (E, lux)    IES Standard Illumination Level for reading space in library  = 300lux    Area at working plane height (A, m​2​ )    19.89 X 6.5 = 129.285m​2  Average luminous flux from each lamp (F, lm)    2000  Utilization Factor (UF)  0.6 (based on UF table)    Maintenance Factor (MF)  0.8 (standard)    Number of Lamps Required (N)  N = 300×129.285 2000×0.6×0.8   N = 960 38785.5   0.4N = 4   ∴ ​Total number of lamps required = 40 lamps    Maximum horizontal spacing between fittings ( )Smax       .0×3.2Smax = 1   .2 mSmax = 3   ∴ ​Distance between lights should not be greater than 3.2m          4.4.3. Reflected Ceiling Plan & Artificial Lighting Contour Analysis  
  • 21.
        Figure 22 &23 Light fixtures arrangement according to calculations ; Lighting simulation contour during an evening  setting with the space being fully dependent on artificial lighting.                    4.4.4. PSALI Intergration 
  • 22.
      Proper shading andscreening devices are added onto openings  to overcome the issue of glare providing users with a much  more visually comfortable space. Ideally this space should be  fully dependent on natural daylight and independent of artificial  lighting during the day.    Since the areas directly next to the openings and façade  screenings are the areas that receive more natural light, lighting  that are above those areas should be grouped to one switch  (highlighted in red in Figure 24). And the remaining lights that  are in the center should be grouped as another switch  (highlighted in blue in Figure 24). This gives the users an option  to control the surrounding lights and center lights separately.    During the night, this space will be fully dependent on artificial  lighting.                            Figure 24 Separation of lighting system.