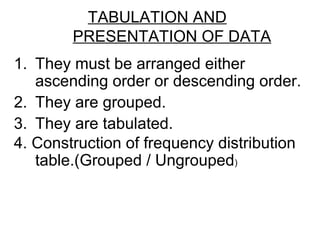
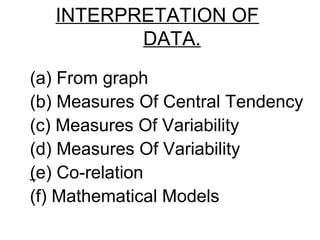
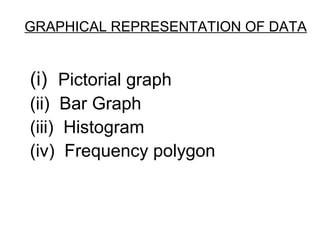
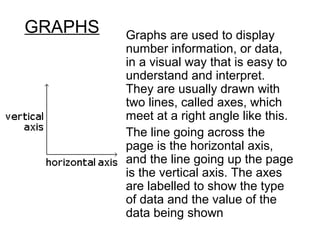
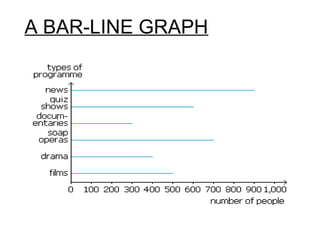
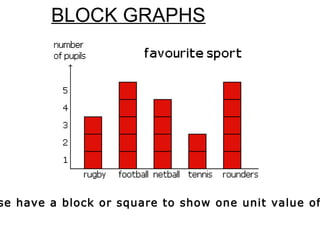
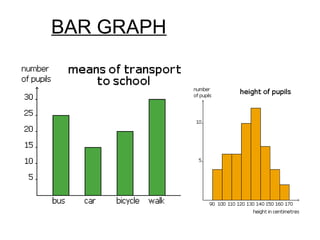
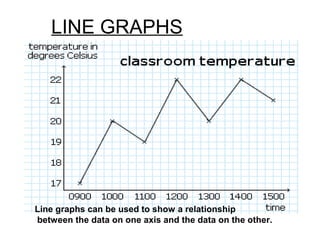
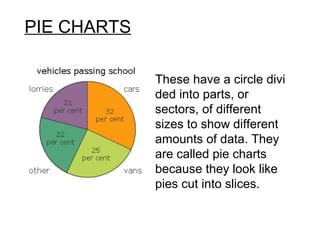
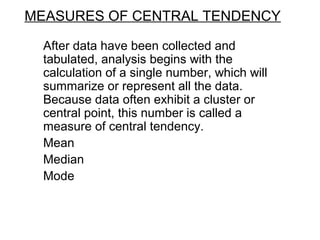
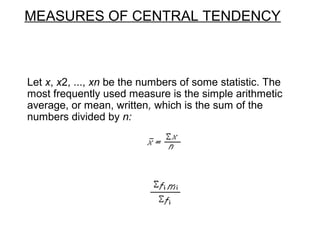
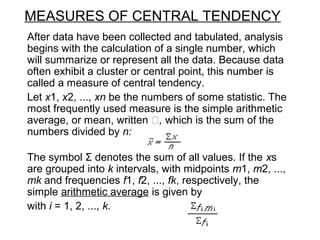
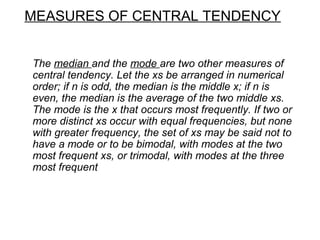
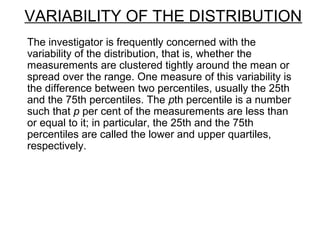
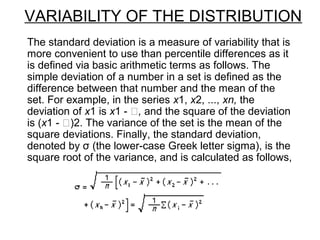
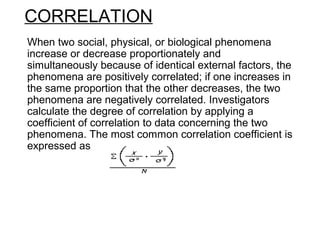
SlideShare a Scribd company logo
STATISTICS
MRS.P.NAYAK,P.G.T K.V.F.W
STATISTICS
Statistics, branch of mathematics
that deals with the collection,
organization, and analysis of
numerical decision-making.
HISTORY
Simple forms of statistics have
been used since the beginning of
civilization, when pictorial
representations or other symbols
were used to record numbers of
people, animals, and inanimate
objects on skins, slabs, sticks of
wood, or the walls of caves.
Before 3000 bc the
Babylonians used small
clay tablets to record
tabulations of agricultural
yields and of commodities
bartered or sold.
The Egyptians analysed the
population and material wealth of
their country before beginning to
build the pyramids in the 31st century
bc.
The Roman Empire was the first
government to gather extensive data
about the population, area, and
wealth of the territories that it
controlled.
Registration of deaths and births was
begun in England in the early 16th
century, and in 1662 the first
noteworthy statistical study of
population.
At present, statistics is a reliable means
of describing accurately the values of
economic, political, social, psychological,
biological, and physical data and serves
as a tool to correlate and analyse such
data. The work of the statistician is no
longer confined to gathering and
tabulating data, but is chiefly a process of
interpreting the information.
STATISTICAL METHODS
STEPS
• COLLECTION OF DATA
• TABULATION AND PRESENTATION
OF DATA
• INTERPRETATION OF DATA.
COLLECTION OF DATA:
Primary Data –
When Data are collected directly
it is called Primary Data.
Secondary Data.
If they are collected through
others than it is called
Secondary Data.
TABULATION AND
PRESENTATION OF DATA
The collected data are called
RAW DATA
TABULATION AND
PRESENTATION OF DATA
1. They must be arranged either
ascending order or descending order.
2. They are grouped.
3. They are tabulated.
4. Construction of frequency distribution
table.(Grouped / Ungrouped)
INTERPRETATION OF
DATA.
(a) From graph
(b) Measures Of Central Tendency
(c) Measures Of Variability
(d) Measures Of Variability
(e) Co-relation
(f) Mathematical Models
GRAPHICAL REPRESENTATION OF DATA
(i) Pictorial graph
(ii) Bar Graph
(iii) Histogram
(iv) Frequency polygon
GRAPHS Graphs are used to display
number information, or data,
in a visual way that is easy to
understand and interpret.
They are usually drawn with
two lines, called axes, which
meet at a right angle like this.
The line going across the
page is the horizontal axis,
and the line going up the page
is the vertical axis. The axes
are labelled to show the type
of data and the value of the
data being shown
A BAR-LINE GRAPH
BLOCK GRAPHS
se have a block or square to show one unit value of
BAR GRAPH
LINE GRAPHS
Line graphs can be used to show a relationship
 between the data on one axis and the data on the other. 
PIE CHARTS
These have a circle divi
ded into parts, or
sectors, of different
sizes to show different
amounts of data. They
are called pie charts
because they look like
pies cut into slices.
MEASURES OF CENTRAL TENDENCY
After data have been collected and
tabulated, analysis begins with the
calculation of a single number, which will
summarize or represent all the data.
Because data often exhibit a cluster or
central point, this number is called a
measure of central tendency.
Mean
Median
Mode
MEASURES OF CENTRAL TENDENCY
Let x, x2, ..., xn be the numbers of some statistic. The
most frequently used measure is the simple arithmetic
average, or mean, written, which is the sum of the
numbers divided by n:
MEASURES OF CENTRAL TENDENCY
After data have been collected and tabulated, analysis
begins with the calculation of a single number, which
will summarize or represent all the data. Because data
often exhibit a cluster or central point, this number is
called a measure of central tendency.
Let x1, x2, ..., xn be the numbers of some statistic. The
most frequently used measure is the simple arithmetic
average, or mean, written , which is the sum of the
numbers divided by n:
The symbol Σ denotes the sum of all values. If the xs
are grouped into k intervals, with midpoints m1, m2, ...,
mk and frequencies f1, f2, ..., fk, respectively, the
simple arithmetic average is given by
with i = 1, 2, ..., k.
MEASURES OF CENTRAL TENDENCY
The median and the mode are two other measures of 
central tendency. Let the xs be arranged in numerical 
order; if n is odd, the median is the middle x; if n is 
even, the median is the average of the two middle xs. 
The mode is the x that occurs most frequently. If two or 
more distinct xs occur with equal frequencies, but none 
with greater frequency, the set of xs may be said not to 
have a mode or to be bimodal, with modes at the two 
most frequent xs, or trimodal, with modes at the three 
most frequent
VARIABILITY OF THE DISTRIBUTION
The investigator is frequently concerned with the
variability of the distribution, that is, whether the
measurements are clustered tightly around the mean or
spread over the range. One measure of this variability is
the difference between two percentiles, usually the 25th
and the 75th percentiles. The pth percentile is a number
such that p per cent of the measurements are less than
or equal to it; in particular, the 25th and the 75th
percentiles are called the lower and upper quartiles,
respectively.
VARIABILITY OF THE DISTRIBUTION
The standard deviation is a measure of variability that is
more convenient to use than percentile differences as it
is defined via basic arithmetic terms as follows. The
simple deviation of a number in a set is defined as the
difference between that number and the mean of the
set. For example, in the series x1, x2, ..., xn, the
deviation of x1 is x1 - , and the square of the deviation
is (x1 - )2. The variance of the set is the mean of the
square deviations. Finally, the standard deviation,
denoted by σ (the lower-case Greek letter sigma), is the
square root of the variance, and is calculated as follows,
CORRELATION
When two social, physical, or biological phenomena
increase or decrease proportionately and
simultaneously because of identical external factors, the
phenomena are positively correlated; if one increases in
the same proportion that the other decreases, the two
phenomena are negatively correlated. Investigators
calculate the degree of correlation by applying a
coefficient of correlation to data concerning the two
phenomena. The most common correlation coefficient is
expressed as
CORRELATION
in which x is the deviation of one variable from its mean,
y is the deviation of the other variable from its mean,
and N is the total number of cases in the series. A
perfect positive correlation between the two variables
results in a coefficient of +1, a perfect negative
correlation in a coefficient of -1, and a total absence of
correlation in a coefficient of 0. Thus, .89 indicates high
positive correlation, -.76 high negative correlation, and .
13 low positive correlation.
A MATHEMATICAL MODEL
In a related but more involved example of a
mathematical model, many sets of measurements have
been found to have the same type of frequency
distribution—for example, the number of 6s cast in runs
of n tosses of a die; the weights of N beans chosen
haphazardly from a bag; the barometric pressures
recorded by different students, reading the same
barometer.

More Related Content

What's hot

Charts And Graphs
Charts And GraphsCharts And Graphs
Charts And Graphs
Himadri Shekhar
 
Ogive slide share
Ogive slide shareOgive slide share
Ogive slide share
SreejayaPV
 
Different charts, Different representation
Different charts, Different representationDifferent charts, Different representation
Different charts, Different representation
Tushar Saini
 
Ogive presentation
Ogive presentationOgive presentation
Ogive presentation
SajidBepari
 
Scatter plots
Scatter plotsScatter plots
Scatter plotsMs. Jones
 
Linear regression
Linear regressionLinear regression
Linear regressionDepEd
 
O-give slide share
O-give slide shareO-give slide share
O-give slide share
SreejayaPV
 
Top 8 Different Types Of Charts In Statistics And Their Uses
Top 8 Different Types Of Charts In Statistics And Their UsesTop 8 Different Types Of Charts In Statistics And Their Uses
Top 8 Different Types Of Charts In Statistics And Their Uses
Stat Analytica
 
Different Types of Graphs
Different Types of GraphsDifferent Types of Graphs
Different Types of Graphs
RileyAntler
 
Travel in your time
Travel in your timeTravel in your time
Travel in your time
Srishti Sinha
 
Data visualization, FMIIT, STD
Data visualization, FMIIT, STDData visualization, FMIIT, STD
Data visualization, FMIIT, STDyocheff
 
Ogives slides
Ogives slidesOgives slides
Ogives slides
SreejayaPV
 
Different types of charts
Different types of chartsDifferent types of charts
Different types of charts
Zakaria Salim
 
O- gives slide share
O- gives slide shareO- gives slide share
O- gives slide share
SreejayaPV
 
Box and Whisker Plot in Biostatic
Box and Whisker Plot in BiostaticBox and Whisker Plot in Biostatic
Box and Whisker Plot in Biostatic
Muhammad Amir Sohail
 
Data analysis02 twovariables
Data analysis02 twovariablesData analysis02 twovariables
Data analysis02 twovariables
Universidade de São Paulo
 
Controlled assessment - Data Presentation
Controlled assessment - Data PresentationControlled assessment - Data Presentation
Controlled assessment - Data PresentationRCB78
 
Math in the News: 8/29/11
Math in the News: 8/29/11Math in the News: 8/29/11
Math in the News: 8/29/11
Media4math
 

What's hot (20)

Charts And Graphs
Charts And GraphsCharts And Graphs
Charts And Graphs
 
Ogive slide share
Ogive slide shareOgive slide share
Ogive slide share
 
Different charts, Different representation
Different charts, Different representationDifferent charts, Different representation
Different charts, Different representation
 
Ogive presentation
Ogive presentationOgive presentation
Ogive presentation
 
Scatter plots
Scatter plotsScatter plots
Scatter plots
 
Linear regression
Linear regressionLinear regression
Linear regression
 
O-give slide share
O-give slide shareO-give slide share
O-give slide share
 
Top 8 Different Types Of Charts In Statistics And Their Uses
Top 8 Different Types Of Charts In Statistics And Their UsesTop 8 Different Types Of Charts In Statistics And Their Uses
Top 8 Different Types Of Charts In Statistics And Their Uses
 
Different Types of Graphs
Different Types of GraphsDifferent Types of Graphs
Different Types of Graphs
 
Travel in your time
Travel in your timeTravel in your time
Travel in your time
 
Data visualization, FMIIT, STD
Data visualization, FMIIT, STDData visualization, FMIIT, STD
Data visualization, FMIIT, STD
 
Ogives slides
Ogives slidesOgives slides
Ogives slides
 
Different types of charts
Different types of chartsDifferent types of charts
Different types of charts
 
O- gives slide share
O- gives slide shareO- gives slide share
O- gives slide share
 
Box and Whisker Plot in Biostatic
Box and Whisker Plot in BiostaticBox and Whisker Plot in Biostatic
Box and Whisker Plot in Biostatic
 
Lesson 2 2
Lesson 2 2Lesson 2 2
Lesson 2 2
 
Data analysis02 twovariables
Data analysis02 twovariablesData analysis02 twovariables
Data analysis02 twovariables
 
Controlled assessment - Data Presentation
Controlled assessment - Data PresentationControlled assessment - Data Presentation
Controlled assessment - Data Presentation
 
What's mathematics
What's mathematicsWhat's mathematics
What's mathematics
 
Math in the News: 8/29/11
Math in the News: 8/29/11Math in the News: 8/29/11
Math in the News: 8/29/11
 

Viewers also liked

Prog prop 2016 2º sem
Prog prop 2016 2º semProg prop 2016 2º sem
Prog prop 2016 2º sem
Paulo Alambert
 
Evidence-Based Practice Review
Evidence-Based Practice ReviewEvidence-Based Practice Review
Evidence-Based Practice ReviewVanessa Katsma
 
Malpractice Among RNs Research Proposal
Malpractice Among RNs   Research ProposalMalpractice Among RNs   Research Proposal
Malpractice Among RNs Research Proposal
Reynel Dan
 
Practica de intervalos de confianza
Practica de intervalos de confianzaPractica de intervalos de confianza
Practica de intervalos de confianza
hmartinezf11
 
Connecting Connect with Spring Boot
Connecting Connect with Spring BootConnecting Connect with Spring Boot
Connecting Connect with Spring Boot
Vincent Kok
 
History of pi
History of piHistory of pi
History of pi
cherry ronit
 
Comperative analysis of food indusrty(nestle, shezan int, engro food ltd and ...
Comperative analysis of food indusrty(nestle, shezan int, engro food ltd and ...Comperative analysis of food indusrty(nestle, shezan int, engro food ltd and ...
Comperative analysis of food indusrty(nestle, shezan int, engro food ltd and ...
Sheeraz Khan
 
Marketing Digital para Centros Privados de Formación
Marketing Digital para Centros Privados de FormaciónMarketing Digital para Centros Privados de Formación
Marketing Digital para Centros Privados de Formación
Antonio Ortiz Ortega
 
Coordenação16
Coordenação16Coordenação16
Coordenação16
pauloalambert
 
Semiologia arterial e venosa
Semiologia arterial e venosaSemiologia arterial e venosa
Semiologia arterial e venosa
Paulo Alambert
 
INSUFICIENCIA HEPÁTICA E HIPERTENSÃO PORTA
INSUFICIENCIA HEPÁTICA E HIPERTENSÃO PORTAINSUFICIENCIA HEPÁTICA E HIPERTENSÃO PORTA
INSUFICIENCIA HEPÁTICA E HIPERTENSÃO PORTA
pauloalambert
 
Técnicas de medição arterial
Técnicas de medição arterialTécnicas de medição arterial
Técnicas de medição arterial
Ricardo Alexandre
 
Semiologia do aparelho urinário
Semiologia do aparelho urinárioSemiologia do aparelho urinário
Semiologia do aparelho urinário
pauloalambert
 
A Project on Pi
A Project on PiA Project on Pi
A Project on Pi
Rajesh Goyal
 
Semiologia del pulso
Semiologia del pulsoSemiologia del pulso
Semiologia del pulso
Génesis Cedeño
 
Kalabaag dam
Kalabaag damKalabaag dam
Kalabaag dam
ARM101
 
Cuidado enfermero en la vía aérea artificial - CICAT-SALUD
Cuidado enfermero en la vía aérea artificial - CICAT-SALUDCuidado enfermero en la vía aérea artificial - CICAT-SALUD
Cuidado enfermero en la vía aérea artificial - CICAT-SALUD
CICAT SALUD
 
Suporte Básico de Vida
Suporte Básico de VidaSuporte Básico de Vida
Suporte Básico de Vida
Pedro Alves
 

Viewers also liked (19)

Prog prop 2016 2º sem
Prog prop 2016 2º semProg prop 2016 2º sem
Prog prop 2016 2º sem
 
Evidence-Based Practice Review
Evidence-Based Practice ReviewEvidence-Based Practice Review
Evidence-Based Practice Review
 
Malpractice Among RNs Research Proposal
Malpractice Among RNs   Research ProposalMalpractice Among RNs   Research Proposal
Malpractice Among RNs Research Proposal
 
Practica de intervalos de confianza
Practica de intervalos de confianzaPractica de intervalos de confianza
Practica de intervalos de confianza
 
Connecting Connect with Spring Boot
Connecting Connect with Spring BootConnecting Connect with Spring Boot
Connecting Connect with Spring Boot
 
History of pi
History of piHistory of pi
History of pi
 
Exhibit Design
Exhibit DesignExhibit Design
Exhibit Design
 
Comperative analysis of food indusrty(nestle, shezan int, engro food ltd and ...
Comperative analysis of food indusrty(nestle, shezan int, engro food ltd and ...Comperative analysis of food indusrty(nestle, shezan int, engro food ltd and ...
Comperative analysis of food indusrty(nestle, shezan int, engro food ltd and ...
 
Marketing Digital para Centros Privados de Formación
Marketing Digital para Centros Privados de FormaciónMarketing Digital para Centros Privados de Formación
Marketing Digital para Centros Privados de Formación
 
Coordenação16
Coordenação16Coordenação16
Coordenação16
 
Semiologia arterial e venosa
Semiologia arterial e venosaSemiologia arterial e venosa
Semiologia arterial e venosa
 
INSUFICIENCIA HEPÁTICA E HIPERTENSÃO PORTA
INSUFICIENCIA HEPÁTICA E HIPERTENSÃO PORTAINSUFICIENCIA HEPÁTICA E HIPERTENSÃO PORTA
INSUFICIENCIA HEPÁTICA E HIPERTENSÃO PORTA
 
Técnicas de medição arterial
Técnicas de medição arterialTécnicas de medição arterial
Técnicas de medição arterial
 
Semiologia do aparelho urinário
Semiologia do aparelho urinárioSemiologia do aparelho urinário
Semiologia do aparelho urinário
 
A Project on Pi
A Project on PiA Project on Pi
A Project on Pi
 
Semiologia del pulso
Semiologia del pulsoSemiologia del pulso
Semiologia del pulso
 
Kalabaag dam
Kalabaag damKalabaag dam
Kalabaag dam
 
Cuidado enfermero en la vía aérea artificial - CICAT-SALUD
Cuidado enfermero en la vía aérea artificial - CICAT-SALUDCuidado enfermero en la vía aérea artificial - CICAT-SALUD
Cuidado enfermero en la vía aérea artificial - CICAT-SALUD
 
Suporte Básico de Vida
Suporte Básico de VidaSuporte Básico de Vida
Suporte Básico de Vida
 

Similar to Statisticsix

estadistica 1°
estadistica 1°estadistica 1°
estadistica 1°
italo cabrera calderon
 
Scattergrams
ScattergramsScattergrams
Scattergrams
Hana Nur Fitrah
 
REGRESSION ANALYSIS THEORY EXPLAINED HERE
REGRESSION ANALYSIS THEORY EXPLAINED HEREREGRESSION ANALYSIS THEORY EXPLAINED HERE
REGRESSION ANALYSIS THEORY EXPLAINED HERE
ShriramKargaonkar
 
Data representation and analysis - Mathematics
Data representation and analysis - MathematicsData representation and analysis - Mathematics
Data representation and analysis - Mathematics
Nayan Dagliya
 
Normal curve in Biostatistics data inference and applications
Normal curve in Biostatistics data inference and applicationsNormal curve in Biostatistics data inference and applications
Normal curve in Biostatistics data inference and applications
Bala Vidyadhar
 
Statistical Measures of Location: Mathematical Formulas versus Geometric Appr...
Statistical Measures of Location: Mathematical Formulas versus Geometric Appr...Statistical Measures of Location: Mathematical Formulas versus Geometric Appr...
Statistical Measures of Location: Mathematical Formulas versus Geometric Appr...
BRNSS Publication Hub
 
Application of Univariate, Bi-variate and Multivariate analysis Pooja k shetty
Application of Univariate, Bi-variate and Multivariate analysis Pooja k shettyApplication of Univariate, Bi-variate and Multivariate analysis Pooja k shetty
Application of Univariate, Bi-variate and Multivariate analysis Pooja k shetty
Sundar B N
 
Biostatistical methods
Biostatistical methodsBiostatistical methods
Biostatistical methods
Prakkan Hillol
 
GEOGRAPHY IGCSE: GRAPH SKILLS
GEOGRAPHY IGCSE: GRAPH SKILLSGEOGRAPHY IGCSE: GRAPH SKILLS
GEOGRAPHY IGCSE: GRAPH SKILLS
George Dumitrache
 
MSC III_Research Methodology and Statistics_Descriptive statistics.pdf
MSC III_Research Methodology and Statistics_Descriptive statistics.pdfMSC III_Research Methodology and Statistics_Descriptive statistics.pdf
MSC III_Research Methodology and Statistics_Descriptive statistics.pdf
Suchita Rawat
 
Presentation and analysis of business data
Presentation and analysis of business dataPresentation and analysis of business data
Presentation and analysis of business data
GeorginaRecto
 
Presentation and-analysis-of-business-data
Presentation and-analysis-of-business-dataPresentation and-analysis-of-business-data
Presentation and-analysis-of-business-data
lovelyquintero
 
Presentation and-analysis-of-business-data
Presentation and-analysis-of-business-dataPresentation and-analysis-of-business-data
Presentation and-analysis-of-business-data
mariantuvilla
 
Presentation and-analysis-of-business-data
Presentation and-analysis-of-business-dataPresentation and-analysis-of-business-data
Presentation and-analysis-of-business-data
lawrencechavenia
 
Presentation and-analysis-of-business-data
Presentation and-analysis-of-business-dataPresentation and-analysis-of-business-data
Presentation and-analysis-of-business-data
lovelyquintero
 
Presentation and-analysis-of-business-data
Presentation and-analysis-of-business-dataPresentation and-analysis-of-business-data
Presentation and-analysis-of-business-data
lovelyquintero
 

Similar to Statisticsix (20)

estadistica 1°
estadistica 1°estadistica 1°
estadistica 1°
 
Scattergrams
ScattergramsScattergrams
Scattergrams
 
REGRESSION ANALYSIS THEORY EXPLAINED HERE
REGRESSION ANALYSIS THEORY EXPLAINED HEREREGRESSION ANALYSIS THEORY EXPLAINED HERE
REGRESSION ANALYSIS THEORY EXPLAINED HERE
 
Data representation and analysis - Mathematics
Data representation and analysis - MathematicsData representation and analysis - Mathematics
Data representation and analysis - Mathematics
 
Normal curve in Biostatistics data inference and applications
Normal curve in Biostatistics data inference and applicationsNormal curve in Biostatistics data inference and applications
Normal curve in Biostatistics data inference and applications
 
Regression
RegressionRegression
Regression
 
Statistical Measures of Location: Mathematical Formulas versus Geometric Appr...
Statistical Measures of Location: Mathematical Formulas versus Geometric Appr...Statistical Measures of Location: Mathematical Formulas versus Geometric Appr...
Statistical Measures of Location: Mathematical Formulas versus Geometric Appr...
 
Application of Univariate, Bi-variate and Multivariate analysis Pooja k shetty
Application of Univariate, Bi-variate and Multivariate analysis Pooja k shettyApplication of Univariate, Bi-variate and Multivariate analysis Pooja k shetty
Application of Univariate, Bi-variate and Multivariate analysis Pooja k shetty
 
Regression
RegressionRegression
Regression
 
01_AJMS_18_19_RA.pdf
01_AJMS_18_19_RA.pdf01_AJMS_18_19_RA.pdf
01_AJMS_18_19_RA.pdf
 
01_AJMS_18_19_RA.pdf
01_AJMS_18_19_RA.pdf01_AJMS_18_19_RA.pdf
01_AJMS_18_19_RA.pdf
 
Biostatistical methods
Biostatistical methodsBiostatistical methods
Biostatistical methods
 
GEOGRAPHY IGCSE: GRAPH SKILLS
GEOGRAPHY IGCSE: GRAPH SKILLSGEOGRAPHY IGCSE: GRAPH SKILLS
GEOGRAPHY IGCSE: GRAPH SKILLS
 
MSC III_Research Methodology and Statistics_Descriptive statistics.pdf
MSC III_Research Methodology and Statistics_Descriptive statistics.pdfMSC III_Research Methodology and Statistics_Descriptive statistics.pdf
MSC III_Research Methodology and Statistics_Descriptive statistics.pdf
 
Presentation and analysis of business data
Presentation and analysis of business dataPresentation and analysis of business data
Presentation and analysis of business data
 
Presentation and-analysis-of-business-data
Presentation and-analysis-of-business-dataPresentation and-analysis-of-business-data
Presentation and-analysis-of-business-data
 
Presentation and-analysis-of-business-data
Presentation and-analysis-of-business-dataPresentation and-analysis-of-business-data
Presentation and-analysis-of-business-data
 
Presentation and-analysis-of-business-data
Presentation and-analysis-of-business-dataPresentation and-analysis-of-business-data
Presentation and-analysis-of-business-data
 
Presentation and-analysis-of-business-data
Presentation and-analysis-of-business-dataPresentation and-analysis-of-business-data
Presentation and-analysis-of-business-data
 
Presentation and-analysis-of-business-data
Presentation and-analysis-of-business-dataPresentation and-analysis-of-business-data
Presentation and-analysis-of-business-data
 

More from Pratima Nayak ,Kendriya Vidyalaya Sangathan

Sustained & active_engagement_with_every_child - Pratima Nayak
Sustained &  active_engagement_with_every_child - Pratima NayakSustained &  active_engagement_with_every_child - Pratima Nayak
Sustained & active_engagement_with_every_child - Pratima Nayak
Pratima Nayak ,Kendriya Vidyalaya Sangathan
 
Solving addition word problem knowing key words
Solving addition word problem knowing key wordsSolving addition word problem knowing key words
Solving addition word problem knowing key words
Pratima Nayak ,Kendriya Vidyalaya Sangathan
 
Project based learning Primary Mathematics
Project based learning Primary MathematicsProject based learning Primary Mathematics
Project based learning Primary Mathematics
Pratima Nayak ,Kendriya Vidyalaya Sangathan
 
Triangles(Tribhuja) in odia language
Triangles(Tribhuja) in odia languageTriangles(Tribhuja) in odia language
Triangles(Tribhuja) in odia language
Pratima Nayak ,Kendriya Vidyalaya Sangathan
 
Tips to deal with adolescent behavior- for parents
Tips to deal with adolescent behavior- for parentsTips to deal with adolescent behavior- for parents
Tips to deal with adolescent behavior- for parents
Pratima Nayak ,Kendriya Vidyalaya Sangathan
 
Common problems of adolescents
Common problems of adolescentsCommon problems of adolescents
Common problems of adolescents
Pratima Nayak ,Kendriya Vidyalaya Sangathan
 
Learning disability
Learning disabilityLearning disability
Life skill - Self Esteem
Life skill - Self EsteemLife skill - Self Esteem
Class XII CBSE new Mathematics Question Paper Design-2016-17
Class XII CBSE new Mathematics Question Paper Design-2016-17Class XII CBSE new Mathematics Question Paper Design-2016-17
Class XII CBSE new Mathematics Question Paper Design-2016-17
Pratima Nayak ,Kendriya Vidyalaya Sangathan
 
Changed pattern of CBSE Class XII Mathematics -2016-17-with_marking_scheme
Changed pattern of CBSE Class XII Mathematics -2016-17-with_marking_schemeChanged pattern of CBSE Class XII Mathematics -2016-17-with_marking_scheme
Changed pattern of CBSE Class XII Mathematics -2016-17-with_marking_scheme
Pratima Nayak ,Kendriya Vidyalaya Sangathan
 
My Teachers day message to teachers- we can win
My Teachers day message to teachers- we can winMy Teachers day message to teachers- we can win
My Teachers day message to teachers- we can win
Pratima Nayak ,Kendriya Vidyalaya Sangathan
 
Questions of adolescents
Questions of adolescentsQuestions of adolescents
क्रोध प्रबंधन: Why to Manage anger?
क्रोध प्रबंधन: Why to Manage anger? क्रोध प्रबंधन: Why to Manage anger?
क्रोध प्रबंधन: Why to Manage anger?
Pratima Nayak ,Kendriya Vidyalaya Sangathan
 
Sadness flies away on the wings of time.
Sadness flies away on the wings of time. Sadness flies away on the wings of time.
Sadness flies away on the wings of time.
Pratima Nayak ,Kendriya Vidyalaya Sangathan
 
To my beloved daughter
To my beloved daughterTo my beloved daughter
Emotional skills:Dealing with sadness
Emotional skills:Dealing with sadnessEmotional skills:Dealing with sadness
Emotional skills:Dealing with sadness
Pratima Nayak ,Kendriya Vidyalaya Sangathan
 
Pushing badmood upwards
Pushing badmood upwardsPushing badmood upwards
Sexting?What would your Grandma Think?
Sexting?What would your Grandma Think?Sexting?What would your Grandma Think?
Sexting?What would your Grandma Think?
Pratima Nayak ,Kendriya Vidyalaya Sangathan
 
Emotions : important survival issue
Emotions : important survival issueEmotions : important survival issue
Emotions : important survival issue
Pratima Nayak ,Kendriya Vidyalaya Sangathan
 
Parents must know about cyber bullying 2
Parents must know about cyber bullying  2Parents must know about cyber bullying  2
Parents must know about cyber bullying 2
Pratima Nayak ,Kendriya Vidyalaya Sangathan
 

More from Pratima Nayak ,Kendriya Vidyalaya Sangathan (20)

Sustained & active_engagement_with_every_child - Pratima Nayak
Sustained &  active_engagement_with_every_child - Pratima NayakSustained &  active_engagement_with_every_child - Pratima Nayak
Sustained & active_engagement_with_every_child - Pratima Nayak
 
Solving addition word problem knowing key words
Solving addition word problem knowing key wordsSolving addition word problem knowing key words
Solving addition word problem knowing key words
 
Project based learning Primary Mathematics
Project based learning Primary MathematicsProject based learning Primary Mathematics
Project based learning Primary Mathematics
 
Triangles(Tribhuja) in odia language
Triangles(Tribhuja) in odia languageTriangles(Tribhuja) in odia language
Triangles(Tribhuja) in odia language
 
Tips to deal with adolescent behavior- for parents
Tips to deal with adolescent behavior- for parentsTips to deal with adolescent behavior- for parents
Tips to deal with adolescent behavior- for parents
 
Common problems of adolescents
Common problems of adolescentsCommon problems of adolescents
Common problems of adolescents
 
Learning disability
Learning disabilityLearning disability
Learning disability
 
Life skill - Self Esteem
Life skill - Self EsteemLife skill - Self Esteem
Life skill - Self Esteem
 
Class XII CBSE new Mathematics Question Paper Design-2016-17
Class XII CBSE new Mathematics Question Paper Design-2016-17Class XII CBSE new Mathematics Question Paper Design-2016-17
Class XII CBSE new Mathematics Question Paper Design-2016-17
 
Changed pattern of CBSE Class XII Mathematics -2016-17-with_marking_scheme
Changed pattern of CBSE Class XII Mathematics -2016-17-with_marking_schemeChanged pattern of CBSE Class XII Mathematics -2016-17-with_marking_scheme
Changed pattern of CBSE Class XII Mathematics -2016-17-with_marking_scheme
 
My Teachers day message to teachers- we can win
My Teachers day message to teachers- we can winMy Teachers day message to teachers- we can win
My Teachers day message to teachers- we can win
 
Questions of adolescents
Questions of adolescentsQuestions of adolescents
Questions of adolescents
 
क्रोध प्रबंधन: Why to Manage anger?
क्रोध प्रबंधन: Why to Manage anger? क्रोध प्रबंधन: Why to Manage anger?
क्रोध प्रबंधन: Why to Manage anger?
 
Sadness flies away on the wings of time.
Sadness flies away on the wings of time. Sadness flies away on the wings of time.
Sadness flies away on the wings of time.
 
To my beloved daughter
To my beloved daughterTo my beloved daughter
To my beloved daughter
 
Emotional skills:Dealing with sadness
Emotional skills:Dealing with sadnessEmotional skills:Dealing with sadness
Emotional skills:Dealing with sadness
 
Pushing badmood upwards
Pushing badmood upwardsPushing badmood upwards
Pushing badmood upwards
 
Sexting?What would your Grandma Think?
Sexting?What would your Grandma Think?Sexting?What would your Grandma Think?
Sexting?What would your Grandma Think?
 
Emotions : important survival issue
Emotions : important survival issueEmotions : important survival issue
Emotions : important survival issue
 
Parents must know about cyber bullying 2
Parents must know about cyber bullying  2Parents must know about cyber bullying  2
Parents must know about cyber bullying 2
 

Recently uploaded

LF Energy Webinar: Electrical Grid Modelling and Simulation Through PowSyBl -...
LF Energy Webinar: Electrical Grid Modelling and Simulation Through PowSyBl -...LF Energy Webinar: Electrical Grid Modelling and Simulation Through PowSyBl -...
LF Energy Webinar: Electrical Grid Modelling and Simulation Through PowSyBl -...
DanBrown980551
 
Observability Concepts EVERY Developer Should Know -- DeveloperWeek Europe.pdf
Observability Concepts EVERY Developer Should Know -- DeveloperWeek Europe.pdfObservability Concepts EVERY Developer Should Know -- DeveloperWeek Europe.pdf
Observability Concepts EVERY Developer Should Know -- DeveloperWeek Europe.pdf
Paige Cruz
 
PHP Frameworks: I want to break free (IPC Berlin 2024)
PHP Frameworks: I want to break free (IPC Berlin 2024)PHP Frameworks: I want to break free (IPC Berlin 2024)
PHP Frameworks: I want to break free (IPC Berlin 2024)
Ralf Eggert
 
The Art of the Pitch: WordPress Relationships and Sales
The Art of the Pitch: WordPress Relationships and SalesThe Art of the Pitch: WordPress Relationships and Sales
The Art of the Pitch: WordPress Relationships and Sales
Laura Byrne
 
Securing your Kubernetes cluster_ a step-by-step guide to success !
Securing your Kubernetes cluster_ a step-by-step guide to success !Securing your Kubernetes cluster_ a step-by-step guide to success !
Securing your Kubernetes cluster_ a step-by-step guide to success !
KatiaHIMEUR1
 
Alt. GDG Cloud Southlake #33: Boule & Rebala: Effective AppSec in SDLC using ...
Alt. GDG Cloud Southlake #33: Boule & Rebala: Effective AppSec in SDLC using ...Alt. GDG Cloud Southlake #33: Boule & Rebala: Effective AppSec in SDLC using ...
Alt. GDG Cloud Southlake #33: Boule & Rebala: Effective AppSec in SDLC using ...
James Anderson
 
PCI PIN Basics Webinar from the Controlcase Team
PCI PIN Basics Webinar from the Controlcase TeamPCI PIN Basics Webinar from the Controlcase Team
PCI PIN Basics Webinar from the Controlcase Team
ControlCase
 
Removing Uninteresting Bytes in Software Fuzzing
Removing Uninteresting Bytes in Software FuzzingRemoving Uninteresting Bytes in Software Fuzzing
Removing Uninteresting Bytes in Software Fuzzing
Aftab Hussain
 
GraphSummit Singapore | Graphing Success: Revolutionising Organisational Stru...
GraphSummit Singapore | Graphing Success: Revolutionising Organisational Stru...GraphSummit Singapore | Graphing Success: Revolutionising Organisational Stru...
GraphSummit Singapore | Graphing Success: Revolutionising Organisational Stru...
Neo4j
 
GraphRAG is All You need? LLM & Knowledge Graph
GraphRAG is All You need? LLM & Knowledge GraphGraphRAG is All You need? LLM & Knowledge Graph
GraphRAG is All You need? LLM & Knowledge Graph
Guy Korland
 
SAP Sapphire 2024 - ASUG301 building better apps with SAP Fiori.pdf
SAP Sapphire 2024 - ASUG301 building better apps with SAP Fiori.pdfSAP Sapphire 2024 - ASUG301 building better apps with SAP Fiori.pdf
SAP Sapphire 2024 - ASUG301 building better apps with SAP Fiori.pdf
Peter Spielvogel
 
Epistemic Interaction - tuning interfaces to provide information for AI support
Epistemic Interaction - tuning interfaces to provide information for AI supportEpistemic Interaction - tuning interfaces to provide information for AI support
Epistemic Interaction - tuning interfaces to provide information for AI support
Alan Dix
 
Encryption in Microsoft 365 - ExpertsLive Netherlands 2024
Encryption in Microsoft 365 - ExpertsLive Netherlands 2024Encryption in Microsoft 365 - ExpertsLive Netherlands 2024
Encryption in Microsoft 365 - ExpertsLive Netherlands 2024
Albert Hoitingh
 
GraphSummit Singapore | The Art of the Possible with Graph - Q2 2024
GraphSummit Singapore | The Art of the  Possible with Graph - Q2 2024GraphSummit Singapore | The Art of the  Possible with Graph - Q2 2024
GraphSummit Singapore | The Art of the Possible with Graph - Q2 2024
Neo4j
 
By Design, not by Accident - Agile Venture Bolzano 2024
By Design, not by Accident - Agile Venture Bolzano 2024By Design, not by Accident - Agile Venture Bolzano 2024
By Design, not by Accident - Agile Venture Bolzano 2024
Pierluigi Pugliese
 
20240605 QFM017 Machine Intelligence Reading List May 2024
20240605 QFM017 Machine Intelligence Reading List May 202420240605 QFM017 Machine Intelligence Reading List May 2024
20240605 QFM017 Machine Intelligence Reading List May 2024
Matthew Sinclair
 
UiPath Test Automation using UiPath Test Suite series, part 5
UiPath Test Automation using UiPath Test Suite series, part 5UiPath Test Automation using UiPath Test Suite series, part 5
UiPath Test Automation using UiPath Test Suite series, part 5
DianaGray10
 
Climate Impact of Software Testing at Nordic Testing Days
Climate Impact of Software Testing at Nordic Testing DaysClimate Impact of Software Testing at Nordic Testing Days
Climate Impact of Software Testing at Nordic Testing Days
Kari Kakkonen
 
DevOps and Testing slides at DASA Connect
DevOps and Testing slides at DASA ConnectDevOps and Testing slides at DASA Connect
DevOps and Testing slides at DASA Connect
Kari Kakkonen
 
20240607 QFM018 Elixir Reading List May 2024
20240607 QFM018 Elixir Reading List May 202420240607 QFM018 Elixir Reading List May 2024
20240607 QFM018 Elixir Reading List May 2024
Matthew Sinclair
 

Recently uploaded (20)

LF Energy Webinar: Electrical Grid Modelling and Simulation Through PowSyBl -...
LF Energy Webinar: Electrical Grid Modelling and Simulation Through PowSyBl -...LF Energy Webinar: Electrical Grid Modelling and Simulation Through PowSyBl -...
LF Energy Webinar: Electrical Grid Modelling and Simulation Through PowSyBl -...
 
Observability Concepts EVERY Developer Should Know -- DeveloperWeek Europe.pdf
Observability Concepts EVERY Developer Should Know -- DeveloperWeek Europe.pdfObservability Concepts EVERY Developer Should Know -- DeveloperWeek Europe.pdf
Observability Concepts EVERY Developer Should Know -- DeveloperWeek Europe.pdf
 
PHP Frameworks: I want to break free (IPC Berlin 2024)
PHP Frameworks: I want to break free (IPC Berlin 2024)PHP Frameworks: I want to break free (IPC Berlin 2024)
PHP Frameworks: I want to break free (IPC Berlin 2024)
 
The Art of the Pitch: WordPress Relationships and Sales
The Art of the Pitch: WordPress Relationships and SalesThe Art of the Pitch: WordPress Relationships and Sales
The Art of the Pitch: WordPress Relationships and Sales
 
Securing your Kubernetes cluster_ a step-by-step guide to success !
Securing your Kubernetes cluster_ a step-by-step guide to success !Securing your Kubernetes cluster_ a step-by-step guide to success !
Securing your Kubernetes cluster_ a step-by-step guide to success !
 
Alt. GDG Cloud Southlake #33: Boule & Rebala: Effective AppSec in SDLC using ...
Alt. GDG Cloud Southlake #33: Boule & Rebala: Effective AppSec in SDLC using ...Alt. GDG Cloud Southlake #33: Boule & Rebala: Effective AppSec in SDLC using ...
Alt. GDG Cloud Southlake #33: Boule & Rebala: Effective AppSec in SDLC using ...
 
PCI PIN Basics Webinar from the Controlcase Team
PCI PIN Basics Webinar from the Controlcase TeamPCI PIN Basics Webinar from the Controlcase Team
PCI PIN Basics Webinar from the Controlcase Team
 
Removing Uninteresting Bytes in Software Fuzzing
Removing Uninteresting Bytes in Software FuzzingRemoving Uninteresting Bytes in Software Fuzzing
Removing Uninteresting Bytes in Software Fuzzing
 
GraphSummit Singapore | Graphing Success: Revolutionising Organisational Stru...
GraphSummit Singapore | Graphing Success: Revolutionising Organisational Stru...GraphSummit Singapore | Graphing Success: Revolutionising Organisational Stru...
GraphSummit Singapore | Graphing Success: Revolutionising Organisational Stru...
 
GraphRAG is All You need? LLM & Knowledge Graph
GraphRAG is All You need? LLM & Knowledge GraphGraphRAG is All You need? LLM & Knowledge Graph
GraphRAG is All You need? LLM & Knowledge Graph
 
SAP Sapphire 2024 - ASUG301 building better apps with SAP Fiori.pdf
SAP Sapphire 2024 - ASUG301 building better apps with SAP Fiori.pdfSAP Sapphire 2024 - ASUG301 building better apps with SAP Fiori.pdf
SAP Sapphire 2024 - ASUG301 building better apps with SAP Fiori.pdf
 
Epistemic Interaction - tuning interfaces to provide information for AI support
Epistemic Interaction - tuning interfaces to provide information for AI supportEpistemic Interaction - tuning interfaces to provide information for AI support
Epistemic Interaction - tuning interfaces to provide information for AI support
 
Encryption in Microsoft 365 - ExpertsLive Netherlands 2024
Encryption in Microsoft 365 - ExpertsLive Netherlands 2024Encryption in Microsoft 365 - ExpertsLive Netherlands 2024
Encryption in Microsoft 365 - ExpertsLive Netherlands 2024
 
GraphSummit Singapore | The Art of the Possible with Graph - Q2 2024
GraphSummit Singapore | The Art of the  Possible with Graph - Q2 2024GraphSummit Singapore | The Art of the  Possible with Graph - Q2 2024
GraphSummit Singapore | The Art of the Possible with Graph - Q2 2024
 
By Design, not by Accident - Agile Venture Bolzano 2024
By Design, not by Accident - Agile Venture Bolzano 2024By Design, not by Accident - Agile Venture Bolzano 2024
By Design, not by Accident - Agile Venture Bolzano 2024
 
20240605 QFM017 Machine Intelligence Reading List May 2024
20240605 QFM017 Machine Intelligence Reading List May 202420240605 QFM017 Machine Intelligence Reading List May 2024
20240605 QFM017 Machine Intelligence Reading List May 2024
 
UiPath Test Automation using UiPath Test Suite series, part 5
UiPath Test Automation using UiPath Test Suite series, part 5UiPath Test Automation using UiPath Test Suite series, part 5
UiPath Test Automation using UiPath Test Suite series, part 5
 
Climate Impact of Software Testing at Nordic Testing Days
Climate Impact of Software Testing at Nordic Testing DaysClimate Impact of Software Testing at Nordic Testing Days
Climate Impact of Software Testing at Nordic Testing Days
 
DevOps and Testing slides at DASA Connect
DevOps and Testing slides at DASA ConnectDevOps and Testing slides at DASA Connect
DevOps and Testing slides at DASA Connect
 
20240607 QFM018 Elixir Reading List May 2024
20240607 QFM018 Elixir Reading List May 202420240607 QFM018 Elixir Reading List May 2024
20240607 QFM018 Elixir Reading List May 2024
 

Statisticsix

  • 2. STATISTICS Statistics, branch of mathematics that deals with the collection, organization, and analysis of numerical decision-making.
  • 3. HISTORY Simple forms of statistics have been used since the beginning of civilization, when pictorial representations or other symbols were used to record numbers of people, animals, and inanimate objects on skins, slabs, sticks of wood, or the walls of caves.
  • 4. Before 3000 bc the Babylonians used small clay tablets to record tabulations of agricultural yields and of commodities bartered or sold.
  • 5. The Egyptians analysed the population and material wealth of their country before beginning to build the pyramids in the 31st century bc.
  • 6. The Roman Empire was the first government to gather extensive data about the population, area, and wealth of the territories that it controlled.
  • 7. Registration of deaths and births was begun in England in the early 16th century, and in 1662 the first noteworthy statistical study of population.
  • 8. At present, statistics is a reliable means of describing accurately the values of economic, political, social, psychological, biological, and physical data and serves as a tool to correlate and analyse such data. The work of the statistician is no longer confined to gathering and tabulating data, but is chiefly a process of interpreting the information.
  • 9. STATISTICAL METHODS STEPS • COLLECTION OF DATA • TABULATION AND PRESENTATION OF DATA • INTERPRETATION OF DATA.
  • 10. COLLECTION OF DATA: Primary Data – When Data are collected directly it is called Primary Data. Secondary Data. If they are collected through others than it is called Secondary Data.
  • 11. TABULATION AND PRESENTATION OF DATA The collected data are called RAW DATA
  • 12. TABULATION AND PRESENTATION OF DATA 1. They must be arranged either ascending order or descending order. 2. They are grouped. 3. They are tabulated. 4. Construction of frequency distribution table.(Grouped / Ungrouped)
  • 13. INTERPRETATION OF DATA. (a) From graph (b) Measures Of Central Tendency (c) Measures Of Variability (d) Measures Of Variability (e) Co-relation (f) Mathematical Models
  • 14. GRAPHICAL REPRESENTATION OF DATA (i) Pictorial graph (ii) Bar Graph (iii) Histogram (iv) Frequency polygon
  • 15. GRAPHS Graphs are used to display number information, or data, in a visual way that is easy to understand and interpret. They are usually drawn with two lines, called axes, which meet at a right angle like this. The line going across the page is the horizontal axis, and the line going up the page is the vertical axis. The axes are labelled to show the type of data and the value of the data being shown
  • 20. PIE CHARTS These have a circle divi ded into parts, or sectors, of different sizes to show different amounts of data. They are called pie charts because they look like pies cut into slices.
  • 21. MEASURES OF CENTRAL TENDENCY After data have been collected and tabulated, analysis begins with the calculation of a single number, which will summarize or represent all the data. Because data often exhibit a cluster or central point, this number is called a measure of central tendency. Mean Median Mode
  • 22. MEASURES OF CENTRAL TENDENCY Let x, x2, ..., xn be the numbers of some statistic. The most frequently used measure is the simple arithmetic average, or mean, written, which is the sum of the numbers divided by n:
  • 23. MEASURES OF CENTRAL TENDENCY After data have been collected and tabulated, analysis begins with the calculation of a single number, which will summarize or represent all the data. Because data often exhibit a cluster or central point, this number is called a measure of central tendency. Let x1, x2, ..., xn be the numbers of some statistic. The most frequently used measure is the simple arithmetic average, or mean, written , which is the sum of the numbers divided by n: The symbol Σ denotes the sum of all values. If the xs are grouped into k intervals, with midpoints m1, m2, ..., mk and frequencies f1, f2, ..., fk, respectively, the simple arithmetic average is given by with i = 1, 2, ..., k.
  • 24. MEASURES OF CENTRAL TENDENCY The median and the mode are two other measures of  central tendency. Let the xs be arranged in numerical  order; if n is odd, the median is the middle x; if n is  even, the median is the average of the two middle xs.  The mode is the x that occurs most frequently. If two or  more distinct xs occur with equal frequencies, but none  with greater frequency, the set of xs may be said not to  have a mode or to be bimodal, with modes at the two  most frequent xs, or trimodal, with modes at the three  most frequent
  • 25. VARIABILITY OF THE DISTRIBUTION The investigator is frequently concerned with the variability of the distribution, that is, whether the measurements are clustered tightly around the mean or spread over the range. One measure of this variability is the difference between two percentiles, usually the 25th and the 75th percentiles. The pth percentile is a number such that p per cent of the measurements are less than or equal to it; in particular, the 25th and the 75th percentiles are called the lower and upper quartiles, respectively.
  • 26. VARIABILITY OF THE DISTRIBUTION The standard deviation is a measure of variability that is more convenient to use than percentile differences as it is defined via basic arithmetic terms as follows. The simple deviation of a number in a set is defined as the difference between that number and the mean of the set. For example, in the series x1, x2, ..., xn, the deviation of x1 is x1 - , and the square of the deviation is (x1 - )2. The variance of the set is the mean of the square deviations. Finally, the standard deviation, denoted by σ (the lower-case Greek letter sigma), is the square root of the variance, and is calculated as follows,
  • 27. CORRELATION When two social, physical, or biological phenomena increase or decrease proportionately and simultaneously because of identical external factors, the phenomena are positively correlated; if one increases in the same proportion that the other decreases, the two phenomena are negatively correlated. Investigators calculate the degree of correlation by applying a coefficient of correlation to data concerning the two phenomena. The most common correlation coefficient is expressed as
  • 28. CORRELATION in which x is the deviation of one variable from its mean, y is the deviation of the other variable from its mean, and N is the total number of cases in the series. A perfect positive correlation between the two variables results in a coefficient of +1, a perfect negative correlation in a coefficient of -1, and a total absence of correlation in a coefficient of 0. Thus, .89 indicates high positive correlation, -.76 high negative correlation, and . 13 low positive correlation.
  • 29. A MATHEMATICAL MODEL In a related but more involved example of a mathematical model, many sets of measurements have been found to have the same type of frequency distribution—for example, the number of 6s cast in runs of n tosses of a die; the weights of N beans chosen haphazardly from a bag; the barometric pressures recorded by different students, reading the same barometer.